
The purpose of this article is to emphasize the necessity of price valuation of stocks before their purchase. Ideally, the valuation must be done through the intrinsic value method. But as it is a relatively complicated process, Price To Earning Ratio (PE Ratio) analysis can also be used. How to implement the PE ratio analysis for stock valuation is discussed here.
Introduction
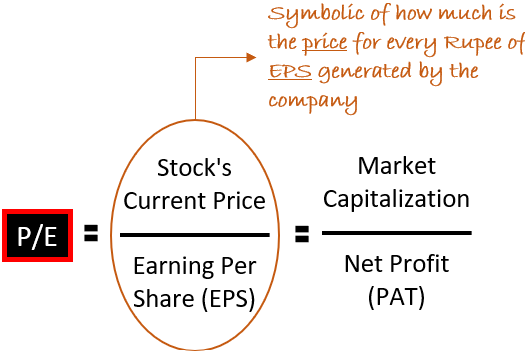
[Check Industry’s PE] The price-to-earnings ratio (P/E) is a financial metric we use to check if the price of a stock is high or low. The P/E ratio gives an idea to the analyst about the stock’s valuation – overvalued or undervalued.
The P/E ratio compares the company’s price (or Market Capitalization) with its earnings per share – EPS (or net profit – PAT). This way, it measures how many times is the price compared to the EPS. A P/E of 15 means, the share is available at a price that is 15 times its EPS.
Table of Contents
- Point #1: Price To Earnings Ratio (P/E) Formula
- – Observation #1: PE must be compared with a reference
- – Observation #2: Watching the numerator & denominator
- – Observation #3: PE points towards the fair price
- – Observation #4: There are two types of PE
- Point #2: Price-To-Earnings Ratio (P/E) Calculation
- – Calculatw forward PE
- Point #3: Interpretation of P/E Ratio
- – #3.1: Interpretation from the valuation perspective
- – #3.2: Interpretation from the future growth perspective
- Conclusion
Video
Point #1: PE Ratio Formula
Let’s see what the Price To Earnings Ratio (P/E) Formula looks like:
In the P/E ratio formula, there are two components, price and earnings per share (EPS). Following are the observations related to the formula and its components:
Observation #1: PE must be compared with a reference
A stock whose earnings multiple (P/E) is 10, what does it mean? It means, its price is equal to 10 times EPS, or in other words, its market cap is equal to 10 times the net profit (PAT).
How to know if the price-to-earnings ratio (P/E) so calculated is high or low? It can be known by doing a comparative analysis. There are two ways:
- Index Comparison: The calculated P/E ratio of a stock can be compared with the P/E ratio of the main indices like Nifty50, Sensex, Nifty Next 50, BSE 100, etc. For example, The P/E ratio of Nifty 50 over the last 30 days is 22.02 times. If a stock’s P/E is greater than 22, we can say that it is more expensive than the Nifty50 index.
- Industry Comparison: A more relevant analysis would be a comparison of a stock’s P/E with its industry P/E. For example, The P/E ratio of the Indian Oil Refinery industry is 11.23 times. The P/E ratio of RIL is 30.14 times. Comparing these two numbers, we can say that RIL’s shares are looking expensive compared to its industry. Check here for the P/E ratio of industries.
- Peer Comparison: A more specific comparison will be comparing two or more stocks of the same industry. For example, within the oil refinery space, the P/E ratio of RIL is 30.14 times, IOCL is 4.23, BPCL is 4.3 times, and HPCL is 4.9 times. Comparing RIL’s P/E ratio with its peers, it looks expensive.
- Own Historic P/E comparison: Suppose the current P/E ratio of a stock is at seven (7) multiples. Just by looking at this number, one might assume undervaluation. But suppose, the historic P/E ratio of this stock shows that it generally trades at a PE multiple of five (5). It means, currently the stock is overvalued compared to its historical P/E ratio. This type of comparison gives an even deeper perspective on a stock’s P/E.
Observation #2: Watching the numerator & denominator
P/E Ratio Formula: Price-to-Earnings Ratio (P/E) = Stock’s Current Price / Earnings Per Share (EPS)
Simply put, the P/E ratio formula is price divided by the EPS (Earnings Per Share). But a closer look will tell us the following:
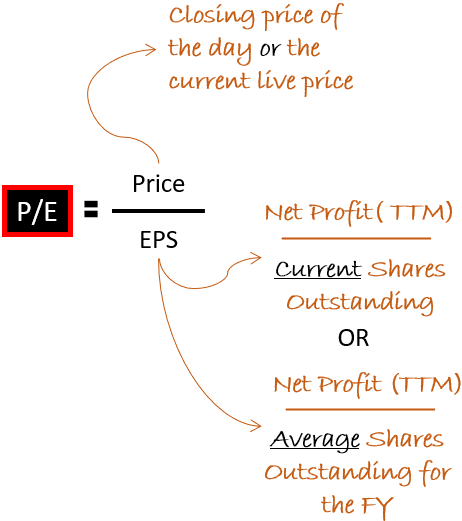
- About Price: The P/E ratio can be calculated using the current live price or the closing day’s price.
- About EPS: EPS is the diluted net profit of the trailing twelve months (PAT-TTM). What is PAT-TTM? It is the reported net profit for the last four quarters. Why it is called diluted net profit? Because net profit gets divided by the number of shares issued. The more are the number of shares issued, the more diluted will be the profit. The number of shares issued can be of two types, current shares outstanding, or the average of the start and end period of TTM.
Observation #3: PE points towards the fair price
The price of a share is a value that one must pay to own a unit of ownership in the company. But how to know if the price that is asked is fair or not?
One way of getting an answer to this question is by blending EPS with the price. This blend is what we call the price-to-earnings ratio (P/E).
Now what is seen is not just price. The price is now expressed in terms of EPS. The EPS of a stock is a rational number. It is derived from the company’s profit & loss account.
The P/E ratio helps to express price as a multiple of EPS.
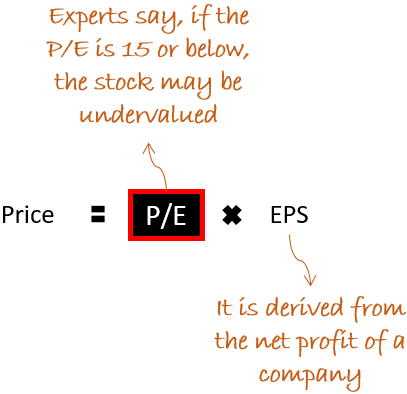
The founder of value investing, Benjamin Graham wrote that a PE multiple of 15 or below is considered ok. At these PE multiples, stocks can be said to be fairly priced.
Observation #4: There are two types of PE
Two types of EPS can be used to calculate the price-to-earnings ratio. Based on this fact, experts have named two types of P/E ratios:
- Trailing P/E: The PE ratio that we come across in the financial portals is of this type. Here, the trailing 12-month EPS (of the Last 4-Quarter) is used for calculation. The advantage of a trailing P/E is that it uses the actual reported EPS.
- Forward P/E: As the name suggests, forward P/E is calculated using future EPS projections. Generally, listed companies publish their future profit projections. Using these numbers, analysts assume a leading 12-month EPS. This EPS is then compared with the current price of the stocks. The result that we get is called forward P/E.
Point #2: Price-To-Earnings Ratio (P/E) Calculation
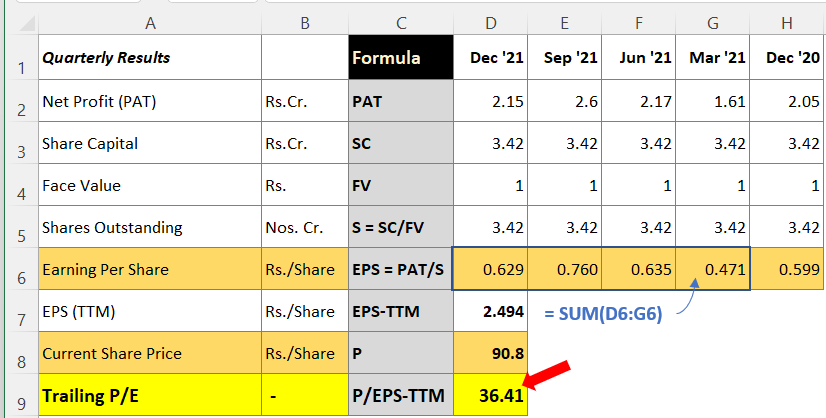
We’ll calculate the price-to-earnings ratio (P/E) of an example company. The calculation is shown with formulas in the above infographics. Although the calculation is self-explanatory, anyways I’ll explain the calculations further.
- Net Profit (PAT): We’ve recorded the net profit number of the company for the last five quarters (Dec’20 to Dec’21). For example, in the quarter ending Dec’21, the reported profit was Rs.2.15 crores.
- Shares Outstanding: The number of shares outstanding is calculated by dividing the reported share capital (SC) number by the face value (FV). As the share capital and FV remained the same through the last quarter, we can safely assume that the company has not diluted the earnings further by bonus issues or stock splits. Hence, the number of shares remained the same for all quarters, 3.42 crore numbers.
- Earning Per Share (EPS): Now, the EPS calculation is easy. The reported net profit (PAT) is divided by the shares outstanding (S). The result of it will be the EPS for all the last quarters (EPS = PAT/S).
- EPS – TTM: We must calculate the trailing twelve months’ EPS. To calculate, we can sum the EPS of the last four quarters. See the above infographics.
- P/E Ratio: Once the above calculations are done, the price-to-earnings ratio calculation is easy. Note the current price (P) of the share and divide it by EPS-TTM. This PE can be represented by a formula like this, PE = P/EPS-TTM
Calculate the forward P/E
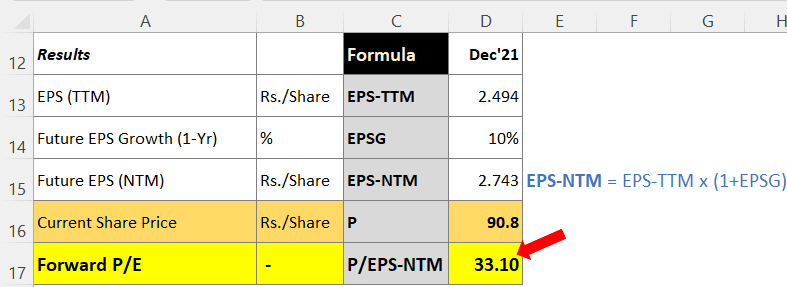
In this calculation, instead of using EPS-TTM, we’ll use the next 12 months EPS (EPS-NTM). It is the forecasted EPS for the next 12 months (NTM).
How to calculate EPS-NTM? It can be done by using this formula:
EPS-NTM = EPS-TTM * (1+EPSG)
The critical data is EPSG (EPS growth rate for the next 12 months). Industry analysts or even the company itself sometimes publish their future growth projections. We can use the growth rate numbers indicated there to assume an approximate EPSG. Otherwise, the EPSG estimate can also be assumed by studying the EPS-TTM of the last few quarters/years.
Point #3: Interpretation of P/E Ratio
There are two ways we can look at price to price-to-earnings ratio. As a stock investor, we need to be aware of both the perspectives. Why?
Because at times, both can point in opposite directions. One way of looking at the PE multiple is from the lens of valuations. Most of us know this, right? But not many of us look at the PE multiples from this second perspective.
Let’s try to learn to interpret the PE ratio from both perspectives:
#3.1: Interpretation from the valuation perspective
The higher the P/E ratio more expensive the valuation. So as per this theory, lower P/E stocks are better for investing. But as an investor, we must question why is the P/E low.
If low P/E is caused due to falling EPS, it is not acceptable. But how can P/E fall when EPS is falling? P/E should go up, right? Generally, stock prices overreact to falling earnings. For example, if EPS falls by 10%, then a share price can fall by 12%. This type of overreaction can bring down the P/E level. For that moment, retail investors can avoid such stocks.
If a low P/E is caused due to falling stock prices, it is an ideal case for investors. The earnings (EPS) of the stock remain stable but still, its price falls. In such a case the P/E of the stock will come down. Such price correction can happen, without EPS being the trigger, when the whole index is seeing a correction. This is the ideal scenario for retail investors to enter and participate in the stock market.
So we can say that a company with stable earnings, but experiencing a falling P/E trend, is more suitable for investing.
#3.2: Interpretation from the future growth perspective
The higher the P/E ratio the better the future potential. So as per this theory, higher P/E stocks are better for investing. But we must question why the P/E is high.
Generally speaking, investing in high P/E stocks is a risk. But there are a few high P/E stocks that experts love. A few such examples are Pidilite, Nestle, Relaxo, Asian Paints, Titan, etc. Their P/E is close to 100.
Another example of high P/E stocks is new startups. In the initial days, such companies make minimum or no profits. As a result, their P/E ratio looks exorbitant or stays negative. Some examples are Paytm, Zomato, Nykaa, Barbeque Nation, etc.
These are companies that investors value not by P/E ratio but by their future growth prospects. Let me give you an example of a hypothetical company (a start-up). We’ll see how experts do price valuation of such stocks. In this example, we see the use of ‘current P/E’ and ‘forward P/E’ and understand their utility.
Example – Start-ups
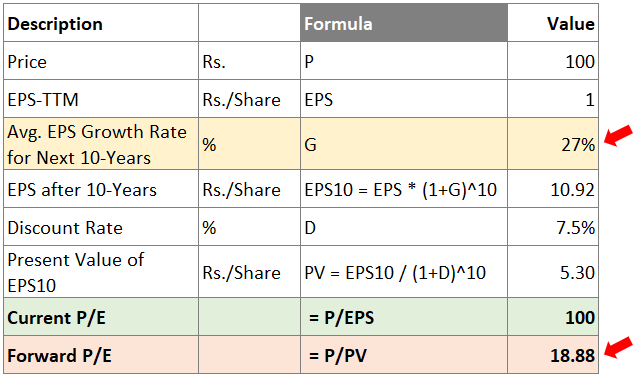
It is a newly listed stock trading at Rs.100 per share (P). Its trailing 12-month EPS-TTM is Rs.1 only. Hence, its current P/E comes out to be 100. From these PE numbers, the stock looks highly overvalued.
Now, as it is a start-up, the future growth prospects of such companies can be very high. Why? Because for them the whole market is available for expansion. For such a company, a future growth rate of EPS of 27% per annum (G), for the next 10 years is assumed. At this rate, the present EPS of Rs.1 will become Rs.10.92 (EPS10) in 10 years.
To use a more realistic future EPS value, let’s discount Rs10.92 (EPS10) by a discounting rate of 7.5% per annum. This will give us a present value of EPS10 as Rs.5.3 per share (PV).
The forward P/E of this start-up can now be calculated as shown below:
Forward P/E = Current Price / Present Value of Forward EPS
This way the forward P/E will be 18.88x.
Though the current P/E of the stock is 100x, as it is a very fast-growing company, its forward P/E comes out as 18.88x only. This is how analysts justify the currently high P/E ratios and continue investing in such stocks.
Sometimes, expert investors might also consider other parameters like quality of management, the company’s economic moat, the profitability of the business, etc, and continue buying high P/E stocks.
Conclusion
One variation of price to price-to-earnings ratio is earnings yield. What is earnings yield? It is the inverse of the P/E ratio. To calculate earning yield we must keep trailing 12-months EPS in the numerator and share price in the denominator.
That earning yield value is expressed as a percentage of the stock’s price.
If the EPS of a stock is 5 and its current price is 100, its earning yield will be 5%. Interpreting earnings yield is easier than the P/E ratio. We can compare the earnings yield with the current yield of a 10-year government bond. If the earnings yield is higher, we can say that the stock is yielding better returns than the bond. Just for our information, the current yield of a 10-year government bond is 7.2%. The inverse of earning yield is the P/E ratio. The inverse of 7.2% is 13.8x.
[Please note that we invest in stocks to earn higher returns than bonds. If a stock is unable to give higher returns than bonds, the investment in it may look meaningless.]
Another way of interpreting the P/E ratio is through the use of the PEG ratio. Out of all the analysis methods discussed above, I personally find the PEG most logical. The PEG ratio is a metric that combines the P/E ratio and EPS’ future growth potential. It is an excellent metric for price valuation.
I’ve written a separate article on the PEG ratio. I’ll suggest you kindly read it as well. It will surely add more value to your know-how.
P/E Ratio of Industries in India
[Note: The price to earnings ratio (P/E) of the Industry is estimated using the weighted average method. The weight of individual stocks within a sector/industry is considered. The weight is calculated using three parameters, market capitalization, revenue, and net profit. The final P/E of the industry shown below is the mean of the three P/Es]
(Updated on 23-June-2023)
| SL | Industry | INDUSTRY M.Cap | INDUSTRY P/E |
| 1 | Cement | 7,31,919.77 | 47.72 |
| 2 | Misc. Fin.services | 6,60,062.57 | 18.16 |
| 3 | Housing Finance | 5,92,344.68 | 2.69 |
| 4 | Telecom Services | 5,90,986.21 | 54.28 |
| 5 | Hire Purchase | 5,90,400.39 | 35.39 |
Suggested Reading:


very well explained thank you.
Thank you