We as stock investors would like to invest in a financially stable company. What is the measure of an unstable company? A company that is on the verge of going bankrupt can be called unstable. Altman Z-Score is a financial model based on which bankruptcy can be predicted. The Altman Z-Score model can point toward a probable bankrupt company in advance.
No company gets bankrupt in a short time. It starts to show signs at least two years in advance. The Altman Z-Score model can point at such troubled companies two years in advance. Imagine the shareholders of Kingfisher Airlines, DHFL, Bhushan, Essar, Alok Industries, etc knowing about the financial instability of these companies in advance. They would have exited their holdings and prevented losses worth crores.
What is Bankruptcy?
Here is an infographic showing a few possible signs of bankruptcy.
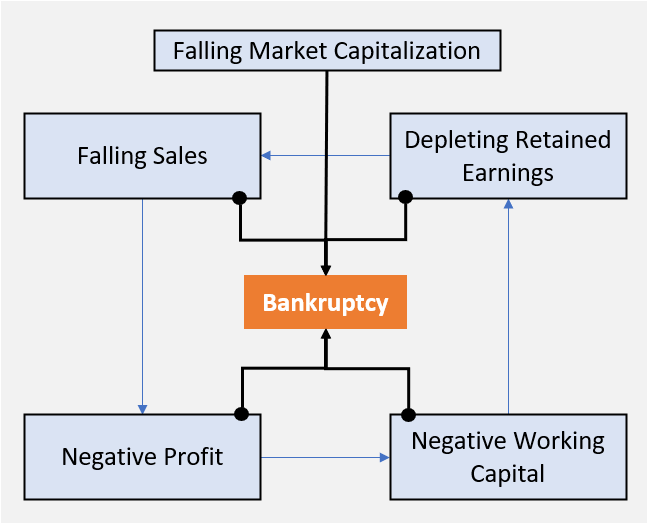
When a company files for bankruptcy, it is legally announcing to the authorities its inability to repay back the dues. The unpaid dues can be in the form of unpaid bills, vendor invoices, loan outstanding, etc. A company that has filed for bankruptcy cannot be forced to pay its dues. They can start afresh if they want. But on the downside, their assets will be liquidated by the authorities for cash. The cash so generated will be used to pay back all dues. After clearing all the necessary liabilities, if some cash is left, it is distributed among the equity holders (owners) of the company.
Altman Z-Score Model and Its Accuracy
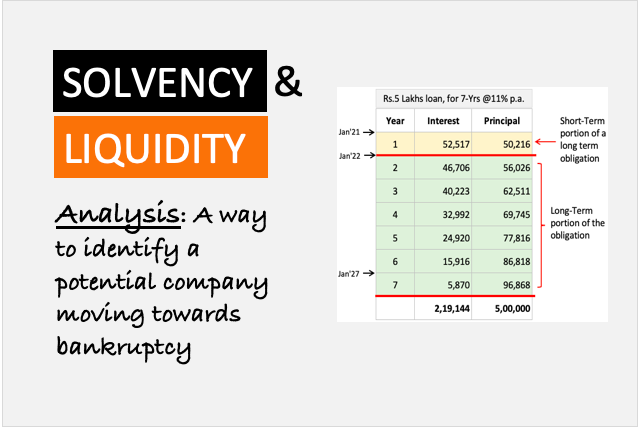
It uses a combination of financial ratios to analyze a company in terms of its solvency and liquidity position. These ratios are then combined as a part of a financial algorithm to predict if a company is going to be potentially bankrupt in the next two years. The process of the weighted average method is used to combine financial ratios to build a formula.
What is the accuracy of Altman’s algorithm? No financial model is fool-proof. There will always be some companies that will escape the cracks. It is especially true when we are trying to do the analysis to identify potential deadbeats two years in advance. But when the bankruptcy threat is looming closer, like the next 6 months, I feel the model can predict with about 90% accuracy.
All in all, we can say that the Altman Z-Score model is about 70% accurate. As a financial model, this accuracy number is more than fair.
The Formula
The Z-Score formula as developed by Mr. Edward Altman has multiple versions. The current version that is used widely on the internet is from 1983. The first version of the algorithm was published in the year 1968. It was originally meant to be used for big manufacturing companies. But the 1983 version was even suitable for small companies. Though, in today’s world of internet-based business, the viability of the model is not proven.
Whether the Z-Score model can predict bankruptcy for companies like Zomato, Paytm, Nykaa, etc? I do not know. But I’m sure that applying some financial model as a check is better than investing blindly. For most companies in the business, the Z-Score model works.
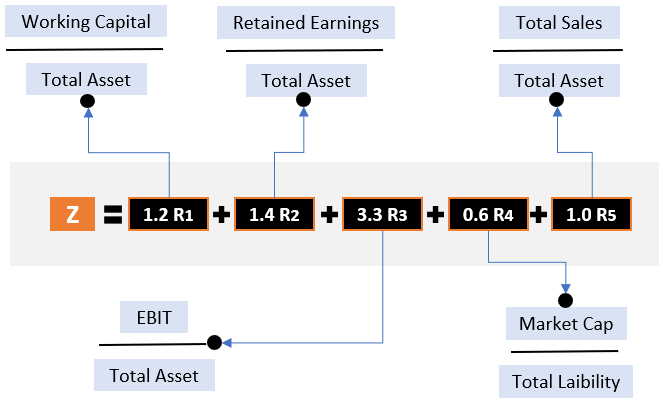
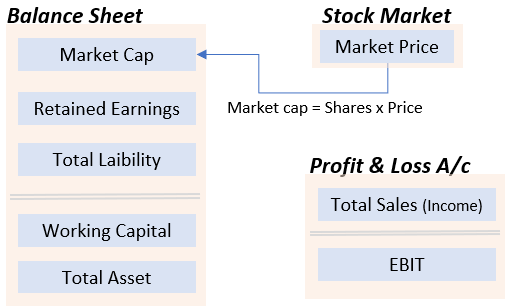
There are five ratios working in tandem to generate the Z-Score for a company. The numbers are directly picked from the balance sheet and the profit and loss accounts are considered for the evaluation. It means, that we can pick these two financial reports, and the financial health analysis can be done.
Interpretation of Ratios & The Formula
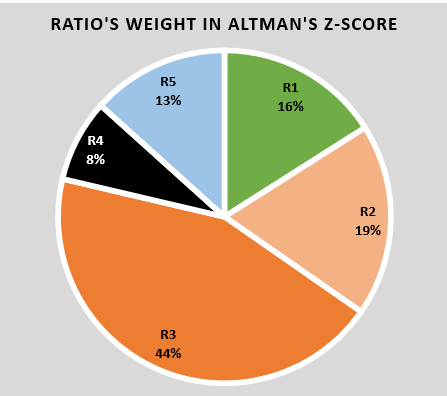
Below are the five ratios used in the Altman Z-Score model. We’ll briefly try to interpret why the ratios are used as a part of the algorithm. Here is a representation of the weight (influence) of each ratio in the overall Z-Score.
Balance Sheet
- Working Capital / Total Asset (R1): What is working capital? It is a difference between the company’s current assets and current liability. A high working capital number indicates a strong liquidity position of the company. Even a positive number indicates that the company is not only liquid enough to pay its current dues but has some extra as future provisions. The extra current assets, over and above the current liability, can be used to fund forthcoming liabilities or even the Capex. The ratio between working capital and total assets enables us to compare the working capital level of one company with the other. The factor of 1.2 indicates the ratio’s weight is 16% in the overall Z-Score.
- Retained Earnings / Total Assets (R2): What are retained earnings? It displays the quantum of profits held by the company since its inception. The ratio between retained earnings and total assets highlights how much asset is financed through the company’s profit. A high value indicates companies’ less dependency on debt to finance their asset purchases. Excess debt load makes a company a potential bankruptcy threat. The factor of 1.2 indicates the ratio’s weight is 19% in the overall Z-Score.
Profit & Loss Account & Balance Sheet
- EBIT / Total Asset (R3): EBIT is an indicator of the company’s operation’s profit-generating capability. A high EBIT number hints at a high interest-coverage ratio (ICR). The higher the ICR, the more comfortably the company can pay its loan interest dues. Till the company is paying its interests on time, it is less likely to go bankrupt. But EBIT of one company cannot be compared with the others. This is why, I think, Mr. Edward Altman has used the EBIT/Total Asset ratio. It makes the number (EBIT) comparable with other companies. The factor of 3.3 indicates the ratios have the maximum weight (44%) in the overall Z-Score.
- Total Sales / Total Asset (R5): If a reasonably profitable (EBIT) company is able to generate decent sales, its likelihood of going bankrupt is bleak. But there are different sizes of companies in the market. How to compare one sales number of two different companies? The sales to asset ratio can be compared. Sales to assets highlight the efficiency of the company’s assets to yield sales revenue. A company with a high sales to asset ratio can be assumed to be run by capable managers. Such companies may not see bankruptcy anytime sooner. The factor of 1.0 indicates the ratio’s weight is 13% in the overall Z-Score.
Market Value and Balance Sheet
- Market Cap/Total Liability (R4): Generally, this ratio for large and famous companies is very high. The companies included in the Nifty50 Index display a high ratio compared to other companies. What does it mean? It is an indicator of the investor’s (market’s) confidence in such companies. The higher is the ratio, the less likely that the company’s market value will crumble under the threat of bankruptcy. Though nobody can say this for certain, yes, high market cap companies do show more resistance to bad news thrown at them.
Altman Z-Score Interpretation
There are three types of companies that will emerge after applying the Altman’s Z-Score formula.
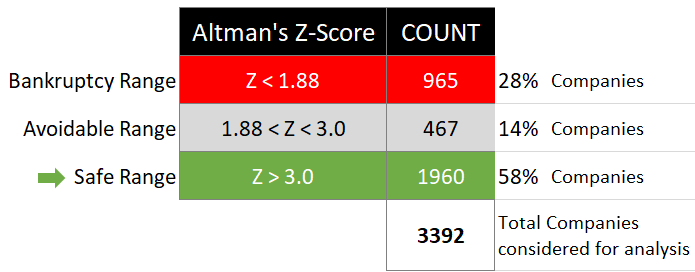
- #1. Z-Score Above 3.0: Companies that earn a Z-Score of above 3.0 can be considered safe from the threat of bankruptcy. In our analysis, we’ve taken some 3,392 number companies for analysis. Out of all these companies, about 1,960 number (58%) had Z-score above 3.0.
- #2. Z-Score Between 1.88 and 3: Companies that earn a Z-Score below 3.0 but above 1.88 are avoidable companies. Why? Because they are on the borderline of bankruptcy fears. Though they may not have immediate dangers, with the present trend going forward, they may fall below the 1.88 range. Out of 3,392 companies considered for analysis, about 467 number (14%) had Z-score in this range.
- #3. Z-Score below 1.88: According to the Z-Score formula, companies whose Z-Score is below 1.88 may file for bankruptcy in the next two years. Hence, for its investors, this is probably the time to exit its holdings. Out of 3,392 companies considered for analysis, about 467 number (14%) had Z-score in this range.
It was also seen that, out of 3,392 companies, about 258 number were from the large and mid-cap space. The market capitalization, of these 258 companies, was Rs.10,000 Crores or higher. A lot of investment goes into these 258 number companies. Within these 258 number companies, about 23 number (8.9%) earned a Z-Score of below 1.88.
What does it mean? It means that, if we are not aware, there are chances that we may end up investing in one of these potential bankruptcy companies.
Z-Score Trend Analysis
A standalone Z-Score is useful. But it is more useful to do the trend analysis. We have taken two example companies and calculated their Z-scores for the last 10 years. Both these companies are among the largest companies in our Indian stock market. The trend analysis will show us that if the company’s Z-Score is rising or falling. As an investor, we want to see a rising trend.
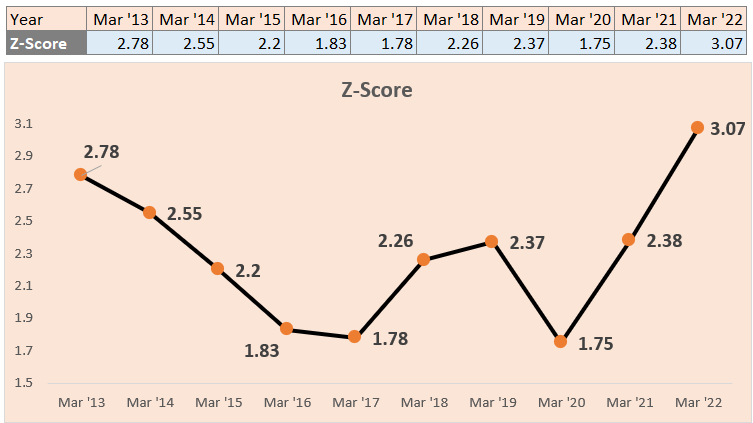
What you see above is the Z-Score of a very large cap Indian company. A chart is plotted for its Z-Score to see the last 10-Year trend. As an investor, we would like to see a rising trend. But in our example, what is visible is an initial trend where the Z-Score is falling to dangerous levels, then coming back to normal. Between the years 2013 and 2018, the company’s scores kept falling till the avoidable range was reached. But it bounced back, an indicator of a strong management’s working.
Let’s look at another example of an equally large company. But it is from a different industry.
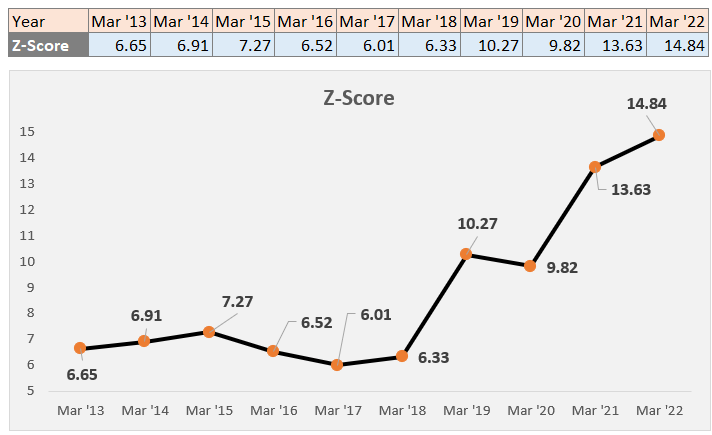
In this example, you can see that the Z-Score growth trajectory is more uppish. Moreover, the Z-Score itself is high compared to our previous example. In the last 10 years, the Z-Score has risen from levels six (6) to fourteen (14) levels. It is a clear indicator of improving financial stability.
Suggested Reading:
Hi Mani,
I am huge fan of your blogs. But I really want to know whether have you really achieved good profits using the techniques you mentioned.
Thank you Sumanth.
I’ve been investing since 2007-08. Since, then I’ve building my stock portfolio. I’ve virtually no investments in mutual funds till date. I hope I’ve answered your question (may be indirectly).
With these years of experience, I can say that stock market is a place to be for long-term investors.
High quality content, as usual.
Keep doing that!