We already have multiple financial ratios emanating from the balance sheet and profit and loss accounts. Why do we need to add cash flow ratios to the list?
Profit and profitability are a measure of the company’s ability to yield cash. Cash is king. No matter how big the quantum of profit and profitability is, if they cannot be converted into cash, it’s of little use. Hence, as an investor one must know how to judge the cash sufficiency of a company.
How to do it? It can be done using a few ratios. We will discuss these ratios in this article.
Cash is Crucial, Why?
Let’s understand it using a simple example. Suppose there is a company that makes toothpaste. To produce one tube of toothpaste, its total employed cost is Rs.40. The company sells this product at Rs.100 per tube. The return on employed capital, in this case, is 60%. The numbers look fantastic, right?
Let’s assume that the customers buy the toothpaste on a 30 days credit. So for the first 30 days, the company’s cash flow is negative (-Rs.40). Now, suppose after 30 days, for some reason the payment of Rs.100 is not received. The toothpaste company which was already reeling under negative cash flow might face extended hardship.
The point is, net profit and profitability numbers show only half the picture. Till these numbers get converted into cash, cash actually pouring into the company’s bank account, net profit and profitability numbers are only like assumptions.
If the cash is not flowing into the company, its survival is at a stake. That is why cash is king for any enterprise.
How to check the cash sufficiency of companies? By doing liquidity and solvency analysis. In this article, we will do it using a few financial ratios.
Profit Comes First or Cash?
The majority assume that profit precedes cash. If there are no profits, there will be no cash to earn. But I think the inverse is more applicable. The cycle of earnings starts with cash and not with profits.
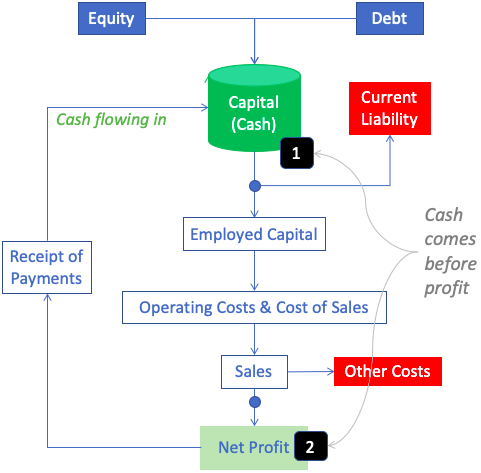
Cash availability is not only necessary to set up a business but also to operate it. As explained in the above infographics, you can see how cash precedes sales and net profit. Moreover, for this cycle to continue, the conversion of net profit into cash is necessary. This form of representation highlights the importance of cash over net profit.
It will not be an overstatement to say that till a company is able to manage its cash flows (inflow and outflow), it will survive. It does not matter what the quantum of profit and its margins are. Cash is like blood flowing into the veins of a company. Till it is flowing, the existence will not be at stake.
Cash Flow Ratios
Now, we will look at multiple cash flow ratios to judge the cash-generating power of a company. You will notice that these ratios are similar to ratios like ROA, Current Ratio, Interest Coverage Ratio, PE ratio but with a difference.
All these ratios have been tuned to scrutinize the cash position of a company. So let’s start with the most visible and important ratio.
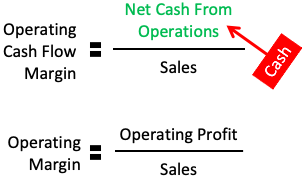
#1. Operating Cash Flow Margin
It measures the quantum of net cash generated from operating activities, as a percentage of sales, for a financial year.
This cash flow ratio is similar to the operating margin. The operating cash flow margin has net cash from operations in the numerator. The operating margin has operating profit in the numerator. What is the difference? The operating cash flow margin is measured based on real cash generated by the company. While all of the operating profit may not be cash.
For companies that sell their products and services on credit, the difference between the operating margin and operating cash flow margin can be large. But for other companies, the difference might not be as large.
But one change is noticeable for all companies. Operating cash flow is inclusive of non-cash expenses like depreciation. Operating profit is net of depreciation.
An increasing operating cash flow margin is a strong indicator of improving free cash flow (FCF). How? Because the increasing margin means effective use of working capital, faster payments from customers, delayed cash-outs, lower inventory, etc.
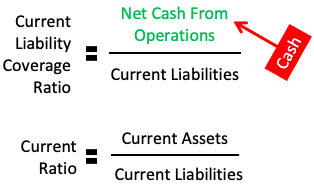
#2. Current Liability Coverage Ratio
There is a hypothesis we must remember. If a non-profit making company can somehow manage to pay off its current liabilities till eternity, it will survive forever. This is the power of liquidity – current liability management.
The current liability coverage ratio highlights the capability of the company to manage its current liabilities.
This cash flow ratio is similar to the current ratio. In current ratio, current assets are kept in the numerator. But not all current assets are cash. Hence, a better measure of the company’s liquidity is the current liability coverage ratio.
The current liabilities coverage ratio is small for capital-intensive companies like steel, cement, auto, telecom, etc. While for other companies it can be bigger. Hence it is always advisable to compare the ratio of companies in the same sector.
Generally speaking, companies with a lower current liabilities coverage ratio can be picked for investing only when it is offering a larger margin of safety. If such a safety net is not visible, better to opt for other stocks.
Moreover, for companies whose current liability coverage ratio is below one, for me, it is completely avoidable.
#3. Cash Interest Coverage Ratio
Now we know that for a company, payment of current liabilities is crucial. Let’s dig further into a constituent of current liability.
Among the current liabilities of a company, accrued interest is one component. It is an important parameter that companies cannot miss to manage. Because continued non-payment of interest on loans may eventually lead to bankruptcy risks.
The cash interest coverage ratio is a measure of how much cash the company has generated to cover its interest expense. It is the ratio between net cash from operating activities and interest.
This cash flow ratio is similar to the interest coverage ratio. The difference between the two ratios is visible in the numerator. The interest coverage ratio (ICR) keeps PBIT, a non-cash metric, in its numerator while Cash ICR has operating cash in the numerator.

If the cash flow from operations covers both interest and current liability, it is a clear sign of strong liquidity. The higher is the Cash ICR the better.
#4. Cash Asset Efficiency Ratio
It is the ratio that measures the potential of a company’s asset to yield net cash from operations. It is one of the better ratios to compare companies operating in the same industry.
This cash flow ratio is similar to Return on Asset (ROA), but again the difference is in the numerator. ROA carries net profit (PAT) in its numerator while our cash ratio uses net cash from operations.

I feel the best way to use the Cash Asset Efficiency Ratio is to plot a historic curve, of the last 10-years. A stable or increasing curve is what we would like to see as an investor.
To make the asset efficiency ratio more specific, we can use “Property, Plant, and Equipment” (PP&E) in the denominator (instead of total asset). It will further highlight the potential of capital-intensive assets to yield cash.
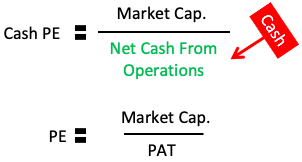
#5. Price to Cash Flow Ratio (Cash PE)
This ratio is a price valuation ratio. I like to see this ratio besides the PE ratio.
In this valuation ratio, net cash from operations is in the denominator, and market capitalization is in the numerator. To calculate the PE ratio, we keep market capitalization in the numerator but net profit (PAT) in the denominator.
The difference between PE and cash PE gives fair insights about a company.
Suppose a company has a Low PE (say below 15) and high Cash PE (above 35). It indicates that the company is not collecting the due payments fast enough. In this case, the company has collected less than 50% of what has been billed after-sales. It is a cause of worry.
Furthermore, we would also like to compare current year cash PE versus historical cash PE averages (3-Yr, 5-Yr, and 10-Yr). A consistent or reducing cash PE number is what should be expected.
Conclusion
Investors are often fixated on sales, net profit, EPS, and profitability numbers. This is not wrong, but it is more important to check the company’s cash position.
The cash flow ratios indicated in this article are good metrics to build an impression about the company’s cash position. Why we must look at cash? Because without sufficient cash, the company may eventually die.
We often stop after analyzing the balance sheet and profit and loss accounts. But I feel, it is better to start with the cash flow report. Checking the above five ratios is what I like. It is both quick and yields deeper insights.
Analyzing the cash sufficiency of a company is necessary and must be a part of a detailed fundamental analysis.
Thanks for reading and have a happy investing.

![India's Food and Beverage (F&B) Sector Analysis [2025] - Thumbnail](https://ourwealthinsights.com/wp-content/uploads/2025/01/Indias-Food-and-Beverage-FB-Sector-Analysis-2025-Thumbnail-768x461.jpg)
Great article. Please blog about reason why RBL bank failed.