There is an interesting report of World Bank on consumer spending habits of developing nations. It also gives detailed numbers on where do people spend money in India.
A report like this gives a nice visualisation of how Indians (and other population across the globe) spend their money. Though the report is dated 2010 but it is understandable, as such massive research cannot be repeated too often.
The report highlights how people of different income class spends their money. Reading the report will establish how spending priority of people change as they go up the income pyramid.
There are 12 Consumption Sectors identified by the World Bank. The report highlights how developing economies spend their money within these 12 spending sectors.
Consumer Spending – BRICS
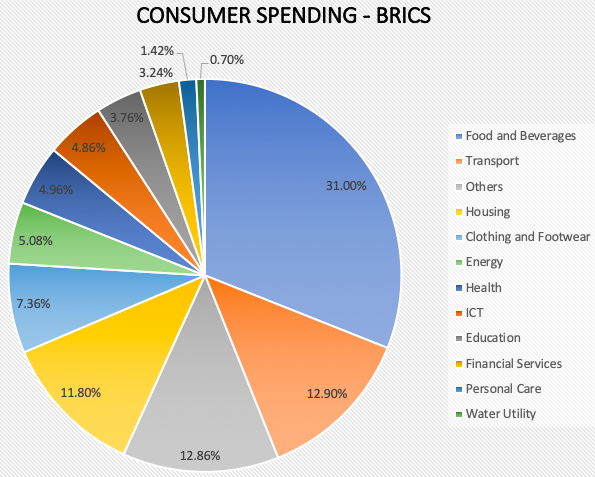
The above chart/table shows the twelve spending sectors identified by the World Bank. For an example, I’ve shown the cumulative consumer spending pattern of BRICS nations (Brazil, Russia, India, China & South Africa).
Let’s elaborate on 12 Consumption Sectors
Food (31%)
- #1. Food & Beverages: 31% of total spendings of BRICS nations goes into managing food and beverages. Items included in this category are rice, cereal, flour, bread, bakery, meat, poultry, milk & its products, edible oils, fruits, vegetables, groceries, water, soft drinks, juices, spirits, wine, beer, take home orders etc (detailed list).
Clothing (7.36%)
- #2. Clothing & Footwear: 7.36% of total spendings of BRICS nations goes into purchases of clothing & footwear’s. Items included in this category are garments, footwear’s and their repair work etc (detailed list).
Shelter (30.44%)
- #3. Housing: 11.8% of total spendings of BRICS nations goes into managing housing expenses. Items included in this category are actual rent paid, imputed rent, house maintenance, purchases like fridge, washing machine, wardrobes, dishwasher, vacuum cleaner, water heater, air conditioning, household tools etc.
- #4. Energy: 5.08% of total spendings of BRICS nations goes into managing energy needs. Items included in this category are electricity bills, cooking gas bills, other domestic fuels like coal, coke, kerosene etc.
- #5. Other: 12.86% of total spendings of BRICS nations goes into managing other expenses. Items included in this category are purchase of home furnishing, household repairs, electric appliances, utensils, tools, non-durable goods (like soaps, washing powder etc), domestic help, laundry, toys, games, pets, holidays, books, hotels, personal care, other miscellaneous expenses etc.
- #6 Water Utility: 0.70% of total spendings of BRICS nations goes into managing other expenses. Items included in this category are water bills, down-payments, purchasing of associated equipments like water meters etc.
Related Expenses (31.14%)
- #7. Transport: 12.9% of total spendings of BRICS nations goes into managing transportation expenses. Items included in this category are purchase of car, bikes, bicycles, maintenance, fuel, cost of parking, cost of public transportation etc.
- #8 Health: 4.96% of total spendings of BRICS nations goes into managing health needs. Items included in this category are doctor’s consultation, laboratory tests, medicines, medical equipments, paramedic services, hospitalisation expenses among others.
- #9 ICT (Information & Communication Tech): 4.86% of total spendings of BRICS nations goes into ICT. Items included in this category are purchase of telephones/mobiles/television/computers, payment of their recurring bills, repair of these equipments, purchase etc.
- #10 Education: 3.76% of total spendings of BRICS nations goes into educational needs. Items included in this category are books, tuition fees, stationaries, catering, transportation, hostel fees etc.
- #11 Financial Services: 3.24% of total spendings of BRICS nations goes into purchasing financial services. Items included in this category are insurance products, investment fees (like brokerage, fees etc), loan loan EMI’s, bank charges etc.
- #12 Personal Care: 1.42% of total spendings of BRICS nations goes into personal care. Items included in this category are items of hair care, dental hygiene, make-up, bathing products, towels, napkins, cotton etc.
Consumer Spending in India vs other developing countries (125 Nos)
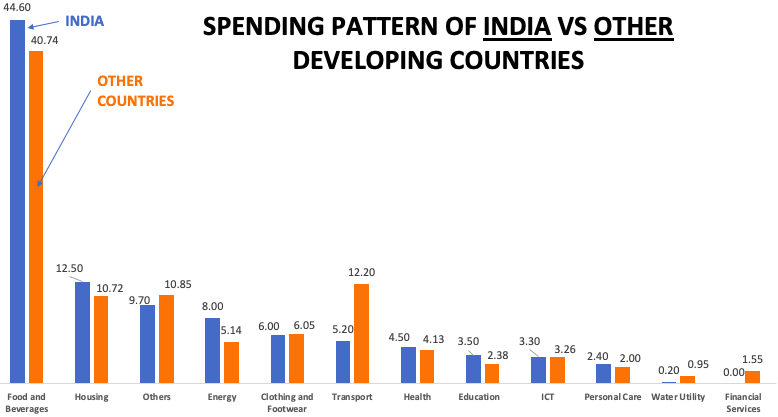
Noticeable Points in the above infographics:
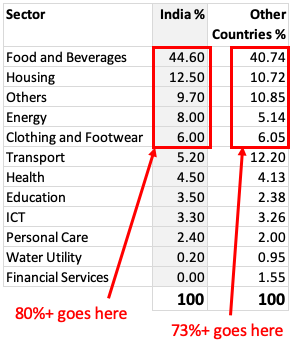
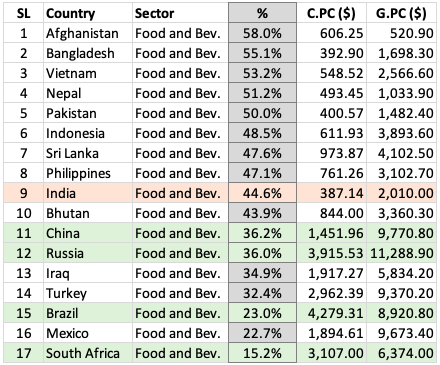
- Food & Beverages: Compared to the world’s average of 40.74% and BRICS average of 31%, Indian spends more (44.6%) on food and beverages. Below is a list of few developing countries and their spending pattern on Food and Beverages. [My Conclusion: By seeing the table we can generalise that countries with higher per capita consumption and per capita GDP tend to spend less on food & beverages].
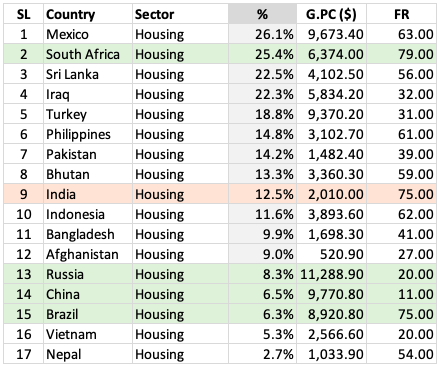
- Housing: Compared to the world’s average of 10.72% and BRICS average of 11.8%, Indian spends more (12.5%) on housing. Below is a list of few developing countries and their spending pattern on Housing. [My Conclusion: By seeing the table we can generalise that a combination of higher per capita GDP and freedom rating makes people spend more on housing].
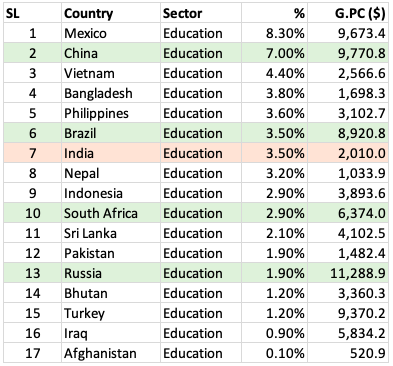
- Education: Compared to the world’s average of 2.38% and BRICS average of 3.76%, Indian spends about 3.5% on education. Below is a list of few developing countries and their spending pattern on education. Out of BRICS nations, only China (7%) spends more than India on education. But the country which attracts attention in the list is Mexico with 8.3% spending on education.
Consumer Spending in India – Rural Vs. Urban
This comparison will highlight how differently urban India spends as compared to Rural India. There is big difference between their spending habits. Why? Probably because of the wealth accumulation. Rural India is still poorer compared to Urban India.
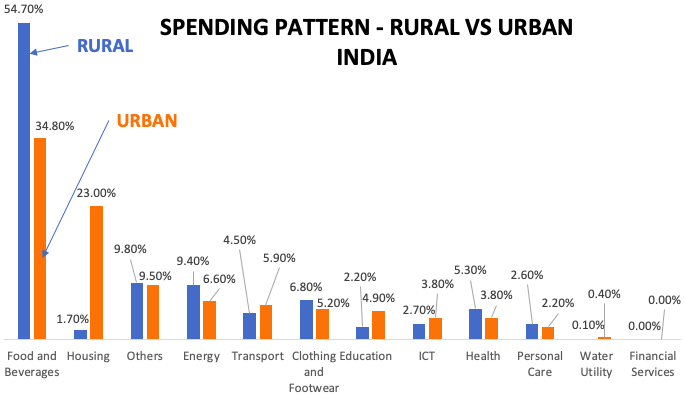
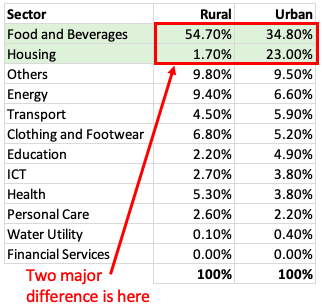
- Rural India: Per Capital Consumption of Rural India is Rs.12,662.89 per year. On an average, a household in India has 4.922 people (see note below) people. Means, a rural Indian family spends about Rs.62,326.74 per year (=12662.89×4.922). Out of Rs.62,326 food and beverages consume 54.7%. Rural India also spends more (compared to Urban) on clothing & footwear, health, personal care.
- Urban India: Per Capital Consumption of Urban India is Rs.28,956.05 per year. Considering 4.922 people per household (see note below), an urban Indian family spends about Rs.1,42,521.67 per year (=28956.89×4.922). Out of Rs.1,42,521 food and beverages consume 34.8%, and housing consumes 23%. Urban India also spends more on transport, education and communication.
[Note: The census data said that the total number of households in the country are 24.88 Crore. Total population of India is assumed at 122.46 Crore. Hence, number of people per household (family) is 4.922 (=122.46/24.88)]
Income Distribution of Indian Consumers
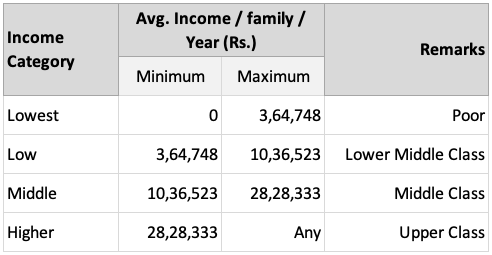
As per World Bank, there are four “Consumption Segments” in developing nations. These segments has been formed to study spending habits of people based on their earned income. Such a study highlights the changes in spending pattern of people as go up the income ladder.
World Bank has created these segments based on global income distribution data.
| Income Category | Income/Capita/Day | Low (Rs.) | High (Rs.) |
| Lowest | Below $2.97 | Below | 74,105.66* |
| Low | Betwn: $2.97 and $8.44 | 74,105.66 | 2,10,589.82 |
| Middle | Betwn: $8.44 and $23.03 | 2,10,589.82 | 5,74,630.74 |
| High | Above $23.03 | 5,74,630.74 | Above |
[* Calculation Example: Rs.74,105.66 = $2.97 * Rs.68.36/USD * 365 Days]
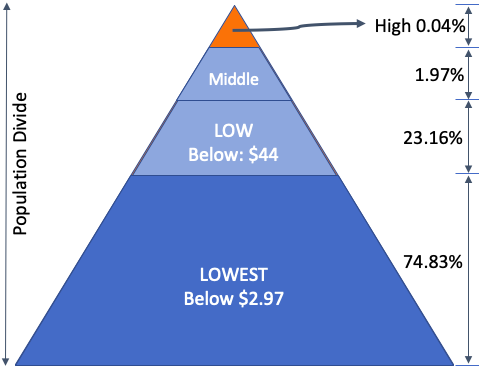
- Lowest: These are people who are at the bottom of income pyramid. The world bank has segmented them as such people whose income is below $2.97 per capita per day ($2.97 * Rs.68.36/USD * 365 days = Rs.74,105 per capita per year).
- Low: These are people who are second from bottom of income pyramid. The world bank has segmented them as such people whose income is between $2.97 and $8.44 per capita per day (Between Rs.74,105 & 2,10,590 per capita per year).
- Middle: These are people who are second from top of income pyramid. The world bank has segmented them as such people whose income is between $8.44 and $23.03 per capita per day (Between Rs.210,589 & 5,74,630 per capita per year).
- Higher: These are people who are at the top income pyramid. The world bank has segmented them as such people whose income is above $23.03 per capita per day (above 5,74,630 per capita per year).
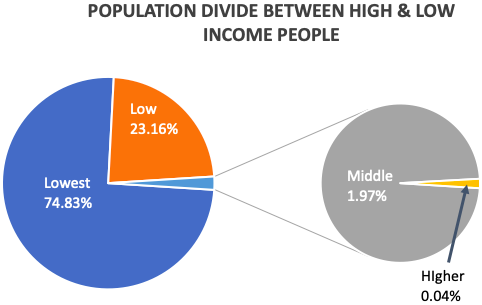
[Special Note: There are 4.922 members per household. Hence distribution of annual income per family in India will be as shown below. Check the population divide between rich & poor]
Read: What is the process to become rich
Consumer Spending Pattern of Rich and Poor
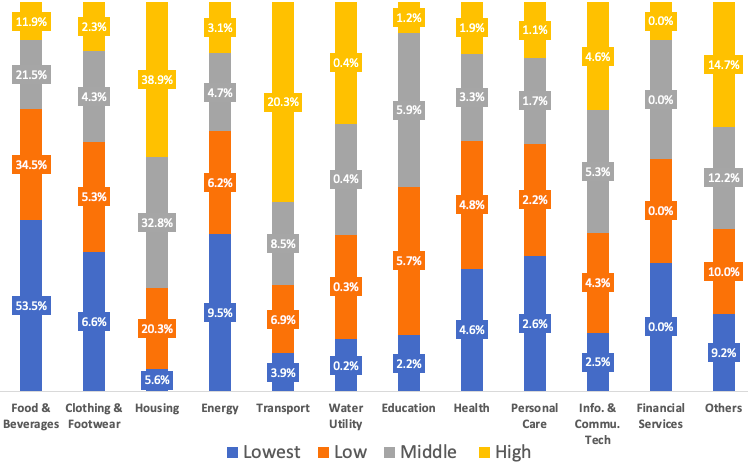
We have seen how the World Bank has created a “Consumption-Sectors” based on income levels of people in developing nations. Such a segmentation provides a great insight into the difference between how rich and poor spend their money in India.
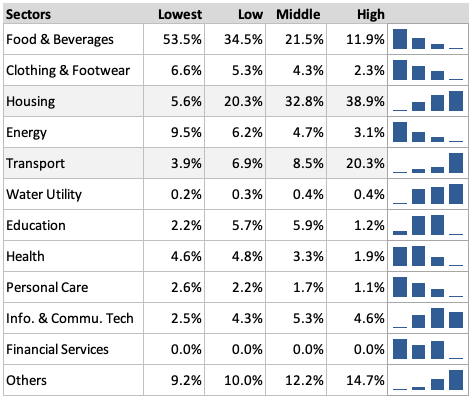
Poor
- Food & Beverages: This is a sector where the spending pattern is most evident. As people go up the income chain, percentage spending on this sector reduces. Lowest income people spend most here (53.5%) and rich people spend only 11.9% here. Why? Because price of food items are closely watched by Government. People of all income category has to pay almost the same price for food items, hence this disparity.
- Clothing & Footwear: This is again a sector where money of less affluent people go. 6.6% of the total spending of lowest income earners go here. Whereas about 2.3% of the total spending of high income earners goes here.
- Energy: For low income earning people, 9.3% of their total expense goes in paying electricity bill, cooking gas/fuel bills etc. Highest earning people diver only 3.1% of their spending on energy.
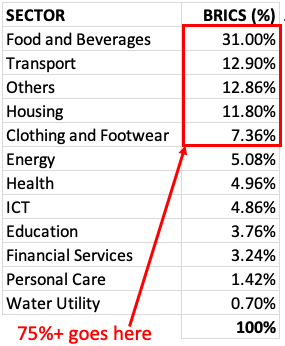
Together, food + clothing + housing + energy accounts for 75% of total expense of poor Indian people. This is also understandable, right? These items are “bare minimum necessities’ to live a human life.
Rich
Two sectors that mark a clear difference between spending pattern of rich and poor is housing and transport sector. On one hand, cumulative spending of poor people is just 9.4% in these two sectors. Whereas rich people divert about 59.2% of their spending in these two sectors alone.
These two sectors are symbolic of ones “standard of living”. As rich people have more disposable income, hence they spend on plush homes and expensive vehicles. Read: Source of income of rich people.
Spending Pattern In Difference Indian States & UT’s
Top 10 Indian states (UT’s) in terms of Consumer Spending Per Capita (CPC) is listed below. You can get a list for all states here.
| States & UT’s | CPC (Rs.) |
| Chandigarh | 49,607 |
| Delhi | 42,148 |
| Pondicherry | 30,137 |
| Andaman and N | 28,906 |
| Goa | 26,541 |
| Daman and Diu | 24,613 |
| Lakshadweep | 24,169 |
| Kerala | 23,827 |
| Punjab | 23,811 |
| Maharastra | 23,402 |
Among the 12 spending sectors, which states which spends the most in each sector? Out of all of our States and UT’s, Assam spends most of on food & beverages (59.7%). Delhi NCR spend most on Housing related expenses (31.8%). Arunachal Pradesh spends most on Energy (11.2%) and also on other expenses (13.2%). See a detailed list for states & UT’s here.
| States | CPC (Rs.) | F&B | C&F | Hsg | Eng | Tran | Wat | Edu | Hea | ICT | Oth |
| Assam | 13,247 | 59.7% | – | – | – | – | – | – | – | – | – |
| Sikkim | 18,729 | – | 10.2% | – | – | – | – | – | – | – | – |
| Delhi | 42,148 | – | – | 31.8% | – | – | – | – | – | – | – |
| Arunachal Pradesh | 16,675 | – | – | – | 11.2% | – | – | – | – | – | 13.2% |
| Goa | 26,541 | – | – | – | – | 9.2% | 0.90% | – | – | – | – |
| Chandigarh | 49,607 | – | – | – | – | – | – | 5.90% | – | – | – |
| Kerala | 23,827 | – | – | – | – | – | – | – | 8.1% | – | – |
| Lakshadweep | 24,169 | – | – | – | – | – | – | – | – | 5.9% | – |
CONCLUSION
Households in India spends maximum on Foods. 44.6% of all spendings by Indians are on food items. No doubt why there are so many small and big food joints in India.
The next item on which household India spends maximum is on housing. This expense can be both rent payments, EMI payments etc. 12.5% of all spendings by Indians are on housing sector.
What does it mean? Most of the people in India are busy earning money to pay their home loan EMI’s or enjoying a nice meal.
How we can use this data for our benefit? In terms of personal finance, people can glance at the results, and estimate where their maximum money is getting spent. These are those expense categories which needs to budgeted and tracked.
Final Words…
As per 2010 data, total consumption in India has been Rs.21,679 Billion. Out of these, who contributes the maximum? I must confess that I was surprised to see the result.
I always assumed that high spending segment must be the lot of so called “rich people”. But according to World Bank data, the opposite was true. Lowest earning people (income below $2.97/capita/day) contributes 60% of the total spendings in India.
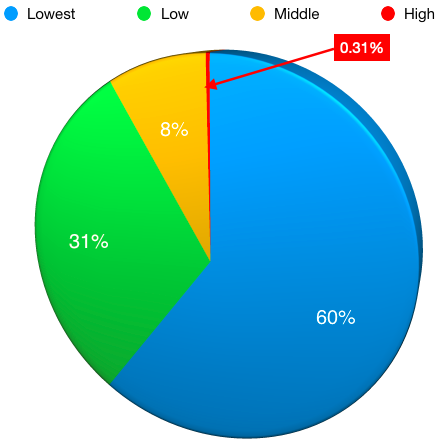
| All | Lowest | Low | Middle | High |
| 100% | 60.31% | 31.24% | 8.14% | 0.31% |
| 21,678.57* | 13,074.25 | 6,773.15 | 1,764.78 | 66.40 |
* Value shown is in Billion Rupees.
Whereas the highest earning people (income above $23.03/capita/day) contributes only 0.31% to the total spendings in India. Why it is so? Because of two reasons: (a) firstly, rich people are very low in numbers (see population divide) compared to poor’s in India. (b) Secondly: Rich’s generally save and invest most of their income.
Population Divide in India


![How Changes in Oil Supply Affect the World and our Investments [Explained] - Thumbnail](https://ourwealthinsights.com/wp-content/uploads/2025/03/How-Changes-in-Oil-Supply-Affect-the-World-and-our-Investments-Explained-Thumbnail-768x463.png)


Hi Mani,
Thanks for this in-depth breakdown of the spending. I just was not able to find one piece of information that I was looking for, how much on an avg does an Indian spend on sports products per year – like sports they play to keep fit? Can you help me with this information if you have it?
Awesome blog post. So, well written and explained:).
very informative and brilliantly expressed
Tremendous! Here a fan at Argentina! Where did you take your data from?
Hey can you please help with what is the time period of the data and how many people were surveyed?
Mani, thank you so much for the loads of information and tips. It is so inspiring and useful.
Thanks
what an awesome article. deep and useful. love your work.
i must thanked you for your value added information.
Fabulous and useful information to everyone. Best of luck for your endeavor.
Thanks