I was doing a detailed analysis of profit margin of few Indian companies. Two names that came to my attention were HEG and Graphite India
Why my stock screener flagged these companies to me? Because between a period of Mar’2014 and Nov’2018, in a span of 4.5 years, these stocks were giving a return of +65% p.a.
What means by 65% p.a. in 4.5 years? The invested amount appreciates by a multiple of twelve (12). Suppose there was an investor who invested Rs.8.5 Lakhs in these stocks. He became a crorepati in just 4.5 years.
There were other stocks that have given similar stellar returns in the past. What made these stocks perform like this? One thing which was common in these stocks was their high operating profit margins (+40%).
Companies with such high operating margins are unique. If one gets a chance to grab such stocks at undervalued price levels, such return can become reality.
But looking in the past, and claiming that these are good stocks is rather easy. Important will be to learn how to identify such potential stocks when they are trading at undervalued price levels.
Overvaluation…
Companies which has such high operating margins (+40%) are rare. Hence stocks of such companies often trade at overvalued price levels. P/E and P/B multiples of such stocks are generally very high.
So how value investors can target such stocks? It is not easy, but I will discuss here what value investors shall start with. The study of such potential stocks must start with the analysis of profit margin (profitability).
What is profitability?
As a beginners it is not enough to understand the formula of profit margin. It is also important to visualise it. How to do it?
Let’s assume that a company is like a money bank. There is a safe, and in that safe money keeps coming-in (sales) and going-out (expenses).
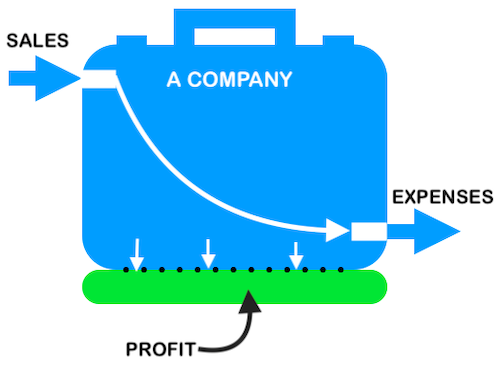
What will make that company profitable is its ability to retain a portion of sales from getting expended.
The amount of money that a company can hold for itself is called its profits. When a company can retain more profits, we say its profitability is high and vice versa.
A company which is not able to retain its sales income, means everything coming in is getting spent. Such companies has zero profitability. Value investors stays away from such companies.
What is the use of profitability for investors? By analysis of profit margin of a company, an investor can compare two companies and also prejudge its capability and future performance.
Analysis of profit margin of companies
There are three types of profit margins which our industry deals with:
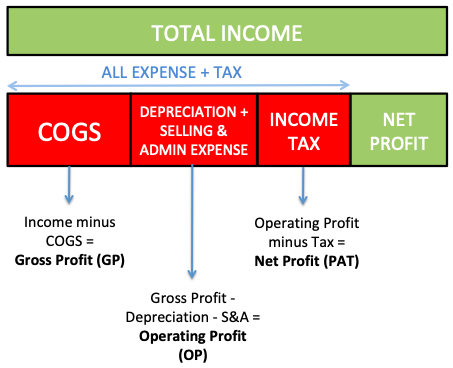
- Gross Margin (GM): It is a ratio between gross profit and total income. What is gross profit? Total income minus Cost of goods Sold (COGS). What is COGS? All direct costs incurred by the company to generate its product or services [ = (Income-COGS)/Income].
- Operating Margin (OPM): It is a ratio between operating profit and total income. What is operating profit? Gross profit minus depreciation and other operating expense (like sales, administration etc) [ = (Gross profit – Depreciation – S&A) / Income].
- Net Profit (PAT): Final profit retained by the company after paying all expenses [ = (Operating Profit – Income tax)/Income].
Understanding of Operating Profitability of Companies with Examples
According to me, what matters most in analysis of profit margin of companies is operating margin.
Suppose there are two companies A & B with the same total income. There can be a case where company “A” has higher operating margin than company “B”, but due to difference in taxability, B has a higher PAT than A.
But if we have to understand that which ‘business’ is more profitable, then it is A. Why? Because its operating margin is higher.
What is the significance of operating margin? To understand this, let’s take a real life example.
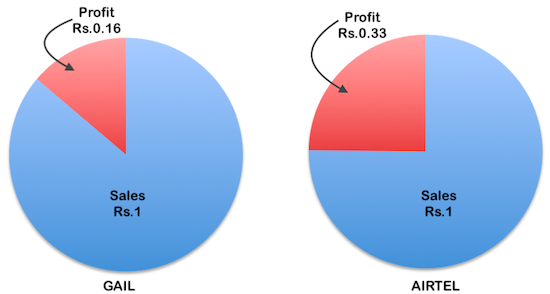
| DESCRIPTION | – | GAIL | AIRTEL |
| TOTAL INCOME | A | 54,710.39 | 53,300.20 |
| OPERATING PROFIT | B | 8,648.62 | 17,442.10 |
| INCOME MULTIPLE | A/B | 6.33 | 3.06 |
| OPERATING MARGIN | B/A | 0.16 | 0.33 |
We are considering here two companies: GAIL and AIRTEL. Both these companies has almost similar “total income”. But when we look into the operating profits of GAIL and AIRTEL, we can see that AIRETL is making more profit than GAIL.
So if we want to understand the business prospects of GAIL and AIRTEL, how we can interpret the numbers? In Two ways:
- INCOME MULTIPLE: GAIL has an income multiple of 6.33 and AIRTEL has 3.06. What does it mean? It means, for GAIL to increase its profit by Rs.1, it has to increase its income (sales) by Rs.6.33. Similarly, for AIRTEL to increase its profit by Rs.1, it will have to increase its income (sales) by Rs.3.06. Which company has to work more? GAIL. Hence AIRTEL is more profitable.
- OPERATING MARGIN: GAIL has an operating margin of 0.16 and AIRTEL has 0.33. What does it mean? It means, for GAIL – for every Rs.1 increase in sales, its profit will increase by Rs.0.16. For AIRTEL – for every Rs.1 increase in sales, its profit will increase by Rs.0.33. Which is more profitable? AIRTEL.
For companies to grow in future, it must increase its profits. How profits will grow? By increasing sales (turnover). For companies like AIRTEL, lesser amount of “sales growth” will bring in “more profits (say X)”. For companies like GAIL, to generate same additional profit (X), they will have to increase more sales.
So what is the problem with sales growth? To grow sales, it requires capital. Companies like AIRTEL will require less capital to grow its sales.
Build your own story about the company…
What we have done till now is to only play with the numbers. But for pro-investors, it is much better to see a story hidden behind the numbers. Why story is interesting? Because it will say with certainty, how the company will perform in times to come.
How to make out the story? Follow the two steps:
Step #1: Try to see a trend
Ask this question, how the margins have performed in last 5 years? Seeing margins for only one year is not enough. It is more interesting and meaningful to see if the margins are increasing or diminishing in last years.
| Operating Margin | Mar’14 | Mar’15 | Mar’16 | Mar’17 | Mar’18 |
| AIRTEL | 34.4% | 44.4% | 37.3% | 38.3% | 33.6% |
| GAIL | 9.79% | 9.87% | 15.75% | 16.06% | 16.06% |
Looking at the above numbers, it is clear that though AIRTEL is currently more profitable, but it is GAIL which was able to improve its operating profitability in last years.
Value investors love improving profitability of companies. In many ways is it given more weightage than improvement in absolute value of PAT.
Step #2: Look for big companies with smaller variable costs
All expenses of companies can be categorised into the following two heads:
- Fixed Costs
- Variable Cost.
#A. Which are the fixed costs?
These are those costs which will continue to incur irrespective of whether the company is producing goods or services or not. Few examples of fixed costs of companies are as listed below:
- Depreciation & Amortisation.
- Insurance Expense.
- Interest Expense.
- Rents Paid.
- Total Employee Cost (Salaries etc).
- Utilities (Fuel, power cost etc)
Operating Margin = Total Income – (Fixed Cost + Variable Cost)
#B. Which are the variable costs?
These are those cost whose quantum is dependent on the volume of production. In case a company is producing zero products or services, its variable cost will also be zero. Few examples of variable costs of companies are as listed below:
- Raw material cost.
- Transportation cost.
- Etc.
Variable Cost = Total Expense minus Fixed Cost.
Operating Margin = Total Income – (Fixed Cost + Variable Cost)
What we can make out from company’s fixed cost and variable costs?
- High Fixed Cost, Low Variable Cost: A company which has smaller variable costs (has mostly fixed costs) will have to do more work (sales) to reach the break-even point. But once the break even is reached (minimum amount of sales volume), profitability will grow faster beyond that point.
- Low Fixed Cost, High Variable Cost: A company which has low fixed costs (has mostly variable costs) will have to do less work (sales) to become profitable. But for such companies, when sales volume increases, expense will also increase rapidly. This will reduce its operating margins.
Let’s take hypothetical example of a company which manufactures Toys. Suppose this company is currently located in Chennai. It has following numbers playing in its favours:
- Current Annual Order Booking: 1,000 nos toys.
- Sales Price / toy: Rs.100
- Fixed Cost Per Year: Rs.50,000
- Variable Cost / toy: Rs.50
| Financial Data | Current | +10% Sales | +20% Sales | +30% Sales | +40% Sales | +50% Sales |
| Annual Order (in nos) | 1,000 | 1,100 | 1,200 | 1,300 | 1,400 | 1,500 |
| Sales Rate Rs./toy | 100 | 100 | 100 | 100 | 100 | 100 |
| Fixed Cost Per Year | 50,000 | 50,000 | 50,000 | 50,000 | 50,000 | 50,000 |
| Variabl Cost Rs./Toy | 50 | 50 | 50 | 50 | 50 | 50 |
| Fixed Cost Per Toy | 50 | 45 | 42 | 38 | 36 | 33 |
| Total Cost Per Toy | 100 | 95 | 92 | 88 | 86 | 83 |
| Total Cost Mfg. Cost | 1,00,000 | 1,05,000 | 1,10,000 | 1,15,000 | 1,20,000 | 1,25,000 |
| Total Sales Income | 1,00,000 | 1,10,000 | 1,20,000 | 1,30,000 | 1,40,000 | 1,50,000 |
| Operating Profit | 0 | 5,000 | 10,000 | 15,000 | 20,000 | 25,000 |
| Operating Margin | 0.00% | 4.55% | 8.33% | 11.54% | 14.29% | 16.67% |
What does this table say about the company? With current order booking levels, the company will operate at break-even levels (operating margin zero). But when volume goes up by 10%, 20%, 30%, 40% and 50%, the operating margins (OPM) will increase as shown below:
- Current – OPM 0%
- Sales growth 10% – OPM 4.55%
- Sales growth 20% – OPM 8.33%
- Sales growth 30% – OPM 11.54%
- Sales growth 40% – OPM 14.29%
- Sales growth 50% – OPM 16.67%
Now suppose the company wants to expand its base. It wants to open its facility in another Indian city. They have done cost analysis in two cities: Bangalore & Mumbai.
Bangalore (Fixed Cost Lower by 10%, but same Variable Cost):
- Sales Price / toy: Rs.100
- Fixed Cost Per Year: Rs.45,000
- Variable Cost / toy: Rs.50
Mumbai (Same Fixed Cost, but Variable Cost Lower by 10%):
- Sales Price / toy: Rs.100
- Fixed Cost Per Year: Rs.50,000
- Variable Cost / toy: Rs.45
The company should choose which city for its expansion plan? Let’s see how the numbers pans out for the two cities:
Bangalore:
| Financial Data | Current | +10% Sales | +20% Sales | +30% Sales | +40% Sales | +50% Sales |
| Annual Order (in nos) | 1,000 | 1,100 | 1,200 | 1,300 | 1,400 | 1,500 |
| Fixed Cost Per Year | 45,000 | 45,000 | 45,000 | 45,000 | 45,000 | 45,000 |
| Variabl Cost Rs./Toy | 50 | 50 | 50 | 50 | 50 | 50 |
| Operating Profit | 5,000 | 10,000 | 15,000 | 20,000 | 25,000 | 30,000 |
| Operating Margin | 5.00% | 9.09% | 12.50% | 15.38% | 17.86% | 20.00% |
What does this table say about the city? As fixed cost is lower (by 10%), even at current order levels of 1,000 numbers, the company will make an operating margin of 5%. When sales volume increases to say +50%, the operating margin will increase to 20%.
Mumbai:
| Financial Data | Current | +10% Sales | +20% Sales | +30% Sales | +40% Sales | +50% Sales |
| Annual Order (in nos) | 1,000 | 1,100 | 1,200 | 1,300 | 1,400 | 1,500 |
| Fixed Cost Per Year | 50,000 | 50,000 | 50,000 | 50,000 | 50,000 | 50,000 |
| Variabl Cost Rs./Toy | 45 | 45 | 45 | 45 | 45 | 45 |
| Operating Profit | 5,000 | 10,500 | 16,000 | 21,500 | 27,000 | 32,500 |
| Operating Margin | 5.00% | 9.55% | 13.33% | 16.54% | 19.29% | 21.67% |
What does this table say about the city? As variable cost is lower (by 10%), even at current order levels of 1,000 numbers, the company will make an operating margin of 5%. When sales volume increases to say +50%, the operating margin will improve further (21.67%)
Conclusion:
- Chennai: Operating Margin – 16.67%.
- Bangalore: Operating Margin – 20%.
- Mumbai: Operating Margin – 21.67%.
When company is small, it does not make any difference between fixed cost and variable cost. But when the company grow in size, it is always better to keep the variable costs lower.
Suggested Reading:


Nicely explained
Dear Mr. Mani,
Just I started to study how to purchase stocks. I read some technical abbreviations and words from BSE SITES but not understand.
but your blogs are very good and informative.
Thanks very much.
Thanks
please keep on sharing your knowledge with us. Thanks a ton!
thank you so much for explaining in such simple language. you are a born teacher. Thanks for this effort
Thanks a ton. I’m no teacher. I just share my ideas.
Mani very insightful article really very informative and with easy to understand language, Great Work thanks a ton!!for your efforts..
Hi mani, I’ve recently started reading your blog & i think its highly insightful & most importantly very easy to understand (mainly articles on investing principles) in my opinion you should consider writing a book on investing, thank you.
Thanks for your appreciation. I’m glad that you liked my work. Regarding book, I have couple of ebooks. Please check it here:
http://ourwealthinsights.com/e-book/