Summary Points:
- The difference between the cash market (buying stocks outright) and the derivative market (betting on future price movements without owning stocks), using relatable cricket and housing analogies.
- Why the derivative market dominates trading volume in India (90–95%) due to high leverage and tools for hedging/arbitrage, though it influences stock prices indirectly via sentiment.
- How FIIs and DIIs use both markets for flexibility, buying in the cash market for long-term growth and derivatives for hedging or quick profits.
- Decoding terms like “FIIs positioning,” “bearish bets,” “short-covering rally,” and “long-to-short ratio” to understand market signals and make smarter investment decisions.
Introduction
I’m somebody who mostly sticks to buying stocks directly from the market. I’ve been investing in this market since 2008, so I can say I’ve spent some time here. But still I find hard to grasp some jargons related to stock investing. I was recently reading an article on Upstox where a paragraph talked about about FIIs and their moves in the market. Honestly, it felt like code. Mostly, these terms originate from derivative investing which I don’t practice. But here’s the thing, understanding these concepts can actually help us make smarter decisions. So, let’s try to learn to make sense out of these jargons for our cause.
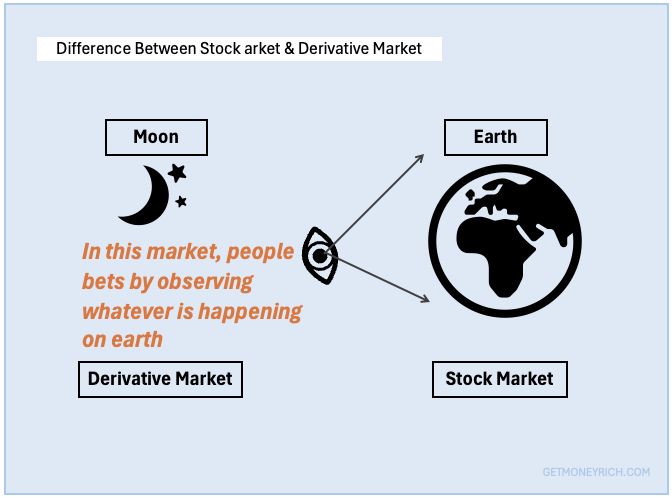
Difference Between Cash Market vs. Derivative Market
Let’s first understanding the two main playgrounds of the stock market: the cash market and the derivative market.
- Think of the cash market as the straightforward, no-nonsense part of the market. It’s where you and I usually trade, buying shares of a company like Reliance or HDFC Bank with our spare cash (savings). Here, we but shares with a hop that the price goes up so we can sell at a profit later. Here, we pay the full amount upfront, take ownership of the shares, and that’s that. Simple.
- The derivative market is where the high-stakes trades take place. In the derivative market, you’re not buying the actual stock. Instead, you’re trading contracts that derive their value from a stock, an index (Nifty 50), or even commodities like gold. These contracts, called futures and options, allow you to bet on the future price of the asset without owning it. For example, if I think the Nifty 50 index will go up next month, I can buy a Nifty futures contract today and profit if my prediction is right. While doing this, I do not need to own the actual stocks in the Nifty index.
Analogy #1: Cricket
Let’s assume that betting is legal in the cricketing world. Imagine that a world cup even is going to happen soon.
- The cash market will be where people buy tickets to watch the match at the stadium. You pay the full price upfront, get your seat, and enjoy the game live. Here, people are directly part of the action, just like when you buy actual shares of a company in the cash market and own them outright.
- Now, the derivative market is like placing a bet on the match without going to the stadium. You don’t own a ticket or play in the game. But you’re betting on whether a team win or lose. You can even bet on how many runs Virat Kohli will score. You’re not directly involved in the match itself, you’re just making a side bet on what you think will happen. This is similar to how in the derivative market you’re betting on the future price of a stock or index without owning the actual shares.
In this cricket world, the cash market is the real game on the field (buying and owning), while the derivative market is the betting counter outside the stadium (speculating on the outcome).
Analogy #2: Housing Market
- The cash market is like buying a house to live in. To buy the house we pay the full price and move in.
- The derivative market is like placing a bet on whether the price of that house will go up or down in the future. This is done without ever owning the house. From the outside, the trader is just observing the price movement of the house and betting on the movements.
The Size
In the Indian stock market, the derivative market is massive compared to the cash market. If the total trading value in the market is, say, 100 units, the derivative market often accounts for 90–95% of that, while the cash market is just 5–10%.
This means the derivative market has a dominant say in how the overall market moves. Big players like FIIs (Foreign Institutional Investors) and DIIs (Domestic Institutional Investors) often drive these derivative trades, which is why their moves can make or break the market.
The derivative market is so dominant because it offers high leverage. It allows traders to control large positions with relatively small capital. The feature of the derivative market attracts speculators and day traders looking for quick profits. Additionally, derivatives also provide tools for hedging and arbitrage, drawing in institutional players like FIIs and DIIs who trade.
- What it means by Leverage? Derivatives let you trade a lot of stocks or contracts by paying just a small amount of money upfront. This way you can make bigger profits. But it also amplifies the losses. It’s like playing gambling on borrowed money.
- What it means by hedging and arbitrage? It means derivatives help you protect your money if stock prices fall (hedging) or let you make a profit by buying low in one place and selling high in another (arbitrage).
Does Derivative Market’s Influences Stock Prices More Than Cash Market?
Not quite, while the derivative market’s trading volume is dominant at 90–95%, this doesn’t directly translate to a 90% influence on a stock’s price in the cash market.
Stock prices in the cash market are influenced by a mix of factors:
- Supply and demand in the cash market itself,
- Fundamental company performance, and
- Broader market sentiment, with derivative activity often acting as a leading indicator or amplifier of price movements rather than a direct 90% driver.
Please note that, in the derivative market, people are just making bets on whether stock or index prices will go up or down. They do it without actually buying or selling the real stocks. So, it only affects the stock price indirectly by changing how people feel about the market (sentiment), not by directly moving the price.
Why Do FIIs and DIIs Play in Both Markets?
If the cash market is simpler, why do FIIs and DIIs even bother with derivatives?
FIIs, like global hedge funds or investment firms, sometimes invest in the cash market when they’re feeling optimistic about India’s growth story. They might buy shares of Indian companies directly, just like we do, to hold for the long term. But other times, they use the derivative market to hedge their bets or make quick profits.
For example, if they think the market might crash soon, they can use derivatives to “short” the market (bet on a price drop) without selling their cash market holdings.
DIIs, like mutual funds or insurance companies in India, do the same thing.
They might buy stocks in the cash market for their long-term portfolios but use derivatives to protect against sudden market drops (this is called hedging).
The logic of the derivative market is simple, it gives big players flexibility. They can speculate on price movements, hedge their risks, or even amplify their returns, all without tying up too much capital. For us retail investors, though, derivatives can be risky because they often involve leverage (borrowing money to trade), which can lead to big losses if things go south.
Understanding A Paragraph of The Upstox’s Article
Now that we’ve got the basics down, let’s try to decode the paragraph I came across. If we can understand this para, we can say that there is a basic understanding to correlate what’s happening in a cash market vis a vis the derivative market.
Upstox’s paragraph read as below:
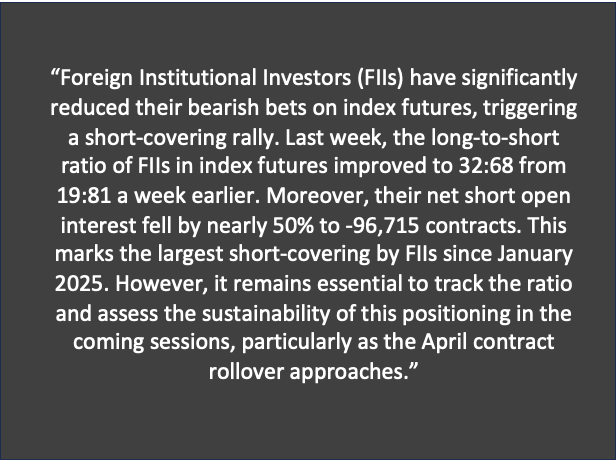
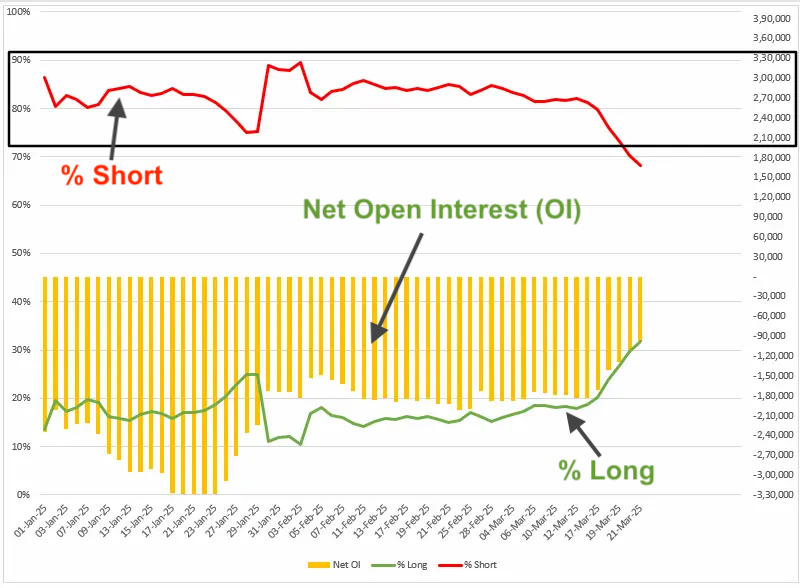
Let’s declutter this step by step. I’ll use the chart published on Upstox which shows FIIs’ net open interest, % short positions, and % long positions over time.
1. What Does “FIIs Positioning in the Index” Mean?
FIIs positioning in the index is a phrase often used to refer to how FIIs are placing their bets on the future direction of a stock market index, like the Nifty 50 or Sensex, using derivatives (specifically futures).
Are they betting the index will go up (a “long” position) or down (a “short” position)? Their “positioning” tells us whether they’re feeling bullish (optimistic) or bearish (pessimistic) about the market.
Is it important? Yes and No. No because, As the betting is going on outside the stock market (in. derivative market) it has no effect on the stocks itself. But, considering that these bets are placed by FIIs, DIIs, who have better understand and more data about the economy and market itself, their position tells us what they are thinking. Moreover, what these big investors are doing in the derivative market gives a hint that what they will do in the cash market. So yes, in terms taking clues, FIIs, DIIs actions on the derivative market is important.
If FIIs are heavily betting on a market drop, it might signal trouble ahead, maybe they know something we don’t. On the flip side, if they’re turning bullish, it could mean the market is about to rally, and we might want to jump in.
2. What Are “Bearish Bets,” “Index Futures,” and a “Short-Covering Rally”?
- Bearish Bets: When FIIs “reduce their bearish bets,” it means they’re scaling back on their belief that the market will fall. A bearish bet in the derivative market usually means they’re shorting the index. It means, they are selling futures contracts with the hope of buying them back at a lower price later to make a profit.
- Index Futures: These are derivative contracts tied to a stock market index like the Nifty 50. If I buy a Nifty futures contract, I’m agreeing to buy (or sell) the Nifty index at a specific price on a future date. It’s a way to bet on the index’s direction without owning the actual stocks.
- Short-Covering Rally: Okay, this one’s a bit tricky. When FIIs “short” the market, they borrow futures contracts and sell them, hoping the price drops so they can buy them back cheaper. But if the market starts going up instead, they’re in trouble, they’ll lose money. To avoid bigger losses, they start buying back those contracts to close their positions. This sudden buying is called “short-covering,” and when lots of FIIs do it at once, it pushes positive sentiments, which in turn pushes the index (or stocks) higher creating a “short-covering rally.”
Is it important? A short-covering rally can be an opportunity to ride the wave. If the market is going up because FIIs are covering their shorts, we might see a quick spike in stock prices. But we need to be careful, these rallies can be short-lived if the underlying trend isn’t strong.
3. What’s the “Long-to-Short Ratio,” and Why Did It “Improve” from 19:81 to 32:68?
The long-to-short ratio tells us the balance between FIIs’ bullish and bearish bets in the derivative market.
A “long” position means they’re betting the market will go up, while a “short” position means they’re betting it’ll go down.
- A ratio of 19:81 means for every 19 long contracts, FIIs had 81 short contracts, they were super bearish.
- But when it improved to 32:68, they became less bearish, 32 long contracts for every 68 short ones.
In the chart, you can see this shift. The red line (% short) drops from around 80% to 70%. The green line (% long) rises from 20% to 30%.
This means FIIs are starting to feel more optimistic about the market.
Is it important? The long-to-short ratio is like a sentiment indicator. If FIIs are turning less bearish, it might be a sign the market is bottoming out, and we could see a recovery.
As retail investors, we can use this as a signal to start looking for buying opportunities.
4. What’s “Net Short Open Interest,” and Why Did It Fall to -96,715 Contracts?
“Open interest” is the total number of derivative contracts (like futures) that are still active, not yet closed or settled.
“Net short open interest” means the number of short contracts FIIs have minus their long contracts.
A negative number like -96,715 means they’re still more short than long. They have 96,715 more short contracts than long ones.
But the paragraph says this number fell by nearly 50%, meaning they closed a ton of their short positions.
In the chart, the yellow bars (net open interest) show a sharp drop from around -1,80,000 to -96,715. That’s a big reduction in their bearish bets.
Is it important? When FIIs reduce their short positions, it often means they’re less worried about a market crash. For us, this can be a sign of stability, maybe it’s a good time to hold onto our stocks or even add to our positions.
5. What’s the “Largest Short-Covering by FIIs Since January 2025”?
We already talked about short-covering.
It is when FIIs buy back the contracts they shorted to close their positions.
The paragraph says this was the “largest short-covering since January 2025.” It means, FIIs haven’t closed this many short positions in one go since January. In the chart, you can see a big dip in the yellow bars (net open interest) around mid-March, which matches this description.
Is it important? A big short-covering event can signal a turning point in the market. If FIIs are rushing to cover their shorts, it might mean they think the market has hit a bottom and is ready to bounce back.
For us retail investors, this could be a cue to start looking for undervalued stocks to buy.
How Does All This Help Us Retail Investors?
Now that we’ve decoded these terms, let’s talk about the big picture.
Why should we care about what FIIs are doing in the derivative market?
Here’s the thing we must understand. FIIs are the big fish in the market. Their moves in the derivative market can create a sentiment (positive or negative) that eventually affect the prices of the stocks we hold. By understanding their positioning, we can get a sense of where the market might be headed.
For example:
- If FIIs are heavily shorting the market, it might be a sign to be cautious, maybe hold off on buying new stocks or even sell some to lock in profits.
- If FIIs are covering their shorts and turning bullish, like in this case, it could be a green light to start investing again.
Understanding derivatives gives us a peek into the strategies of the big players. We might not trade futures ourselves, but knowing how they work helps us anticipate market moves.
Conclusion
So, what did we learn today?
We figured out the difference between the cash and derivative markets. Now we know, why FIIs and DIIs play in both cash and derivative market.
We also saw how FIIs’ moves, like reducing their short positions, can signal a potential market rally, as shown in the chart.
I’ll suggest this for new retail investors?
- Start paying attention to FII and DII activity. You can find this data on websites like the NSE or in financial news outlets. It’s like having a cheat sheet for the market.
What do you think, does this make the stock market feel a little less intimidating?
Let me know in the comments, your feedback will tell me if my work actually helping you or not.
Have a happy investing.