
What is the significance of high EPS companies? Why investors look for stocks with high EPS ratio? Does high EPS really means that the stock is good for investing? [list of High EPS stocks is here]
Principally, ‘high EPS’ of a stock is a good thing. But high EPS alone does not make a stock good for investing. What shall be more interesting for investors is a combination of ‘high EPS’ and ‘low PE’.
We will talk about this combination (EPS+PE) later in this article. But before that, it will be nice to dig slightly deeper into the “concept of High EPS“.
Let’s see what it means by High EPS, and how shareholders of high EPS stocks can benefit from it.
What is EPS?

EPS is an acronym for ‘Earning Per Share”. EPS is a ratio between ‘net profit‘ of a company and its ‘number of shares outstanding‘ in the market. It means, there are two components of EPS:
- Net Profit (PAT): Net profit made by a company is assumed to be shareholders money. Theoretically all shareholders has a proportional claim on the net profit made by the company. In India, its unit can be in Rs.Crore.
- Shares Outstanding (N): It is the total number of shares held by all shareholders of the company. It consists of shares held by public, mutual funds, FII’s, HNI’s etc. It does not include shares held by company’s insiders. Its unit is in numbers (in nos crores).
The mathematic formula for EPS can be expressed as: EPS = PAT / N. In India, EPS’s unit can be Rupees per share.
What it means by ‘High EPS’?

There can two ways in which EPS of a stock can be high. Either its net profit (PAT) is high, or ‘number of shares outstanding’ is low. Let’s understand the concept of “net profit – nos of shares – & EPS” with an example.
Suppose there is are two grocery shops in a market. One shop is owned by two (2) parters, and the other is owned by four (4) partners. Both the shop makes a net profit of Rs.15,00,000 per year. What will be the EPS of these two shops? [EPS=PAT/N].
Shop_1
- PAT = Rs.15,00,000
- N = 2 Nos
- EPS_1 = Rs.7,50,000
Shop_2
- PAT = Rs.15,00,000
- N = 4 Nos
- EPS_2 = Rs.3,75,000
Please note that, though both the shops are making same net profits (Rs.15,00000), but as the number of partners (N) are less for shop-1, its EPS (Rs.7,50,000) is higher than EPS of shop-2 (Rs.3,75,000)
How high EPS makes a difference?

A company can do two things with its net profits. Either it can retain them, or pay them as dividends to its shareholders. In real world, companies does both. How? They retain a part of net profits, and distribute the balance as dividends.
Let’s take another example to understand the concept.
Suppose there is a grocery shop which made a profit of Rs.12,00,000 last year, and Rs.15,00,000 in present year. There are four (partners) in this shop. These partners (Board of Directors), has made a policy that 40% of profits will be retained, and balance 60% will be shared as dividends. Let’s see how the EPS gets distributed among the four partners:
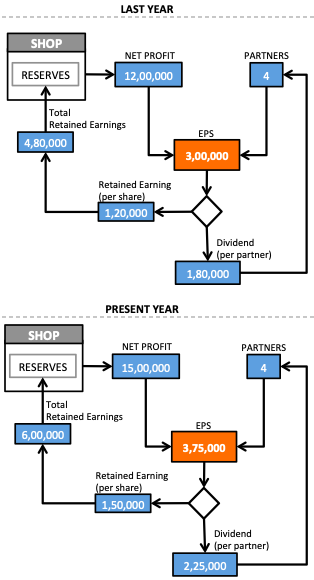
There are two points worth noting in the above comparison:
- High EPS mean more dividend: High EPS eventually leads to more dividends in the pocket of the partners (shareholders). As the EPS grows with time, shareholders will earn higher dividends. But of course, here the assumption is that – the minimum dividend payout of 60% remains intact in all future years. Read an interesting thing about dividend yield formula.
- High EPS means more reinvestment: High EPS also means that more money is retained by the company. This retained money is then used for future growth of business. This future growth eventually becomes visible to shareholders in form of share price increase over time. Read more about what companies do with retained earnings.
Either way, ‘high EPS’ means benefits for the shareholders. The benefit is either immediate or forthcoming. In other words, we can say that high EPS is one of the key indicators of ‘strong business fundamentals‘ of a company.
Quality of EPS
Along with high EPS, it is also essential to check the quality of EPS. Looking only at high EPS numbers does not say enough about its quality. It is also important to look at two more metrics. Let’s proceed with an example.
MRF stock has a very high EPS numbers. Its TTM EPS is at Rs.2,586.26. To get a better feel about the quality of EPS of MRF, we will also check its ‘EPS growth rate’ and ‘dividend payout’.
- Past EPS growth: High EPS is a good thing. But its quality will be further enhanced if it is also growing with time. In last 5 years, MRF’s EPS has grown at a rate of 3.37% per annum. A growing EPS is good, but in Indian context, growth rate of 3.37% p.a. is low. Check here for MRF share price analysis.

- Dividend Payout Trend: This metric is more valid for dividend focused investors. If dividend payout ratio is 0%, no matter how high is the EPS, dividend income will still be zero. In other words, the quality of EPS gets enhanced (from shareholders point of view), when a ‘high EPS company’ also pays dividends. Regarding dividend, one must check two details: (i) dividend payout %, & (ii) the trend of payout. Check a list of top dividend paying stocks.

- Looking at the last 10 years numbers, it looks like MRF wants to follow a dividend payout ratio of 1.75%. But depending on their immediate need for funds, they keep tweaking the number up and down.
Conclusion: Here we can conclude two things: (1) Though MRF’s EPS is super high, but EPS growth is slow. (2) MRF’s dividend payout is also low, but it is at least consistent. All in all, the overall “quality of EPS” is moderate for MRF.
When EPS is growing…
A growing EPS is one of the most loved stock metric of all. But what makes the EPS grow? There can be two reasons:
- Net Profit is increasing: If number of shares outstanding remain same, every time the net profit of the company increase, its EPS will also increase. See the EPS formula above. Read more about profit margin analysis of companies.
- Shares buyback: For the same net profit levels, if the company buys back its shares from the market, EPS will increase. Why? Because buying back shares decreases the number of shares outstanding in the market. See the EPS formula above. Read more about shares buyback.
Role of P/E ratio in High EPS stocks
High EPS ratio of a stock is a good fundamental indictor for investors. Added to it, if the EPS is also growing, it is like an icing on the cake. For dividend investor, ‘high EPS’ + ‘EPS growth’ + ‘High Dividend Payout’ is a dream come true.

But, even if all the above parameters are true, one cannot simply go ahead and buy the stock. It is also necessary to do a valuation check. Why? Let me give you an example.
Suppose there are two stocks A & B, whose EPS is Rs.1,000 per share. Considering that the EPS is so high, we may be tempted to buy this stock, right? But it is important to ask two important question here.
How much I’ve to pay to buy this stock? Is it worth paying this money?
Stock A
- EPS: Rs.1,000
- Price: Rs.15,000
- P/E: 15
Stock B
- EPS: Rs.1,000
- Price: Rs.20,000
- P/E: 20
In the above example you can see that, for the same EPS numbers, Stock B is charging a higher price than Stock A. This ambiguity is highlighted by the higher P/E numbers shown by Stock B.
Hence we can say, the lower is the P/E ratio, the better valued is the stock. Hence, in our above example, Stock A looks like a better buy than B. Read more about the significance of low PE in stock investing.
[Do a more detailed stock analysis in MS EXCEL]
Conclusion…
Looking to buy stocks which has high EPS ratio is a good first step. But one cannot focus only on high EPS. It is also essential to look at other value indicators to screen stocks further. These are the four value indicators which can help one to shortlist a good stock:
- High EPS ratio.
- Positive EPS growth in past.
- High Dividend Yield.
- Low P/E ratio.
List of high EPS stocks with their EPS growth
Updated: 21-Feb-2020
| SL | Company | Size | EPS | EPSG-5Y |
| 1 | Ion Exchange (India) | Small | 69.3 | 70.01 |
| 2 | Bombay Burmah Trdg | Mid | 155.6 | 33.82 |
| 3 | Transpek Industry | Small | 141.2 | 55.78 |
| 4 | Frontier Springs | V.Small | 31.1 | 119.56 |
| 5 | SVP Global Ventures | Small | 54.2 | 173.26 |
| 6 | Jyoti Resins & Adhesives | V.Small | 19.0 | 85.57 |
| 7 | Gujarat Petrosynthese | V.Small | 4250.0 | 65.96 |
| 8 | IOL Chemicals & Pharm. | Small | 65.5 | 58.49 |
| 9 | APL Apollo Tubes | Small | 97.5 | 26.88 |
| 10 | Raymond | Small | 49.8 | 26.47 |
Handpicked Articles:


Please give some simple indicater and formulae to find out valuation
Great Explanation. Thanks! I have one doubt…
company A: EPS for last 5 years: 50, 62, 58, 54, 66. Avg EPS = 58. 5 Years EPS GR = 32%
company B: EPS for last 5 years: 100, 112, 108, 104, 116. Avg EPS = 108. 5 Years EPS GR = 16%
Please let me know if I have calculated 5 years EPS GR correctly. Also, in that case though Company A have better growth rate, but Company B giving more earnings with the same consistency as A. In which company should I invest? consider all other parameters are same.
EPS on its won says nothing about stock being good or bad. One must use financial ratios to go deeper into stock analysis.
By the way, try applying P/E, and PEG ratio to your Company A & B. It will bring you closer to the answer. Thanks for asking.
Its fantastic , best guidance to buy in stocksafter self analysis of PEG PE AND EPS
Kindly give all ratio and buying guide to best 10 lagre ,midium and small caps in year 2019
so we can blindly buy the stock.
Gys!! this is one of the best site i came across. Do you guys have an App?/
DHFL EPS shown as 97 is incorrect, it’s 37 .March 18 and may be 43 March 19. How can I trust for other data?
What is published is Mar’18 data. As on today (Dec’18), EPS of DHFL has gone below Rs.40.
To correct the authenticity of any EPS data you can cross check it like this:
EPS = (Last 12 months PAT) / No of shares outstanding.
Thanks for your comment.