Fundamental analysis is a cornerstone of successful stock investing. It empowers individuals to make well-informed decisions in the dynamic world of the stock market. This approach goes beyond the analysis of short-term market fluctuations. Instead, it focuses on evaluating the intrinsic value of a company, uncovering its true worth.
At its core, fundamental analysis involves an examination of a company’s financial health, performance, and potential for growth. It is done by delving into the company’s financial statements. Fundamental analysis also digs into industry trends and economic indicators. This way the investors can gain valuable insights into the company that guide their investment strategies.
The primary goal of fundamental analysis is to answer critical questions about a company’s current position and future prospects. Is the company generating consistent profits? How efficiently is it utilizing its assets and resources? What are the long-term growth prospects for the industry it operates in? Understanding these factors is vital to making sound investment decisions.
By conducting fundamental analysis independently, investors can develop a deeper understanding of the companies they invest in. Consequently, they can make more confident decisions based on their own research and analysis. It is a skill that cannot be learned in a short period, the understanding grows over time upon practice.
Throughout this article, we will explore the step-by-step process of conducting a fundamental analysis of stocks. So, let’s start the journey.
#1. Introduction
In the fundamental analysis of stocks, we study the underlying business of that stock. What is the need for fundamental analysis?
Suppose you want to eat chocolate, what do you do? You will go to the market and buy a KitKat, Munch, Barone, or Milkybar. This is easy, this is the way everybody consumes chocolates
But suppose you want to buy the company itself that manufactures these chocolates. Do you know which company manufactures them? It is Nestle India. Correlating products and brand names with the company and its stocks is the first step of fundamental analysis. This is how one must start the analysis.
What next?
Buying chocolates is easy. We know the brand name that we like and we buy them at its market price. But the company (stocks) purchase is not as easy. There are three main limitations:
- We cannot buy a weak company,
- An overvalued stock purchase is a big NO.
- We cannot buy a slow-growth company.
To overcome these limitations, the fundamental analysis of stocks (companies) becomes necessary. So let’s begin with the most basic question.
#1.1 What is Fundamental Analysis

Fundamental analysis is a broad study of business. Here not only the impact of underlying business on its stock price is studied, but the outside influence (like of economy) is also considered.
Fundamental analysis is suitable for long-term investors.
It is a method that tells the investor whether the business in considering is fundamentally strong or weak and if its current price complements its fundamentals.
It is also important to note that the stock market is full of low-quality stocks. On one hand, we have fundamentally strong stocks, and on the other hand, we have a plethora of weak stocks. Fundamental analysis is a strategy to differentiate between fundamentally weak and strong stocks.
Once clarity about fundamentals is achieved, the next step is intrinsic value analysis.
#1.2 What is Intrinsic Value

Intrinsic value is the price at which an investor should buy a stock. Intrinsic value is also called true value or fair price. Buying stocks above intrinsic value means buying an overvalued stock.
The price of an overvalued stock has a tendency to go down in the near term. Even in the long term, stocks bought at an overvalued price level may rise only lazily. This slow growth rate may not justify the purchase and holding of a risky asset like stocks.
Suggested Reading: A Detailed Guide on the Concept of Intrinsic Value.
#1.3 What We Require To Do Fundamental Analysis by Oneself
To do a complete fundamental analysis of stocks, an analyst will need the following:
- Current Annual Report,
- Financial statements (profit & loss accounts, balance sheets, and cash flow statements) and historical price data,
- Key financial ratios.
- Industry research, and
- Economic indicators.
Additionally, access to the latest news and updates about the company will be good. This comprehensive assessment guides investment decisions, providing a holistic view of the company’s potential for long-term success in the market.
Let’s proceed and discuss each of the above five requirements to know how they can assist in the fundamental analysis of stocks.
#2. Annual Report
The annual report is a crucial document for the fundamental analysis of a company. It serves as a comprehensive summary of the company’s financial performance, operations, and overall health during the past year. The report is published once a year and is intended for various stakeholders, including shareholders, potential investors, analysts, regulators, and the general public.
Its purpose is to provide transparency and accountability to shareholders and other interested parties by disclosing relevant information about the company’s operations, financial position, and future prospects.
Content of an Annual Report
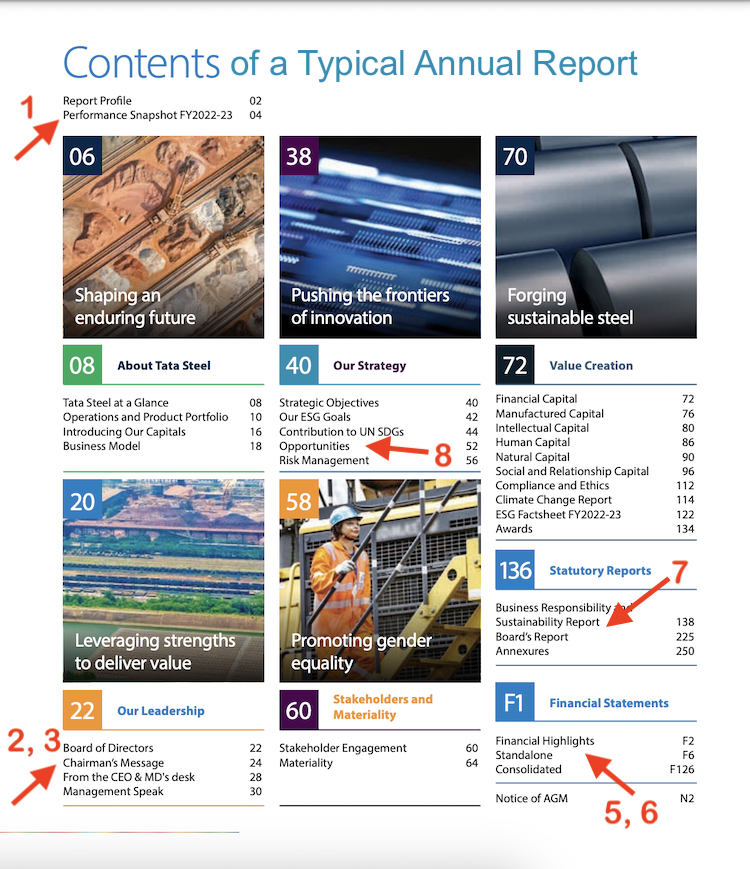
Here are a few sections of the annual report that a fundamental analyst should read in particular. We’ll specially discuss in more detail reading and analyzing the financial statements (SL.No: 5) later in this article.
- Financial Highlights: This section offers a snapshot of the company’s financial performance for the year, typically including key figures such as revenue, net income, earnings per share, and dividends.
- Management Statement: This is usually a letter from the company’s CEO or Chairman, summarizing the company’s achievements, challenges, and future outlook.
- Management Discussion & Analysis (MD&A): This section provides a detailed analysis of the company’s performance, discussing the factors influencing its results, industry trends, and future strategies. It helps investors understand the management’s perspective on the company’s performance.
- Auditor’s Report: This report is prepared by the company’s external auditor and includes their opinion on the accuracy and fairness of the financial statements.
- Financial Statements: These statements include the balance sheet, income statement, cash flow statement, and statement of changes in equity. They provide a comprehensive view of the company’s financial position.
- Notes to Financial Statements: These notes provide additional information and explanations for specific items in the financial statements.
- Sustainability/CSR Report: Some companies include a section on their sustainability efforts and corporate social responsibility initiatives.
- Opportunities and Risks: This section identifies and explains potential risks and opportunities that may impact the company’s performance.
Potential Implications of Misrepresenting Facts
Misrepresenting facts in an annual report can have severe consequences for the company. Investors rely on the accuracy and transparency of the information provided to make informed decisions. Misleading or false information could lead to a distorted perception of the company’s performance. It may lead to misallocation of resources and potential losses for investors.
Moreover, misrepresenting facts may lead to legal and regulatory repercussions, damaging the company’s reputation and credibility in the market.
Example of Misrepresentation:
Let’s consider a hypothetical example of a company that manipulates its financial statements by inflating its revenue figures to give the impression of robust growth. As a result, investors may be enticed to buy the company’s shares at an inflated price. They do it in expectation of continued growth.
However, when the truth comes to light, and the actual revenue figures are revealed, the stock price may plummet. Such a situation can cause significant losses for investors who relied on the falsified information.
#3. Key Financial Ratio Analysis
Financial ratios are essential tools in fundamental analysis, providing valuable insights into a company’s financial health and performance. These ratios offer a standardized way to measure various aspects of a company’s operations, making it easier to compare performance across different companies and industries. Here are eight of the most important financial ratios that should be included in the fundamental analysis:
#3.1 Price-to-Earnings (P/E) Ratio
- Formula: P/E Ratio = Market Price per Share / Earnings per Share (EPS)
- Significance: The P/E ratio indicates how much investors are willing to pay for each dollar of a company’s earnings. A higher P/E ratio suggests that investors have higher growth expectations for the company.
- Interpretation: A high P/E ratio may imply that the stock is overvalued or that investors anticipate strong future earnings growth. Conversely, a low P/E ratio might indicate an undervalued stock or expectations of lower earnings growth.
- Caution: The P/E ratio should be used cautiously, as it may not accurately reflect a company’s true value. It may vary widely between industries, and high P/E ratios can also be a result of inflated stock prices.
- Suggested Reading: Basics of P/E Ratio.
#3.2 Price-to-Book (P/B) Ratio
- Formula: P/B Ratio = Market Price per Share / Book Value per Share
- Significance: The P/B ratio compares a company’s market value to its book value (net assets). A P/B ratio below 1 may indicate an undervalued stock.
- Interpretation: A P/B ratio below 1 suggests that the stock is potentially undervalued, as the market price is lower than the company’s net assets. However, this could also indicate underlying issues with the company or market sentiment.
- Caution: The P/B ratio should be used in conjunction with other valuation metrics, as it may not account for intangible assets and may not be suitable for companies with significant intellectual property or brand value.
- Suggested Reading: All about the book value of shares.
#3.3 PEG Ratio
- Formula: PEG Ratio = P/E Ratio / Annual Earnings Growth Rate
- Significance: The PEG ratio combines the P/E ratio with the company’s earnings growth rate, providing a more comprehensive assessment of a stock’s valuation. A PEG ratio below 1 may indicate that the stock is undervalued relative to its earnings growth potential.
- Interpretation: A PEG ratio below 1 suggests that the stock’s price is relatively low compared to its earnings growth, potentially indicating an attractive investment opportunity. Conversely, a PEG ratio above 1 might suggest an overvalued stock in relation to its earnings growth.
- Caution: While the PEG ratio can be a useful tool, it is not without limitations. It relies on projected earnings growth, which may be subject to change, and it may not fully capture other factors influencing a stock’s value.
- Suggested Reading: All about of PEG Ratio.
#3.4 Debt-to-Equity (D/E) Ratio
- Formula: Debt-to-Equity Ratio = Total Debt / Shareholders’ Equity
- Significance: The debt-to-equity ratio measures a company’s financial leverage and risk. A high ratio suggests that the company relies heavily on debt financing.
- Interpretation: A high debt-to-equity ratio may indicate a higher financial risk, as the company has more debt relative to its equity. A lower ratio is generally considered more favorable, as it suggests a more conservative financial structure.
- Caution: The ideal debt-to-equity ratio varies by industry, and high debt levels could make a company more vulnerable to economic downturns or rising interest rates.
- Suggested Reading: All about Debt To Equity (D/E) Ratio.
#3.5 Current Ratio
- Formula: Current Ratio = Current Assets / Current Liabilities
- Significance: The current ratio assesses a company’s ability to meet short-term obligations. A ratio above 1 indicates sufficient liquidity.
- Interpretation: A current ratio above 1 suggests that the company has enough current assets to cover its short-term liabilities. Higher current ratios are generally considered more favorable.
- Caution: An extremely high current ratio may imply that the company is holding excessive levels of non-productive assets, while a very low current ratio may indicate potential liquidity issues.
- Suggested Reading: Learn about liquidy and solvency ratio analysis.
#3.6 Quick Ratio (Acid-Test Ratio)
- Formula: Quick Ratio = (Current Assets – Inventory) / Current Liabilities
- Significance: The quick ratio is a more stringent measure of liquidity, excluding inventory. It reflects a company’s ability to pay short-term liabilities without selling inventory.
- Interpretation: A quick ratio above 1 indicates that the company can cover its short-term liabilities without relying on inventory sales. Higher quick ratios are generally preferred.
- Caution: Similar to the current ratio, an extremely high quick ratio might imply excessive non-productive assets, while a very low ratio may signal potential liquidity challenges.
- Suggested Reading: Learn about liquidy and solvency ratio analysis.
#3.7 Return on Equity (ROE)
- Formula: ROE = (Net Income / Shareholders’ Equity) x 100
- Significance: ROE measures a company’s profitability in relation to shareholders’ equity. A higher ROE indicates better returns for shareholders.
- Interpretation: A high ROE suggests that the company is effectively utilizing shareholders’ funds to generate profits. A consistently high ROE is often seen as a positive sign of management efficiency.
- Caution: ROE should be analyzed in the context of industry peers and the company’s growth stage. High financial leverage can artificially inflate ROE, while low or negative ROE might indicate underlying problems.
- Suggested Reading: Understanding and interpretation of ROE.
#3.8 Return on Capital Employed (ROCE)
- Formula: ROCE = (Operating Profit / Capital Employed) x 100
- Significance: ROCE measures a company’s ability to generate profits from the total capital invested in its operations, including both equity and debt.
- Interpretation: A higher ROCE indicates that the company is efficiently utilizing its capital to generate profits. It provides insights into how well the company is using its assets to generate returns for both equity shareholders and debt providers.
- Caution: ROCE should be considered alongside other financial ratios. A high ROCE may indicate strong financial health, but it could also be a result of high financial leverage, which carries a higher risk. Additionally, variations in accounting practices can impact the calculation of ROCE across different companies.
- Suggested Reading: Understanding and interpretation of ROCE.
#3.9 Return on Asset (ROA)
- Formula: ROA = (Net Income / Total Assets) x 100
- Significance: ROA gauges a company’s efficiency in using its assets to generate profits.
- Interpretation: A higher ROA indicates that the company is more efficient in utilizing its assets to generate profits. Comparing ROA with industry averages can provide context for performance evaluation.
- Caution: ROA can vary significantly between industries, and capital-intensive businesses might have lower ROA compared to knowledge-based industries.
- Suggested Reading: About ROA Formula.
#3.10 Gross Margin
- Formula: Gross Margin = (Revenue – Cost of Goods Sold) / Revenue
- Significance: Gross margin measures the percentage of revenue that exceeds the cost of goods sold. A higher gross margin indicates better profitability.
- Interpretation: A higher gross margin suggests that the company is generating a greater profit from its core business activities. It also allows for a comparison of a company’s profitability to others in the same industry.
- Caution: Gross margin can be influenced by industry dynamics, competition, and changes in input costs. It should be interpreted alongside other profitability and efficiency ratios.
- Suggested Reading: Detail analysis of the profit margin of companies.
By analyzing these financial ratios, investors can gain insights into a company’s profitability, liquidity, debt levels, and overall financial stability.
However, it’s important to remember that financial ratios are not stand-alone indicators. They should be considered in the context of the company’s industry, growth prospects, and competitive landscape to form a comprehensive view of the company’s financial health. This is where reading and interpretation of financial reports of companies becomes essential.
#4. Learning To Read The Financial Statements
Analyzing a company’s financial statements is a critical component of fundamental analysis. Financial statements, comprising the income statement, balance sheet, and cash flow statement, provide a comprehensive overview of a company’s financial performance, position, and cash flow activities. Here’s how to effectively analyze each financial statement:
#4.1 Reading Profit & Loss (P&L) Accounts
The profit & loss (P&L) account is the most dynamic financial report of a company. First of all, it talks about how much income the company has generated in the last year (12 months). In India, the financial year of a business generally starts on the first of April and ends on the 31st of March. So when the P&L account is prepared it is prepared for a period between the 1st of April and the 31st of March.
The P&L accounts also indicate the various expenses that the company has incurred in the last year (FY).
Once the income and expense line items are listed by the company, the next important deduction that is made is called the gross profit. By adjusting depreciation, interest expense, and tax expense, the net profit (PAT) of the company is deduced in the P&L account.
Statement of Profit and Loss Account

Above is the snapshot of what a typical profit and loss account looks like. As a beginner one must first try to grasp the structure of this report. How it is structured? It starts with stating the income of the company. Next, it lists all expenses of the company. Then what will come is profit before tax (PBT), tax liability, and net profit (PAT).
#4.1.1 Income (Revenue)
In the profit and loss account of Tata Steel, the “Total Income” component of the company is represented as (a) Revenue from operations, and (b) Other income. In FY ending 31-Mar’20, the company’s total income was Rs.60,840.09 Crore, out of which Rs.60,435.97 Crore is from operations and Rs.404.12 Crore is from other sources.
The details of these income heads are provided in Notes SL 27 and 28. Hence if one wants to know a further break-up of revenue from operations or other income, one must look into these Notes. “Notes” form an integral part of financial statements.

Let’s look at the notes SL No 27 and 28.
Note No 27 provides a break-up of ‘Revenue from operations’. Here we will get to know what the company means by operation income. For Tata Steel, it is the sale of products, sale of power and water, etc.
The sale of products (Steel) has fetched Rs.57,167 Crores. The sale of power and water has fetched Rs.1,647 core. The company has also classified Rs.1,620 Crore worth of income as “other operating revenues”.

Note No 28 provides a break-up of “Other Income” sources. For Tata Steel other income is dividends, interest, change in value of investments (mutual funds), sale proceeds of capital assets, etc.
Other income accounts for Rs.404 Crore. Out of this Rs.89 Crore is dividend income. Rupees 73 crore is interest income. Rupees 98 crore is from the sale of investments like mutual funds Rs.147 crore is also accounted as “other miscellaneous income”.

#4.1.2 Expenses (Revenue)
Now we will look at the company’s expense statements. First, we will look at the absolute numbers and then at their respective notes. The company generally classifies its various expenses into a few expense heads. So the first thing we can look at here is, what are the expense heads of the company.
Generally speaking, depending on the type of business, similar companies will have similar expense heads. Like expense heads of manufacturing companies will be alike.

Cost of material consumed
The first expense head of Tata Steel is ‘Cost of material consumed’. This expense head has consumed Rs.17,407 crore for Tata Steel in FY ending 31-Mar’20. Unfortunately, I did not find any associated notes against this expense head. As an analyst, I would’ve loved to know more about which are ‘materials consumed’”’ and in which proportion.
Purchase of stock-in-trade
The second expense head is ‘Purchase of stock-in-trade’. This line item consumed Rs.1,563 crore in FY 2019-20. But again the company has not provided any break-up of these items.
Though the purchase of stock-in-trade means all those items with company purchases as finished goods. These are purchased and sold by the company without further processing. Remember these items are not raw materials for the company. They can either be finished goods brought forward in the current year from last year’s inventory, or trade items.
Changes in inventories of finished and semi-finished goods, stock-in-trade, and work-in-progress
The third expense head is “Changes in inventories of finished and semi-finished goods, stock-in-trade and work-in-progress”. This expense head is calculated by noting how much inventory, WIP, and stock-in-trade were there at the beginning of the year and the end of the year. For Tata Steel, in FY2019-20 this value was in negative (Rs.564 Crore). To understand more about this expense head, let’s look at note no 29.

There are three types of inventories for the company: (a) Work in progress: those raw material or items which are taken from stores but has not reached the finished goods storage bay. They are still in operation. (b) Finished Good is ready for sale products. (c) Stock in trade.
In this case, you can see that inventories at the end of the year (Rs.4,783 Crore) are more than Inventories at the beginning of the year (Rs.4,219 Crore). It means the company has produced more than it has sold. Hence the value of “change in inventory” is shown as negative (-Rs.564 crore) in the expense head.
Employee benefit expenses
The fourth expense head is “Employee benefit expenses”. Under this expense head, items like salaries paid to employees, provident fund contributions, and staff welfare schemes are listed.
This becomes more clear when we will see the note no 30. You can see that the salaries and wages cost Rs.4,231 Crore. The contribution to PF is about Rs.477 Crore, and the cost of the welfare scheme is Rs.328 Crore.

Finance Cost
The fifth expense head is classified as “Finance Cost”. Under this head, the cost to Tata Steel was Rs.3,031 crore. This is the cost incurred by the company when it borrows funds.
The borrowed funds can be bank loans, debt from financial institutions, bonds, credit lines, etc. The interest paid to the lenders on the borrowed funds is classified as a finance cost. Note 31 provides more details on the finance cost.

Depreciation and Amortisation
The sixth expense head is “depreciation and amortization expenses”. For Tata Steel, this cost is amounting to Rs.3,920 Crore. This is just an accounting adjustment and may not represent the actual cash outflow. It is important for analysts to understand the concept of depreciation. Details of the cost booked under Depreciation and amortization can be found under note no 32.

What is depreciation? It is an accounting method to book the cost of an asset as an expense not in one go but over time.
Example: Suppose a company has a net profit of Rs.10 Crore. It buys a machine (asset) costing Rs.15 crore in the year 2020. The expected life of the machine is say 5 years. In this case, if the company books the total cost of the machine (Rs.15 crore) in the year 2020 itself, its net profit will go in negative (10 crore minus 15 crore).
Hence, instead of booking all costs in one year, the company is allowed to depreciate its asset over the next 5 years. It means, each year the company can book Rs.3 crore (Rs3 crore x 5 years = Rs.15 crore).
P. Note: Depreciation is for tangible assets. Amortization is for intangible assets.
#7: Other Expenses
The seventh and last expense head is “other expenses”. All expenses which do not fall under the above six heads are booked under this head. For Tata Steel, this expense line item had a cost of Rs.23,803 crore. It is the biggest expense head for Tata Steel.
Generally speaking, when I see such high costs booked under the “other expenses” head I do not feel comfortable. Though details of other expenses are provided by the company under note no 33.

#4.1.3 Total Exceptional Items
When the company generates some income or expenses on account of such activities which are not typical, it can be listed as exceptional items. In the case of Tata Steel, in FY 2019-20, the cost booked under exceptional items is Rs.1,703 Crore. An explanation of all these costs has been provided in note no 34.

#4.1.4 Profit Before Tax (PBT), Tax Liability, and Net Profit (PAT)
What we have seen till now is the list of all incomes forming the “Total Income” of the company. We have also seen a list of all expenses forming the “Total Expenses” of the company – including exceptional items.

Subtracting total expenses from total income as calculated above will give us “Profit Before Tax”. For Tata Steel, the Profit Before Tax number is Rs.6,610 Crore.
The income tax liability for the company in FY 2019-20 is -132 crore. Why tax liability is negative? Because the company has decided to opt for deferred tax by an amount of Rs.1,920 crore.
I’m not sure what was the reason behind opting for deferred tax, but this is again something that does not make me comfortable about the company.
As the company has gone for deferring its tax liability, its net profit after tax (PAT) is amounting to Rs.6,743 crore which is higher than PBT. [PAT = PBT – Tax Liability]
#4.2 Reading The Balance Sheet
Profit and loss accounts give the status of profitability for a year. The cash flow report gives the status of cash flows for a year. But the balance sheet report tells the status of assets, liabilities, and equity from the day a company is formed.
The balance sheet tells how a company has handled its finances. Better utilization of finances ultimately leads to more profitability and cash flows. So we can say that for a company it all starts with its balance sheet. Let’s know more about it.
#4.2.1 Simplified Balance Sheet

The above image is a graphical representation of a balance sheet. What does a balance sheet balance? It is balancing Assets on one side and equity plus liabilities on the other. This gives us our Balance Sheet Formula.

From a general perspective, this is what a balance sheet report tells us about the company.
Liability Side
- Source of Fund: On the liability side, what we can find are the sources from where the company is arranging its finances. There are two ways a company can fund its business: (a) through the equity route and (b) through the debt route. A balance sheet report will tell what proportion is equity and how much is from debt.
- Equity: In this type of funding, a company is selling the ownership (shares) of its business in the stock market. People are buying those shares and becoming shareholders. The money so accumulated from the sale of shares is the capital raised through the equity route.
- Liability: There are two types of liabilities: Long term and short-term. When a company takes a loan for which the payback time is more than 12 months, it is a long-term liability. Likewise, loans with a payback time shorter than 12 months will be a short-term liability (also called current liability). The money so accumulated from debt is a liability for the company.
Asset Side
- Utilization of funds: On the liability side, what we have seen are the two sources of funds; equity and debt (total capital). On the asset side, we will see how the company uses these funds to run its business. Running a business can be seen as a two-fold process: (a) running the operations, and b) growing the operations.
- Non-current Assets: These majorly are constituted by fixed assets. A major portion of the total capital (equity & long-term debt) is used by the company to buy property, plant, and equipment. In other words, this money is used to build the infrastructure of the company.
- Current Assets: Another portion of the total capital is used to manage the current & upcoming needs (cash) of the company. What are the current needs? Already booked expenses (current liabilities). What are the upcoming needs? Working capital (non-booked future current liabilities).
How to read a balance sheet?

How to read a balance sheet with ease? First, divide the whole report into five sections. What are these sections? Five sections are (1) equity, (2) non-current liability, (3) current liability, (4) non-current assets, and (5) current assets.
Let’s start reading the balance sheet items line by line for the best understanding.
Equity
The first section of the balance sheet will be equity. Here the company declares how much equity (also called net worth) they have built-up as-of-date (from the date of inception).

From the screenshot shown above, you can see that the total equity component of the company (as of 31-Dec’19) is 1,932.26 Crore. This value is further broken down into Equity Share Capital of Rs.96.42 Crore, and Other Equity of Rs.1,835.84 Crore. To know more about each of the broken-down items, we need to see Notes number 16 and 17.

Note 16 highlights more about Equity Share Capital. The company has an authorized share capital (maximum money it can raise from the share market) of Rs.100 crore. Out of this, the company has already raised Rs.96.42 crore (paid-up capital). How equity share capital is calculated? Share capital = Number of shares issued x face value (9.64 crore x Rs.10/share = Rs.96.42 crore).
[P.Note: Shares are often issued at a price much higher than their face value. This is called shares issued at a premium. This results in the company raising extra delta capital (Delta = Selling Price – Face Value). But this delta does not go under the head “share capital”. It will be recorded under Other Equity (other equity > General Reserves > Security Premium Reserves. Though not all companies display it on their balance sheet reports]

Note 17 highlights more about Other Equity. It has two main components. First, there are general reserves of Rs.837.4 crore. Second, Retained earnings of Rs.1,030.76 crore. What are general reserves and retained earnings?

All profits recorded in the company’s P&L Account are first transferred to the balance sheet (Other Equity). One portion is kept as General Reserves and the other as Retained Earnings.
General reserves are kept aside to manage the future needs of the company. Retained earnings are the accumulated net profit of the company (to date) minus transfers to general reserves. It is from here (retained earnings) the shareholders are paid dividends.
Non-current liabilities

The liability section of the balance sheet starts with non-current liabilities (long-term liability). In the screenshot, you can see that the non-current liability is recorded as Rs.2,978.43 Crores. A further break-up of this liability is also provided with notes starting from 18 to 21. Let’s take up individual notes.

Note 18 talks about the Financial Liability (Borrowings) of Rs.53.14 crore by the company. My first impression was that it is a bank loan whose tenure is more than 12 months from reporting. But they were actually deferred VAT payable in the future.

Note 19 talks about long-term provisions. Generally speaking, long-term provisions of the company are generally funds kept aside by the company for employee benefits. In our example company, provisions are made for gratuity, incentives cum welfare benefits, and contingencies.

Note 20 talks about the deferred tax liability. This is another kind of provision kept in the book of accounts for future tax payments. Why did the company make this provision? When they foresee a situation where their tax burden may increase, they keep a provision for it from today.
Current Liabilities

What you can see in the above screenshot is a statement of the current liabilities of a company. In FY ending Dec’19, the company has posted a current liability of Rs.2,147 crore. The break-up of total current liability is also provided with details in Notes 46, 22, 23 & 24.
The company has not posted any numbers under the head borrowings. This means that the company has not taken any short-term loans from banks etc.
A majority portion of the current liability of the company is associated with the trade payables of Rs.1,494 crore (=34+1460). These are basically invoiced bills of the suppliers waiting to be paid.

Under the head of other financial liabilities, the company has posted Rs.431.47 crores. The details of the financial liabilities are available under note 22.

Like non-current provisions, the company also tracks those employee benefits which are going to get due in the next 12 months. Provision for such payouts is made under the head current provisions. The company has kept a provision of Rs.85.46 crores. The break-up of it is provided in note 23 (see the screenshot above).

In the next line of the balance sheet, what we have is Other current liabilities. Our example company has recorded Rs.133.96 crores against it. To know more about this line item, we will have to see note 24. Generally, companies post their statutory liabilities under this head. Any liability that cannot fit in the above-listed headings will go here.
Asset

What we will see now is how the company is utilizing its capital. How the capital is utilized? By accumulating non-current and current assets.
What are non-current assets? These are mainly the property, plant, and equipment of the company (also called fixed assets). Other types of non-current assets can be financial assets (like long-term investments). We can know more about them in the notes.

In Note 4 we can see the details about property, plant, and equipment. Check the above screenshot. It lists down items like land, building, plant, equipment, furniture, office items, and vehicles under this head. These are all fixed assets that are expected to add economic value to the company in the long term. Out of all the types of assets, this is the most capital-intensive of all (especially for manufacturing companies).
The next line item on the asset side of the balance sheet is capital work-in-progress (Rs.143.3 Crore). This is also related to property, plant, and equipment, but is recorded separately as the construction/execution work is still not complete. Once the execution work is finished, their numbers will be moved to the property, plant, and equipment line.

Under the head financial assets, one line item is investments (Rs.743.6 crore). One can see its details in note 5. In note-5, you can see that the company has invested its cash in two areas. First is tax-free bonds (Rs. 724.72 Crore), and second is shares (Rs. 18.88 Crore)

Another type of financial asset that the company has recorded in its balance sheet is loans (Rs.46.98 Crore). One can see its details in note 6. As you can see, a majority portion of the loan is under the head called Security Deposit (Rs.36.08 Crore). Generally, these are monies paid by the company against the property/apartments they have leased for office purposes, etc. The second common form of loans are monies issued to employees or group companies.
Current Assets

A good part of the capital raised by the company remains locked as current assets. This is that portion of the money that cannot be used for property, plant, and equipment expansion, purchase of LT investments, etc. It is of paramount importance for the company to keep some of its assets as liquid as possible. These liquid assets are referred to as current assets.
Generally speaking, the whole basket of current assets can be divided into two categories. First is inventory, and the second is easily-liquifiable-financial-asset (like cash, short-term investments, and due payments from customers, among others).

In Note 8, our example company has provided the details of their inventories worth Rs.1,283.07 crore. Look into the list of items under the head inventory. It will give you the impression that these items are not strictly liquid. Let’s divide the whole list into 4-types: unfinished goods (illiquid), semi-finished goods (illiquid), finished goods (liquid if there is a demand), and spares (illiquid). It is the reason why some analysts remove inventory numbers to judge the company’s real liquidity levels.

In Note 9, we can see the details of our first financial asset (investments of Rs.1,007 crore). These are all such investments that are getting matured within the next 12 months. Typical types of current investments by companies are T-Bills, government bonds, fixed deposits, debt mutual funds, etc.
The next line item under financial assets is the trade receivables (Rs.124.33 crore). These are basically outstanding payments waiting to be received from the customers’ end. In notes, a good company also shows a break-up between receivables considered safe and unsafe.

Cash and cash equivalent is the most reliable form of liquid asset that a company can have. In judging, if the company is sufficiently liquid or not, this component of the balance sheet plays a decisive role. Generally, the company parks its cash in current accounts and savings accounts to meet its short-term liquidity needs.
Other items listed under the head ‘current assets’ can be short-term loans issued by the company to their employees or group companies. These are such non-cash items that can easily be en-cashed when due (by the way of adjustments etc).

Under the head ‘other current assets‘ our example company has recorded an amount of Rs.26.02 crore. They have provided the details of this item in note 15. These mainly include advances paid to suppliers, employees, etc. Our example company has also included “Balances with government authorities” here. Ideally, this should either be adjusted under ‘account payables” or shall come under “trade receivables”. But the company has put it here because maybe they do not expect this cash flow to happen any time sooner. It may be, a kind of NPA for the company.
How balance sheet is related to its P&L a/c?

- Retained Earnings & PAT: Retained earnings in the balance sheet get updated every time the company makes a Net Profit (PAT). Net profit appears in companies’ profit and loss accounts.
- Debt & Finance Cost: The debt (long-term and short-term borrowings) in the balance sheet increases the company’s finance cost which appears in companies’ profit and loss accounts.
- Trade payables & Expenses: Trade payables of the balance sheet are a portion of the expense to be incurred by the company in the next financial year (FY).
- Tangible Assets & Depreciation: Tangible assets (property, plant, equipment, etc) valuation appears in the balance sheet. This value is net of accumulated depreciation. Depreciation applicable for a particular FY appears in the P&L account.
- Investments & Other Income: Investments (non-current and current) made by the company are recorded in the company’s balance sheet. The income generated by these investments is recorded as other income in the P&L account.
- Trade receivables & Income: Companies often sell their products and services to their customers on credit to earn income (income appears in the P&L account). This credit payment due, to be received by the next 12 months is recorded as trade receivable in the balance sheet.
Quick Overview of The Balance Sheet
Reading a balance sheet is only half the job done. It becomes even more interesting to make meaning out of the numbers printed here. How to do it? If we can understand the whole scheme of things (The Business) side of the balance sheet, its impact can be phenomenal. A very simplified representation of the balance sheet side of the business is shown below:

Look at the above infographics. It gives an idea of how the source of funds (Equity and liability) plays a role in funding non-current and current assets. You will also be able to understand which asset type is building long-term value for shareholders and which asset type is used only to ensure liquidity in the business.
#4.3 Reading The Cash Flow Report
Out of the balance sheet, profit & loss a/c, and cash flow report, perhaps the cash flow statement is the easiest report to read and comprehend. But in terms of effectiveness to judge the fundamentals of a company, this report is as valuable as the other two.
Cash is king for a company. If cash is flowing in and out at the required times, the company will remain afloat. The cash flow statement gives us this clarity about the company. Hence, a cash-rich company is always valued highly by analysts.
But a cash-rich company need not always confer with the idea of having ‘excess cash sitting in the bank’. A company can be said to be cash rich if its overall cash position remains positive.
How to judge a company’s cash position? By looking into areas from where the company is earning and spending its cash.
#4.3.1 What does it mean by Cash Position?

To judge a company’s cash position analysts resort to estimating free cash flow (FCF). Based on the estimated FCF, the intrinsic value of a company is estimated. The higher the FCF, the higher will be the company’s intrinsic value. When the intrinsic value of a company becomes positive and is also increasing, it is a clear sign of a strong cash position.
Example of a weak & strong cash position – How cash is king
Consider this hypothetically. There are two companies A and B.
- Company A has reported Rs.1,000 crore profit in its profit and loss account. But it was unable to collect a single penny from its customers [all sale was on credit & no advance was received]. But the company had a total cash-out of Rs.850 crore. This company will have a negative cash flow. Net Cash Flow (-850) = Cash In (0) – Cash Out (850). Hence it has a weaker cash position.
- Company B has reported Rs.10 crore profit in its profit and loss account. It was able to collect Rs.8.0 crore from its customer. The total cash-out in the same year was Rs.6.6 crore. This company has a positive cash flow. Net Cash Flow (1.4) = Cash In (8) – Cash Out (6.6). Hence it has a stronger cash position.
What does this prove? Investor are often obsessed with profits (or EPS) of a company. But profits gives us only a part-picture of the company’s financial health. To develop the whole story, we must look at their cash position. Without enough cash, valuation of a company may fall to negative – hence cash is king. Where you will get information about cash? In cash flow statement.
#4.3.2 Cash Flow Report & Bank Balance

Why do companies do business? At the end of the day, the business is done to make money. How to quantify the money made by the company? One way of looking at it is through their “bank balance”. If the cash parked in the bank (cash, deposits, short-term investments) is growing year on year, it is a clear sign of the company making money.
How company can increase its bank balance? By generating excess cash from its business. Here the term “business” is classified into three activities: (a) operating activity, (b) investing activity, (c) financing activity. At the end of the year, there should be a net cash-in flow from the combined effect of these activities.
When there will be a net cash-in flow, the bank balance will go up. When there will be a net cash-out flow, the bank balance will go down.
This is what’s actually represented in a cash flow statement, that at the end of the year, the cash position of the company has increased or decreased. The cash flow report also shows the activities which brought cash and activities that consumed cash for the company.
#4.3.3 Reading A Cash Flow Report
To make more meaning of the cash flow report, it is better to read 3 or 5-year numbers in one go. Here is a snapshot of the five-year cash flow statement of Nestle India. You can see how its numbers behaved in the last 5 years.

What you see in the above screenshot is a summarised version of the cash flow statement. But the actual report is much more detailed. What are the details? There are detailed break-ups of all three activities: (a) Operating activity, (b) Investing activity, and (c) financing activity.
Net Cash Flow From Operating Activity
Here will see all operating activities of the company which either has generated cash or consumed cash in the last financial year.
Start at the top
The statement of cash flow starts with counting how much cash the company’s operations have generated in the financial year. So the first line you will see will be “Cash Flow from Operating activities”.
Then the next line you will see is “Net Profit”. This value comes straight from the ‘profit and loss account’. In some statements, it is also referred to as “Net Profit before tax”. Please do not misunderstand it with Profit Before Tax (PBT).
So why in the Cash flow statement it is pronounced as …before tax? Probably it means “net profit before adjustment for the actual tax paid as of date“.

We have already discussed that only actual cash flows are recorded in this report. But PAT is not a true representation of the actual cash flow. So why use net profit (PAT) in the cash flow statement?
First things first, net profit is actually a result of cash flows happening in the company (actual or foreseen). How? Income is a cash flow. Expenses are cash flows. Interest & tax payments are cash flows. So the net of all these cash flows is “Net Profit (PAT).
But the problem with PAT is that some of these cash flows may not have actually happened. For example, all recorded income may not have been collected from customers. All expenses may not have still been paid.
So what is done in cash flow report is that, we take PAT in the first line, and then adjust it for the actual cash flows (in and out) which has happened in the financial year.
Please keep reading, this concept will become very clear in subsequent paragraphs.
Adjustments for operating activities (Before Considering Changes in Working Capital)
From here onwards we will start reading the cash flow report of a company from top to bottom. From the first line itself, there are activities that will be adjusted with PAT. What are the adjustments?
- Cash-in adjustments: All cash-in flows which has been accounted for in P&L a/c (as income), but have not actually happened will be subtracted from Net Profit (PAT).
- Cash-out adjustments: All cash-out flows which has been accounted for in P&L a/c (as expense), but have not actually happened will be added to Net Profit (PAT).

Details on how to read & interpret the numbers:
- D&A Expense: Rs.3,529 crore has been added back to PAT for Mar’20. This has been done because D&A expense is only an accounting adjustment. The actual cash-out may have happened a few years back. [Note: Rs.3,529 Cr, will appear in P&L a/c under the head “D&A Expense”]
- Bad debts, advances, payments: Rs.144 crore has been added back to PAT. These debts, advances, etc which were actually paid in the past have become ‘bad’ in this FY. So no actual cash-out has happened in this FY.
- Tax Expense: Rs.9,801 crore has been added back to PAT. This is done because it’s adjusted again at the end of operating activities as “Taxes paid (net of refunds = Rs.-5,846 crore. [Note: Rs.9,801 Cr, will appear in P&L a/c under the head “Total Tax Expense”]
- Net Gain on Investments: Rs.-214 crore has been deducted from PAT on account of loss upon sale of the investment (example: shares of a company sold at a loss of -214 core).
- Interest Income: Rs.-3,562 crore has been deducted from PAT. This is because the interest has accrued in FY’19-20 but the same is still not credited into the bank account. [Note: Rs.-3,562 Cr, will appear in P&L a/c under the head “other income”]
- Dividend Income: Rs.-10 crore has been deducted from PAT. This is because it has accrued in FY’19-20 but the same is still not credited into the bank account. [Note: Rs.-10 Cr, will appear in P&L a/c under the head “other income”]
- Finance Cost: Rs.924 has been added back to PAT. This is done because it’s adjusted again at the end of financing activities as “interest paid”. There is financing activity you will see a negative number (Rs.-924 crore).
Inference #1
As you can see, the next resultant number after adjusting for the above cash flows to Net Profit (PAT) is Rs.42,882 crore (calculation shown below).

What does the number Rs.42,882 crore mean? It means, after adjusting for all actual cash-ins and cash-outs, the cash position of the company has actually improved compared to PAT (Rs.32,447).
But this position might soon change when we will take working capital into consideration. Why? Because this is where the bulk cash handling takes place.
Adjustments for operating activities (Considering Changes in Working Capital)
Like above, now we will see how changes in working capital items will affect the net profit (PAT) recorded in the P&L account. Please note that all values shown here are represented as “Net Change in…” (This year Vs last year).
Again, if the item has caused a net cash-in flow for the company, it is recorded as positive. If the item has caused a net cash-out flow for the company, it is recorded as negative.

[Please note that all items indicated under the head “working capital” are either current assets or current liabilities (as recorded in company’s balance sheet). But the value indicated here are change in each items compared to last year. Any changes in these items will either cause a cash-in flow or cash-out flow for the company.

Negative numbers (Cash outflows)
- Trade receivables change: Rs.-3,295 core is added to PAT. Negative value means, compared to last FY end, the company’s trade receivables have increased. When it will increase? When the company sells more than it collects (payments) from its customers. Hence it is considered as a negative number.
- Un-billed receivables change: Same explanation as above.
- Loan receivables change: Rs.-2 crore is added to PAT. This is because compared to last FY, the quantum of this item has increased in this FY (by Rs.2 crore). It means, more loans are pre-paid (like inter-company or advance to employees etc).
- Change in Other assets: The quantum of ‘other assets’ has increased in the current FY by Rs.3,492 crore compared to last FY. This is the reason why, it is recorded as a negative number. In simple words, this line item has consumed cash worth Rs.3,492 extra this year.
Positive Numbers (Cash in-flows)
- Inventories Change: Rs.5 core is added back to PAT. This means that compared to last FY end, the company has reduced its inventory by Rs.5 core. How inventory can be reduced? By sale of the item. Hence it is considered a cash-in.
- Trade Payables: Rs.446 core is added back to PAT. It means, compared to last FY end, the company has increased the a/c payables by Rs.446 core. How do a/c payables increase? When more vendors’ invoices are waiting to be paid. More cash stays in the bank and is paid later.
- Other financial liability: Rs.1208 crore is added back to PAT. When the quantum of financial liability increases (like a bank loan), its net result is an increase in cash for the company.
Inference #2
So this is all about cash flow from the company’s operations. If one wants to know how much ‘actual net cash’ is generated by the company’s operations, we need to add all the numbers back to PAT (see the screenshot of the calculation shown below).

Rs.32,369 is the real cash generated by operations. Now it is on the company how they want to use this cash. They can consume it for ‘investing activities’. They can also consume it for ‘financing activities’.
There are companies who may come short in ‘cash generated from operations’. Such companies has the option to generate cash from investing activities (like sale of investments etc) and form financing activities (like issue of new shares, bonds etc).
Net Cash Flow From Investing Activity

Few cash-consuming investing activities
- Bank deposits placed: Rs.7,663 crore worth of new bank deposits have been bought by the company. This also yields ‘interest income’. This is a cash-consuming activity hence shown in negative. Hence it has caused a negative value in cash flow. Out of all cash generated by operations, Rs.7663 crore was used for FD.
- Inter-corporate deposit placed: This is also like FD, but instead of a bank, a company deposit (CD) has been bought. Rs.14,905 worth of new CDs have been purchased. This also yields ‘interest income’. CDs cause a cash out hence a negative value in cash flow. Out of all cash generated by operations, Rs.14905 crore was used by CDs.
- Purchase of investments: Rs.80,002 worth of new investment was cash purchased by the company. Hence it has caused a negative cash flow.
- Purchase of Property Plan & Equipment (CAPEX): This is what is classified as the Capital Expenditure (CAPEX) of the company. While doing a price valuation of a company using DCF, a Capex number is used. The company has spent cash worth Rs.2,538 in Capex for FY ending Mar’20.
Few cash-generating investing activities
- Proceeds from Bank Deposits: Rs.11,965 crore worth of bank deposits was redeemed by the company. This has increased the bank balance of the company by the same value, hence written as a positive number.
- Proceeds from inter-corporate Deposits: Rs.14,432 crore worth of inter-corporate deposits was encashed by the company. This has increased the bank balance of the company by the same value, hence a positive number.
- Redemption of investments: Rs.84,089 worth of investments have been sold by the company. This has increased the bank balance of the company by the same value, hence a positive number.
- Disposal of Capital Assets: Rs.162 crore worth of capital assets has been sold by the company for cash. Hence it caused the cash balance of the company to increase by the same value. Hence a positive number.
- Interest & Dividend received: Rs.3,729 crore and Rs.8 crore cash have been earned by the company on account of interest and dividend respectively. Hence it’s a positive number. [Note: Rs.3,729 Cr, & Rs/8 crore will appear in P&L a/c under the head “Other income”]
Inference
So to check how much net cash generation has been done the by the investing activities of the company, all values are added (see the screenshot shown below).
Generally, a growing company invests a huge amount of money in CAPEX (purchase of property, plant, and equipment). Hence for such a company net cash from investing activity will be mostly negative. Hence, a negative number is not a bad sign. You just have to see which activity is consuming cash.

Net Cash Flow From Financing Activity

- Buy-back of equity shares: Rs.16,000 cash was used by the company to buy back its shares from the market in FY ending Mar’19. Hence this value is shown in negative. If the company issues new shares in the market, the value will be positive. How? By issuing shares, the company generates cash. But when the company is buying back its shares, it is doing the opposite.
- Borrowings (short-term or long-term): A negative Rs.181 crore for Mar’19 means, the company has paid back its loan dues. Had they taken a new loan, the value would have been positive. For the Mar’20, the company has not borrowed any money.
- Dividend Paid (including DDT): Rs.37,634 crore worth of dividends was paid by the company in Mar’20. Hence this value appears as negative. This is a cash-out flow.
- Repayment of lease liabilities: When a company renews its lease (like a long-term rent agreement for office space), it has to pay upfront cash. In this case, Rs.1,062 crore was paid in FY ending Mar’20. Hence this value is shown as negative.
- Interest Paid: Rs.924 is a cost originating on account of interest payment on leases, loans, etc. You will see this cost appearing as “Finance Cost” in operating activities. There it has been shown as a positive number, and in turn, adjusted here as a negative number (Rs.-924 crore) – after the cash out has actually happened.
Net Change in Cash Position

The company has generated extra cash of Rs.1019 crore from its operating, investing and financing activities at the end of Mar’20. This cash number ultimately gets added to the cash position of the company which was at the beginning of Mar’20 (Rs.7,224 crore). As a result, the cash position of the company improves to Rs.8646 core by 31-Mar’20.
The cash position of the company has increased year-on-year. This is the whole crux of doing the business. The company should be able to improve its cash position.
Final Words on Reading The Cash Flow Report
Here is a snapshot of what important things the company did in FY’2020. This is a good example of running a business:
- Operating Activities:
- It generated a PAT of Rs. 32,447 crore.
- Net cash generated from operating activities was Rs.32,369 crore.
- Investing Activities
- Net cash generated from investing activity was Rs.8,565 core.
- This net cash was generated by the redemption of deposits, investments, sale of assets, interest income, dividend income, etc.
- New deposits and investments were also purchased at the same time.
- Financing Activity (where the company used the cash generated from the above two activities)
- A dividend was paid to shareholders amounting to Rs.37,634 crore.
- Lease liability (Rs.1062 crore) and interest payments on loans (Rs.924 core) were also made here.
# 5: Analyzing Financial Reports [In Steps]
Analyzing a company’s fundamentals is a crucial step in making informed decisions about stock purchases. Here’s a step-by-step method to conduct a fundamental analysis using the company’s last five year’s financial reports:
Step 1: Gather Financial Statements
Collect the company’s financial statements for the last five years. That includes the profit & loss account, Balance Sheet, and Cash Flow Statement. Make sure the reports are audited and from reliable sources. If the reports are from the company’s official website or from reputable financial databases, it is better.
Step 2: Review the P&L Account
First, read the P&L accounts as previously discussed in this article. It will provide an overview of the company’s income, expenses, and profitability during a specific period. A five-year data study is good. Key components to review include:
- Revenue (Income): Analyze the company’s revenue trends over the last five years. Look for consistent revenue growth, as it indicates a healthy and expanding business.
- Gross Profit Margin: Calculate the gross profit margin by dividing gross profit by revenue and multiplying by 100. A stable or improving gross profit margin suggests the company efficiently manages its production costs.
- Operating Income: Assess the company’s operating income and operating margin (operating income divided by revenue multiplied by 100) to understand how well it generates profits from its core operations.
- Net Income: Examine the net income to determine the company’s overall profitability after accounting for all expenses and taxes.
Step 3: Study the Balance Sheet
First, read the Balance Sheet as previously discussed in this article. It provides a snapshot of the company’s assets, liabilities, and shareholder’s equity at a specific point in time. An analyst shall focus on the following elements:
- Total Assets: Analyze the trend in total assets over the years. A growing asset base indicates business expansion and potential future growth.
- Total Liabilities: Assess the company’s total liabilities to understand its debt levels and financial obligations.
- Shareholders’ Equity: Calculate shareholders’ equity (Total Assets – Total Debt) to see how much of the company is owned by shareholders. Growing equity based on a time span of 5-10 years is a good health indicator.
- Current Ratio: Calculate the current ratio (Current Assets divided by Current Liabilities) to assess the company’s short-term liquidity. A ratio above 1 indicates sufficient liquidity to meet short-term obligations. Read more about liquidy and solvency analysis here.
Step 4: Evaluate The Cash Flow Statement
The Cash Flow Statement presents how the company generates and uses its cash during a specific period. Focus on the following sections:
- Operating Cash Flow: Analyze the operating cash flow to understand how much cash the company generates from its core operations. Positive and increasing cash flow is a positive sign.
- Cash Flow from Investing: Review the investing cash flow to see how the company is investing in its business (e.g., capital expenditures, acquisitions) or divesting assets (e.g., selling subsidiaries).
- Cash Flow from Financing: Evaluate the financing cash flow to understand the company’s capital structure and how it raises funds (e.g., issuing debt, issuing stock, and dividend payments).
Suggested Reading: What to Look Inside Financial Statements of Companies?
Step 5: Calculate Key Ratios
First, read about the key financial ratios discussed previously in this article. Now, compute important financial ratios after reading the three financial reports as discussed in steps #2, #3, and #4. It will give a deeper understanding of the company’s performance and compare it with industry peers. Some key ratios include:
- Price-to-Earnings (P/E) Ratio
- PEG Ratio
- Price-to-Book (P/B) Ratio
- Debt-to-Equity (D/E) Ratio
- Current Ratio
- Return on Equity (ROE)
- Return on Capital Employed (ROCE)
- Return on Assets (ROA)
- Gross Profit Margin
- Net Profit Margin
Suggested Reading: Learn about financial ratio analysis in detail.
Step 6: Assess Profitability and Growth
Assessing a company’s profitability and growth is a crucial step in fundamental analysis. This step involves analyzing various financial metrics and performance indicators to gauge how well the company generates profits and how it is positioned for future expansion. Here’s a more detailed guide on how to assess profitability and growth:
Profitability & Return
- Profit Margins: Analyze the company’s profit margins, such as the Gross Profit Margin and Net Profit Margin. These margins indicate the company’s ability to manage costs and generate profits. Improving profit margins over time suggest better cost management and increased efficiency.
- Operating Profit and Margin: Assess the company’s operating profit and operating margin. Operating profit represents the profit generated from the core business operations without considering other income. A rising operating margin indicates the company is becoming more efficient at generating profits from its core activities. Do a detailed analysis of the profit margin of companies.
- Return on Equity (ROE): Calculate the Return on Equity (ROE) using the formula: ROE = (Net Income / Shareholders’ Equity) * 100. ROE measures how efficiently the company uses shareholders’ equity to generate profits. A high ROE indicates the company is generating significant returns for its shareholders.
- Return on Assets (ROA): Calculate the Return on Assets (ROA) using the formula: ROA = (Net Income / Total Assets) * 100. ROA evaluates how efficiently the company utilizes its total assets to generate profits. Higher ROA signifies effective asset utilization.
Growth
- Historical Revenue Growth: Review the company’s revenue trends over the last five years. Look for consistent growth in revenue year over year. Steady revenue growth is a positive sign, as it indicates increasing demand for the company’s products or services.
- Earnings per Share (EPS) Growth: Evaluate the growth in earnings per share (EPS) over the last five years. EPS growth is a crucial metric for shareholders as it reflects the company’s ability to generate profits on a per-share basis. Consistent EPS growth is indicative of a financially healthy and shareholder-friendly company.
- Free Cash Flow (FCF) Growth: Analyze the growth in Free Cash Flow (FCF) over the years. FCF represents the cash flow available to the company after covering operating expenses and capital expenditures. Positive and growing FCF indicates the company is generating ample cash to reinvest in the business or distribute to shareholders. Know more about how to calculate FCF.
Other Analysis
- Industry Trends: Assess how the company’s growth compares to broader industry trends. A company may show strong growth, but if the industry is in decline, it might face challenges in the future. Read more about it here.
- External Factors: Take into account external factors that could impact the company’s growth, such as changes in consumer behavior, regulatory changes, or technological disruptions. Read more about it here.
Step 7: Investigate Debt and Liquidity
Assessing a company’s debt levels and liquidity position is critical in fundamental analysis. Debt and liquidity are crucial aspects that can significantly impact a company’s financial health and stability. Here’s a more detailed guide on how to investigate debt and liquidity:
Debt Analysis
- Total Debt: Start by examining the company’s total debt over the last five years. Total debt includes both short-term and long-term obligations, such as bank loans, bonds, and other forms of debt.
- Debt-to-Equity Ratio (D/E): Calculate the Debt-to-Equity ratio using the formula: D/E = Total Debt / Shareholders’ Equity. This ratio assesses the company’s financial leverage or the extent to which it relies on debt financing. A high D/E ratio indicates that the company has taken on significant debt relative to its equity, which may increase financial risk.
- Interest Coverage Ratio: Evaluate the company’s ability to meet interest payments on its debt by calculating the Interest Coverage Ratio. It is calculated as Interest Coverage Ratio = Earnings Before Interest and Taxes (EBIT) / Interest Expense. A higher interest coverage ratio indicates the company has sufficient earnings to cover its interest obligations, which is a positive sign.
- Debt Maturity: Review the maturity profile of the company’s debt. Determine the proportion of short-term debt (due within a year) and long-term debt (due beyond a year). Heavy reliance on short-term debt could pose liquidity risks if the company faces challenges in refinancing.
- Credit Ratings: Check the company’s credit ratings provided by credit rating agencies like Standard & Poor’s, Moody’s, or Fitch. Credit ratings give an indication of the company’s creditworthiness and ability to repay its debts. Higher credit ratings suggest lower default risk.
Liquidity Analysis
- Current Ratio: As mentioned earlier, calculate the Current Ratio using the formula: Current Ratio = Current Assets / Current Liabilities. A ratio above 1 indicates the company can meet its short-term obligations comfortably.
- Quick Ratio (Acid-Test Ratio): Calculate the Quick Ratio using the formula: Quick Ratio = (Current Assets – Inventory) / Current Liabilities. This ratio excludes inventory from current assets since inventory may not be easily converted to cash in case of financial distress. A ratio above 1 is preferable.
- Operating Cash Flow to Debt Ratio: Assess the company’s ability to generate operating cash flow to service its debt by calculating the Operating Cash Flow to Debt Ratio. It is calculated as Operating Cash Flow to Debt Ratio = Operating Cash Flow / Total Debt. A higher ratio suggests the company has enough cash flow to meet its debt obligations.
Step 8: Research Management Quality
Evaluating the company’s management team and understanding its business strategy is a crucial part of fundamental analysis. The effectiveness and competence of the management team can significantly impact a company’s performance and long-term prospects. Here’s a more detailed guide on how to research management and strategy:
The Management
- Management Team Background: Start by researching the background of the key executives and leaders of the company. Look for information about their education, work experience, and track record in the industry. Assess whether the management team has relevant expertise and experience in leading a company in a specific sector.
- Executive Compensation: Review the executive compensation structure to ensure it aligns with shareholders’ interests. Look for companies where executive compensation is linked to performance metrics and long-term shareholder value.
The Management’s Quality
- Corporate Governance: Investigate the company’s corporate governance practices. Check if the company has a diverse and independent board of directors. Independent directors can bring unbiased viewpoints and enhance corporate oversight.
- Management’s Communication: Review the company’s communications with shareholders and stakeholders, including annual reports, earnings calls, and press releases. Transparent and frequent communication is a positive sign, as it indicates management’s commitment to keeping shareholders informed.
- Company’s Mission and Vision: Understand the company’s mission and vision statements. These statements provide insight into the company’s long-term goals and its direction for the future.
- Business Strategy: Analyze the company’s business strategy. Consider how the company plans to achieve its goals, penetrate new markets, and gain a competitive edge. Evaluate whether the strategy aligns with industry trends and macroeconomic conditions.
The Management’s Actions
- Financial Discipline: Evaluate the management team’s financial discipline. Look for signs of prudent financial management, such as maintaining healthy working capital, controlling costs, and avoiding excessive debt.
- Capital Allocation: Investigate the company’s capital allocation decisions. Assess whether the company reinvests profits into profitable projects, pays down debt, repurchases shares, or pays dividends to shareholders.
- Innovation and Adaptability: Consider the company’s approach to innovation and its ability to adapt to changing market conditions. Companies that embrace innovation and stay ahead of industry disruptions are better positioned for long-term success.
- Employee Relations and Culture: Research the company’s employee relations and company culture. A positive work environment and engaged employees can contribute to higher productivity and overall success.
- Executive Compensation: Review the executive compensation structure to ensure it aligns with shareholders’ interests. Look for companies where executive compensation is linked to performance metrics and long-term shareholder value.
- Environmental, Social, and Governance (ESG) Practices: Research the company’s ESG practices and initiatives. Companies that prioritize sustainability and social responsibility may have a positive impact on their reputation and long-term prospects.
- Track Record of Shareholder Returns: Evaluate the company’s historical track record of creating value for shareholders. Look at stock performance, dividend history, and any share buyback programs.
- Risk Management: Investigate how the management team identifies and manages various risks that the company may face, including operational, financial, and strategic risks.
Step 9: Analyze Competitive Advantages
Assessing a company’s competitive advantages, also known as its unique selling points or moats, is a critical aspect of fundamental analysis. Competitive advantages are the attributes that set a company apart from its competitors and allow it to maintain a sustainable and profitable position in the market. Here’s a more detailed guide on how to analyze competitive advantages:
Identify Key Competitive Advantages: Begin by identifying the specific factors that give the company a competitive edge. Common competitive advantages include.
- Brand Recognition: A strong brand with positive consumer perception can lead to customer loyalty and higher pricing power.
- Intellectual Property: Patents, trademarks, and copyrights protect the company’s unique technologies or products from imitation by competitors.
- Economies of Scale: Larger companies may benefit from cost advantages due to bulk purchasing, production efficiencies, and spreading fixed costs over a larger output.
- Cost Leadership: Companies that can produce goods or services at a lower cost than competitors can offer competitive pricing.
- Product Differentiation: Unique features or quality that make the company’s products or services stand out in the market.
- Network Effects: Platforms or products that become more valuable as more users join (e.g., social media platforms, online marketplaces).
- Switching Costs: Products or services that create barriers for customers to switch to competitors due to time, effort, or financial investment.
- Regulatory Barriers: Companies operating in highly regulated industries may have a competitive advantage due to barriers to entry for new entrants.
Step 10: Compare Valuation
Finally, compare the company’s valuation with its historical valuation and that of its competitors. Consider whether the current stock price reflects the company’s fundamentals and growth potential. To more about how to compare valuations, read this article on relative price valuations.
#6. Industry Analysis
- Select an Industry: Choose an industry that interests you and aligns with your investment goals. Start with industries you are familiar with or have a personal interest in.
- Industry Overview: Research the industry’s size, growth rate, and key players. Look for industry reports, financial news, and government publications to gather relevant data.
- Competitive Landscape: Identify major companies operating in the industry and analyze their market share, strengths, and weaknesses. Look for industry leaders and innovative players.
- Industry Trends and Risks: Study recent trends, technological advancements, and regulatory changes impacting the industry. Identify potential risks that could affect companies within the sector.
- Future Outlook: Consider market projections and expert opinions on the industry’s growth prospects. Evaluate how macroeconomic factors may influence the industry in the future.
By following these practical steps, an investor can gain valuable insights into different industries. Remember to start with industries you have some familiarity with. As you gain experience, you can expand your analysis to other sectors. Keep your analysis simple and focus on the key factors that impact the industry’s performance.
#7. Economic Indicators and Macroeconomic Analysis
Economic Indicators:
- Key Indicators: Identify important economic indicators like GDP growth rate, inflation rate, unemployment rate, consumer confidence, and industrial production.
- Industry Impact: Analyze how these indicators may affect the industry in which the company operates.
- Consumer Spending: Monitor consumer spending patterns as it can impact companies in sectors like retail and leisure.
- Business Investment: Assess business investment trends to understand potential growth opportunities.
- Currency and Inflation: Consider how currency fluctuations and inflation can affect companies engaged in international trade and pricing decisions.
Macroeconomic Analysis:
- Interest Rates: Analyze RBI’s bank policies and interest rates to understand their impact on borrowing costs and investment decisions.
- Fiscal Policies: Consider government fiscal policies, such as tax rates and public spending, and how they can affect industries and companies differently.
- Global Economic Trends: Be aware of global economic trends as they can influence domestic companies and industries in India.
- Industry Sensitivity: Understand the industry’s sensitivity to economic cycles, with some industries performing better during expansions and others being defensive during downturns.
By analyzing economic indicators and macroeconomic factors, beginner investors can gain insights. This way, they will better understand the overall economic environment and its potential impact on the companies they are interested in.
#8. Limitations of Fundamental Analysis
One major limitation is the short-term market inefficiencies. In the short term, market sentiment, speculation, and trends can significantly influence stock prices, leading to temporary discrepancies between intrinsic value and market price. Timing the market based solely on fundamental analysis can be challenging. External factors, such as geopolitical events or sudden regulatory changes, can override fundamental indicators, but only in the short term.
Fundamental analysis also has limited predictive power. While it offers insights into a company’s potential, it doesn’t guarantee future performance. Unforeseen events or management decisions can alter a company’s trajectory. Additionally, some industries and sectors are cyclical by nature, making long-term projections challenging.
Psychological biases are another concern. Investors may become emotionally attached to their fundamental analysis, leading to overconfidence or confirmation bias. Thereby, they may ignore contradictory information.
Encouraging a well-rounded approach is essential to overcome these limitations. Integrating technical analysis, sentiment analysis, and considering macroeconomic trends can complement fundamental analysis. Diversifying the investment portfolio across various industries and asset classes can mitigate risks associated with individual stock selection.
Conclusion
Mastering the art of fundamental analysis equips investors with a powerful skillset to navigate the dynamic world of the stock market. By diligently following the steps outlined in this article, individual investors can confidently evaluate the financial health, growth prospects, and intrinsic value of companies on their own.
Armed with a comprehensive understanding of financial statements, key ratios, industry trends, and macroeconomic indicators, investors can make well-informed decisions to build a successful investment portfolio.
However, it is essential to acknowledge that fundamental analysis is not without its limitations. Subjectivity in interpretation, market inefficiencies, and the unpredictable nature of external factors can challenge even the most thorough analyses. As such, a prudent investor should embrace a well-rounded approach, incorporating technical analysis, sentiment analysis, and diversification to strengthen their investment strategy.
Moreover, the journey of a self-reliant fundamental analyst is continuous. Market dynamics change, and companies evolve, requiring ongoing research and adaptation. Regularly staying updated with market news, industry trends, and economic developments will enable investors to remain at the forefront of their stock evaluations.
While the path to becoming a proficient fundamental analyst may seem daunting at first, it has its benefits. Dedication, patience, and a commitment to learning will be rewarded with a deeper appreciation of the market. It enhances the potential of the investor to execute sound investment decisions. Harnessing the power of fundamental analysis, investors can confidently navigate the complex financial landscape. They can unlock the doors to a world of exciting investment opportunities and long-term financial growth.
Have a happy investing.
FAQs
It helps investors determine a stock’s intrinsic value and potential for growth. Understanding fundamentals is crucial as it provides a solid foundation for making informed investment decisions.
Start by learning how to read and interpret financial statements, such as the p&l account , balance sheet, and cash flow statement. Familiarize yourself with financial ratios. One can also utilize a tool like the Stock Engine to get the analysis done using algorithms.
Fundamental analysis has limitations, such as subjectivity, incomplete information, and short-term market inefficiencies. To mitigate these, complement the fundamental analysis with technical analysis. One must also consider macroeconomic trends. It is also necessary to diversify the portfolio to reduce single-stock risk.
Yes, fundamental analysis too like the Stock Engine can identify undervalued stocks. These those stocks that have strong growth prospects but are currently trading below their intrinsic value. By evaluating a company’s financials, market position, and industry trends, investors can uncover hidden gems.
Suggested Reading:


![Compare Indian Banks: A Quick Fundamental Analysis [2023]](https://ourwealthinsights.com/wp-content/uploads/2021/05/Compare-Indian-Banks-Image4.png)

images are not loading on the page