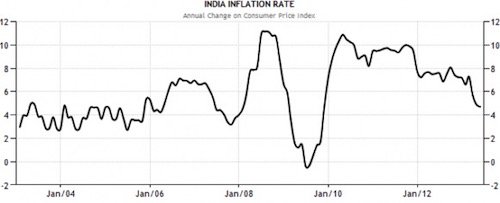
What is the history of inflation in India since last 10-15 years?
The rate of inflation in India is currently hovering around 4 years low levels.
In June’2013 India saw its inflation rate at 4.7%.
If we look at history of inflation in India since year 1969, inflation has averaged around 7.7%.
May be not many will believe but inflation in India peaked in the year Sep-1974 touching the level of 34%.
Stubborn inflation has always been a problem for investors in India. In last decade inflation in India has particularly been stubborn.
The main reason for high inflation is India being a fast developing nation.
High inflation and fast growth often grows hand in hand.
High inflation becomes a problem if investment return is not able to beat it. But India has performed well here.
Simultaneously the rate of inflation in India also bottomed to (-)11% two years after 1974 in year 1976.
In this chart we present you how inflation in India has behaved in year 2013 (Between January & June)
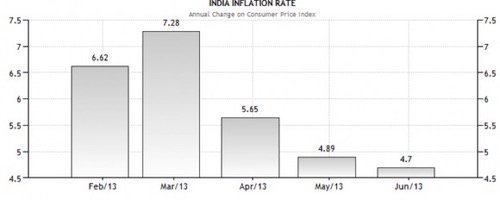
Rate of inflation is nothing but general rise in price of goods and services of a period of time.
In last 45 years (between 1969 to 2013) the rate of inflation has increased on an average 7.7%.
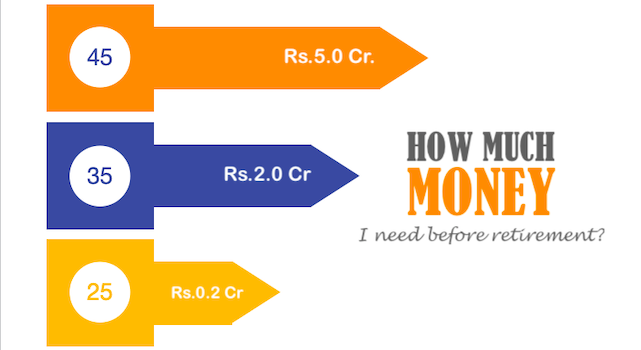
In order to understand the impact of this inflation rate of 7.7% over a period of 45 years let me give you an exemplification.
Purchasing power of $27 back in 1969 was is equivalent to purchasing power of $1000 of today.
Here we present you a graphical presentation of history of inflation in India in last last ten years
This is where intelligent investing becomes so important.
A normal person will be happy if he has made an interest income of 7.99% on average.
But inflation eats your money and if your money in increasing at the same rate as inflation (in this example 7.99%) then it is not sufficient.
If ones objective is to make money grow then investing just for capital protection is not enough.
This is the reason why we must invest in equity linked schemes. Let me give you a graph of how Indian stock market has performed in last 10 years.
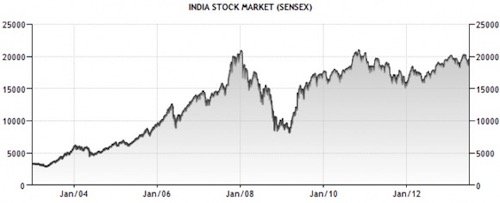
Indian stock market (SENSEX-Bombay Stock Exchange) has increased from 4,500 levels in 2003 to 20,000 levels in 2013.
In last 10 years the SENSEX has grown on an average of 16% per annum. Compare this growth rare with rate of inflation of 7.7%.
If you would have invested your money in Index linked mutual fund in 2003, you would have made your money grow (over inflation) at rate of 8.3% per annum.
This is what I mean by intelligent investing, one must be aware of history of inflation and select/adjust their investment options accordingly.
If average inflation is high, investors must opt for riskier investment options.
But if inflationary pressure is not so much then investing in less risky options will be considered ok.