
GDP is measured in India by estimating GVA of “Individual sectors“.
Before we proceed into further details, lets first know few basics about the following:
- GDP.
- GVA.
- Individual Sectors.
What is GDP? Gross Domestic Product.
GDP is a measure of “total value of goods and services” produced in a country.
What means by total value of goods and services? Sum total of all GVA’s of individual sectors.
GDP = GVA of (Sector 1 + Sector 2….+ Sector n).
What is GVA?
Gross Value Added (GVA). Formula for GVA is:
GVA = Value of Outputs – Value of Inputs.
Note the phrase “Value Added” in GVA. Value is added where? To the Economy of India.
For the sake of understanding, let use an analogy.
GVA is same as “gross profit” of a company.
What is Gross Profit? Total Turnover minus Total Expenses.
Similarly GVA is:
- Value of Outputs (production), minus
- Value of Inputs (expenditure).
If output minus input is a positive number, Value added to the economy is positive (profitable sector).
If output minus input is a negative number, it means the sector is consuming more resources, and producing a less valuable goods/services.
Such a sector is not profitable. It is more like a liability on the economy.
Individual sectors…
For the purpose of GDP estimation, the whole economy of India has been divided into sectors.
Individual performance (GVA’s) of each sector is then recorded.
Sum total of GVA’s of all individual sectors is the GDP of the nation.
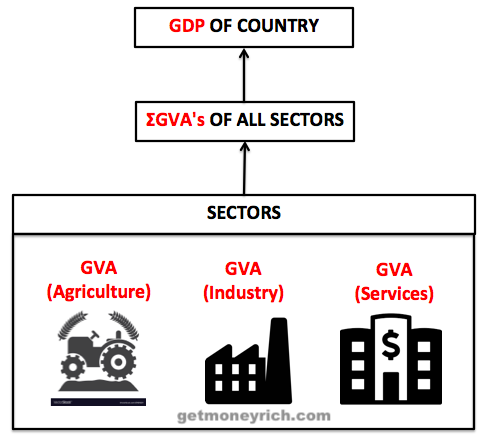
In India, following sectors exists for the purpose of GDP measurement:
| No. | SECTORS |
| 1 | Agriculture, forestry and fishing |
| 2 | INDUSTRY |
| 2.1 | Mining and quarrying |
| 2.2 | Manufacturing |
| 2.3 | Electricity, gas and water supply |
| 2.4 | Construction |
| 2.5 | Trade, hotels and restaurant |
| 3 | SERVICES |
| 3.1 | Transport, storage and communication |
| 3.2 | Trade, hotels and restaurants and Transport, storage and communication |
| 3.3 | Financing, insurance, real estate and business services |
| 3.4 | Community, social and personal services |
Estimation of GVA of Sectors…
There are two approaches used for estimation of GVA of all sectors.
First: Production Approach.
This approach is used for the following sectors:
- Agriculture, forestry and logging, fishing,
- Mining and quarrying,
- Registered manufacturing and
- Construction
Second: Income Approach.
- Un-registered manufacturing
- Electricity, gas and water supply,
- Trade, hotels and restaurants, transport, storage, communication,
- Banking and insurance, real estate, ownership of dwellings, business services,
- Public administration and defence and other services
Further Break-up of the sectors…
All sectors listed above are further classified into following categories:
- Public Sector.
- Organised Manufacturing Sector.
- Un-organised Sector.
This categorisation is done for clear “identification of source”, from where data collection must be done for GVA/GDP compilation. How?
Public Sector:
“Budget documents and annual reports” of various industries are studied to arrive at an estimate.
Organised Manufacturing Sector:
“Data from the Annual Survey of Industries” are used to arrive at an estimate.
Un-organised Sector:
Here the estimate of GDP is compiled for the base year first.
In cases, instead of base year, bench market survey year is also taken as reference.
Once the estimate of base year is done, the next step is to “add factors” to base year to arrive at the next year estimate.
On what basis the factors are added? Based of thumb rules generated from “appropriate physical indicators”.
#1. GVA Estimation of Agriculture and Livestock.
GVA = Value of Outputs – Value of Inputs
What are the outputs of this sector?
- Crops – Principal, minor and miscellaneous.
- By-products.
- Other products.
- Milk, eggs and wool.
- Meat, cattle hides, goat skins, dung…
- Other livestock products
How value of output is calculated? By estimating value of all these items produced.
Production x Price.
What are the inputs for this sector?
- Seed pesticides, electricity, chemical fertilisers, and organic manure
- Irrigation charges.
- Repair and maintenance,
- Diesel Oil
- Market charges
- Feed of livestock.
How value of output is calculated? By making rough estimates on basis statistical datas.
#2. GVA Estimation of Forestry and logging & Fishing.
GVA = Value of Outputs – Value of Inputs
What are the outputs of this sector?
- Production of forest products.
- Production of Fuel wood.
- Production of Marine and inland fish,
- Subsistence fishing,
- Fish curing
How value of output is calculated? By estimating value of all these items produced.
Production x Price.
How input value for this sector is estimated?
By using a thumb rule of 10% of total value of output.
For Fishing, the values are as below:
- 22.5 % of value of output for marine fish,
- 10 % for inland fish and,
- 1 % for drying of fish.
#3. GVA Estimation of Mining and Quarrying.
GVA = Value of Outputs – Value of Inputs
What are the outputs of this sector?
- Production of Coal and lignite.
- Production of Crude Petroleum and natural gas.
- Production of Minerals
How value of output is calculated?
For coal, annual reports are referred.
For other items, price of production is considered
Total production x price
How input value for this sector is estimated?
Cost estimates are taken from the Office of Coal Controller and Neyveli Lignite Corporation and State Geological Departments.
#4. GVA Estimation of Manufacturing.
GVA = Value of Outputs – Value of Inputs.
How output and input value for this sector is estimated? Data is collected from the following agencies/reports:
- Annual Survey of Industries.
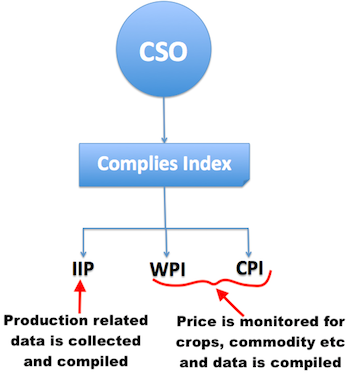
- Index of Industrial Production (IIP).
- Wholesale Price Index (WPI).
These are few examples of how G.O.I collects, and prepares the GVA estimates for each sector.
A detailed write-up of GDP estimation methodology has been provided in the website of CSO.
Summary of how GDP is measured in India…
The first step in GDP measurement is “data collection”.
Who collects the data? CSO.
CSO (Central Statistics Office) is a government of India enterprise, whose main responsibility is co-ordination of statistical activities in India.
What CSO does?
Based on the above data collection, CSO then prepared the GDP report.
How CSO Reports The GDP Data?
On Feb’2018, CSO, working under the The Ministry of Statistics & Program Implementation, published a report.
What was the report about? Quarterly estimates of GDP for Q3 (2017-18).
Such reports are published every quarter by the CSO.
On the first page itself, what we can see is the below table:
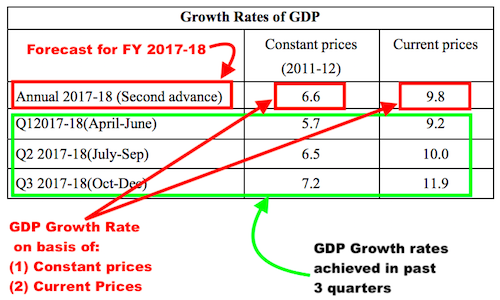
Important to note in the above table is, there are two values for GDP growth rate.
- GDP Growth Rate (Constant Prices): 6.6%
- GDP Growth Rate (Current Prices): 9.8%
What’s normally reported in media is “Constant Prices” numbers.
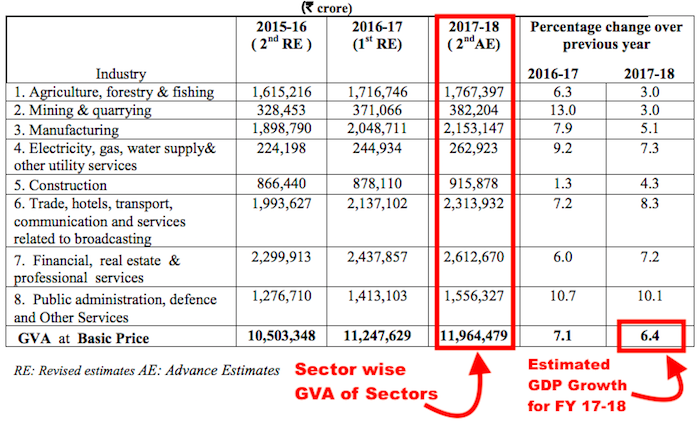
In the same report, a detailed sector-wise break of GVA & its growth rate is also reported.
This break-up is very interesting. How? It highlights performance of individual sectors compared to others.
The above GDP calculation method is called “GDP at Factor Cost“.
In CSO’s reporting, GDP is also measured by another method.
This method is called “Final Expenditures of GDP“.
By this method, the GDP of India for FY 2017-18 (three quarters) looks like this:
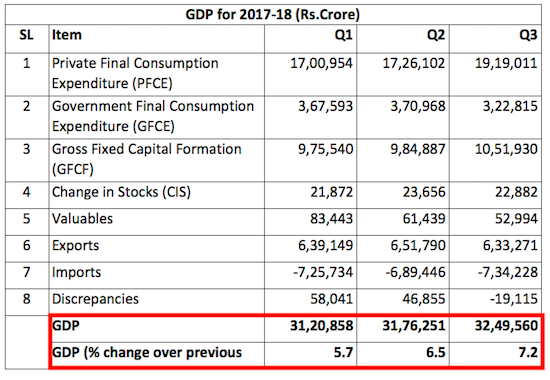
What is interesting to see in above table are the following 2 numbers:
- Domestic Consumption (PFCE): Rs.19,19,011 Crore.
- GDP: Rs.32,47,560 Crore.
What’s interesting in these numbers?
Domestic consumption contributes 59% to the total GDP of India.
This is what makes India’s GDP so self-sufficient.
Exports contributes only 19.5% (633271/3249560) to the overall GDP.
Though 19.5% is not a small value, but we can see it from 2 perspective:
- Scope of improvement (grow exports, and GDP will rise further).
- India’s GDP is not dependent a lot on Exports.
This helps India in times of work economic crisis like 2008-09, Brexit etc.
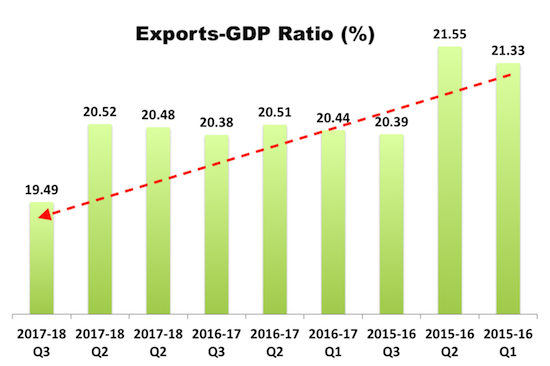
Lets see how GDP of India has been dependent on Exports in 8 quarters.
| SL | Quarters | Exports | GDP | Export/GDP (%) |
| 1 | 2017-18 Q3 | 633271 | 3249560 | 19.49 |
| 2 | 2017-18 Q2 | 651790 | 3176251 | 20.52 |
| 3 | 2017-18 Q2 | 639149 | 3120859 | 20.48 |
| 4 | 2016-17 Q3 | 617872 | 3032091 | 20.38 |
| 5 | 2016-17 Q2 | 612021 | 2983537 | 20.51 |
| 6 | 2016-17 Q1 | 603715 | 2953421 | 20.44 |
| 7 | 2015-16 Q3 | 579000 | 2840003 | 20.39 |
| 8 | 2015-16 Q2 | 597409 | 2772266 | 21.55 |
| 9 | 2015-16 Q1 | 582778 | 2732125 | 21.33 |


Why print option removed?