We’ve built an Excel-based tool that can analyze stocks. But how beginners can calculate the intrinsic value in excel on their own? In this article, I’ll discuss a procedure to do it. It is simple, and even beginners can practice it.
There are limitations of estimating intrinsic value using this method. But experts say that using some valuation method is better than investing blindly in stocks. Over the years, I’ve learned other, more detailed mathematical models of stock valuation. But I’ve not stopped using it.
This method to calculate the intrinsic value in excel is suitable for beginners. Why? Because its calculations are straightforward.
The Concept Used
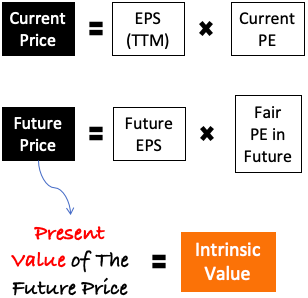
Multiplying the current EPS with the current PE ratio gives us the price. This formula is simple. Now suppose, somehow we knew the EPS and PE ratio of the stock after 10-years from now. In this case, we will also know the future stock’s price.
Now, calculating the present value of future prices will give us the intrinsic value.
If the calculated present value is higher than the current price, the stock is undervalued.
The Intrinsic Value Formula
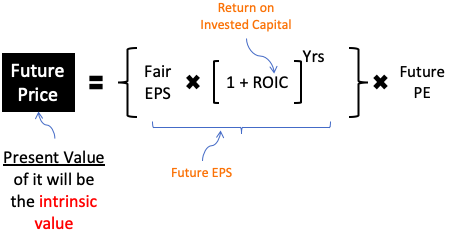
There are mainly two main parts of the intrinsic value formula. The first part deals with the future EPS, and the second part deals with the future PE ratio.
In this formula, there are three main components.
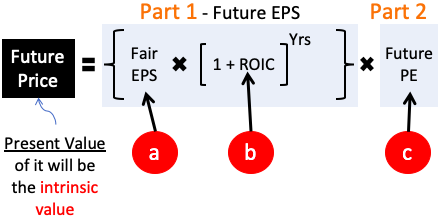
#a. Fair EPS
Here will learn how to estimate the fair EPS of a company. First record the last 10-Yrs EPS of the company. I’ve recorded it for an example company in an excel sheet, and a chart is also plotted. It will give a better understanding of the EPS trend.
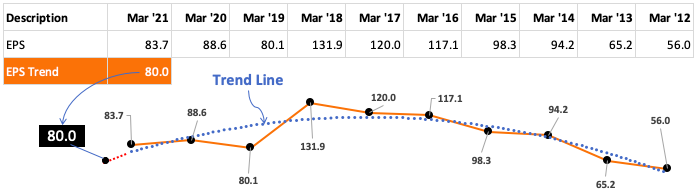
To get a visual feel of the EPS trend, make sure to draw the trend line in the chart. The trend line will show the EPSs trend in the last 10-years. In the above example, you can see that the 10-Yr EPS trend is sloping downwards.
The downtrend in EPS will ask us to lower our EPS estimates. Hence, following the trend, I’ve assumed a corrected base EPS of Rs.80 for our example. It is the “fair EPS” of our intrinsic value formula shown above.
#b. ROIC
We will assume that the Fair EPS estimated above will grow at a specific growth rate in times to come (10 Years). What will be the growth rate for the EPS? It will be equivalent to the Return on Invested Capital (ROIC) of the company.
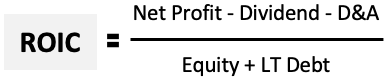
The formula for ROIC calculation is as seen below:
I’ve recorded the required numbers for our example company in Excel. We’ll use these numbers to calculate ROIC. A chart for the ROIC is also needed. It will give a good understanding of the ROIC trend. If ROIC is increasing or decreasing will adjust the value accordingly before putting it in our formula.
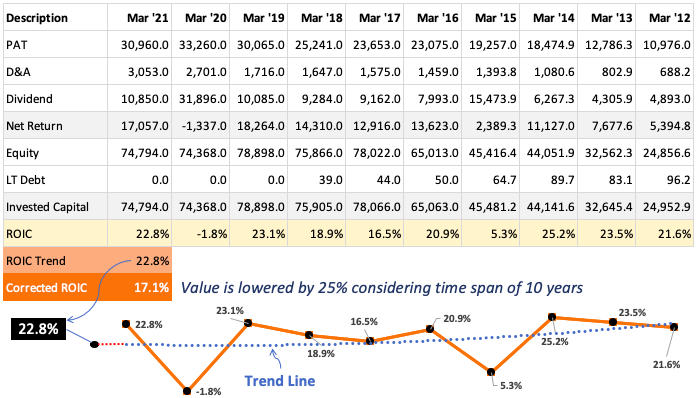
Again, important here is to note the ROICs trend line. From the trend, it looks like the value of 22.8% is a stable number. Hence I’ve considered it for the calculation.
But before putting the number in the formula, we must correct the value.
Why correction is required?
Because the ROIC number is used as a growth rate of EPS for the next ten years. When we see so far ahead in the future, errors can creep in. Hence we must not be too optimistic. Using a lower number than what the trend is suggesting will be better. That is why I’ve used a correction factor of 25%.
ROIC For The Formula = ROIC Trend * (1 – 25%) = 17.1%
#c. Future PE
Forecasting future PE is not easy. To do it, we must first review the above two numbers (EPS and ROIC). A company with rising EPS and a high ROIC can continue to maintain or even improve its PE.
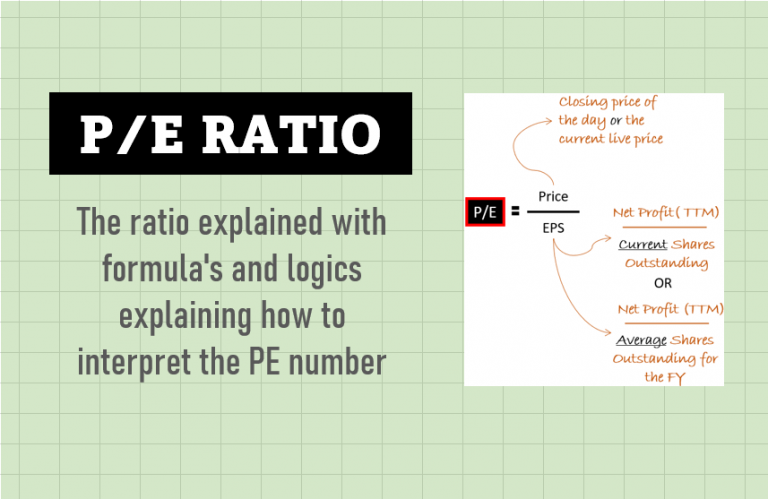
Here again, we will try to establish the PE trend. To do it, we will record the EPS of the last ten quarters. We will also record the share prices on the date of reporting of the quarterly numbers. These two values will help us to calculate the P/E ratio.
The formula for PE = Price / [EPS (Q1+Q2+Q3+Q4)]
I’ve done these calculations for our example company. Check the below snapshot.
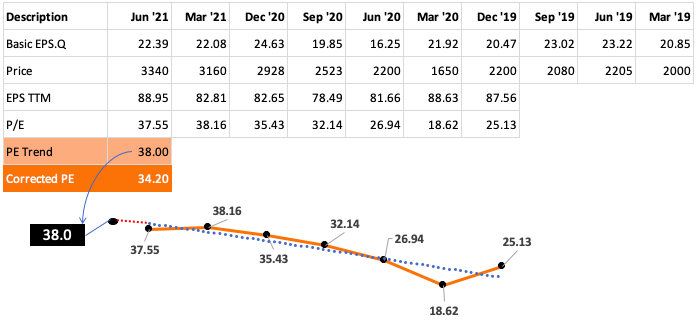
In the last seven quarters, the PE ratio of the company is calculated. The trend curve of the PE is also plotted. It is showing a rising trend. Hence, as per the trend pattern, assuming a PE of 38 looks fair.
But we must apply the correction factor. Why? Because we are assuming that this PE will continue to remain the same after 10-years from now. As the time is so far ahead in the future, I’ll suggest a correction factor of 10%.
As I’m conversant with this example company, hence I’ve considered a smaller correction factor. For less known companies, I prefer a correction factor of 20% or higher.
PE For The Formula = PE Trend * (1 – 10%) = 34.2
Final Calculation
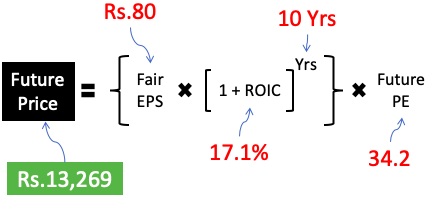
We have calculated the following three components of our intrinsic value formula:
- #a. Fair EPS = Rs.80 / share.
- #b. ROIC = 17.1%
- #c. Future PE = 34.2
Now, we will put these values in our future price formula. The final price comes out to be Rs.13,269. But this is not the intrinsic value. We will have to calculate the present value of it by using a suitable discount rate.
The present value calculation can be done in excel using the below formula. The components of the excel formula are below:
- rate = It is the assumed discount rate (in per annum).
- nper = It is the time horizon (in years)
- pmt = leave it blank
- [fv] = It is the future price we’ve calculated (in Rupees)
- [type] = leave it blank
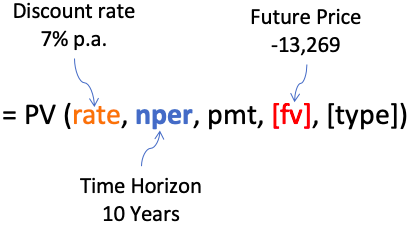
I’m assuming a discount rate of 7% per annum. Why? It is my risk-free rate. Suppose we do not buy this stock, and we buy a bank deposit. Banks are offering a 7% rate of return on a fixed deposit scheme. What does it mean? It means I’ll earn an assured return of 7% per annum even if I’m not investing in stocks. Hence, I can take it as my discount rate.
It is always better to keep a margin of safety (MOS) on our calculated intrinsic value numbers. In this case, I’m keeping it as 15%. Why only 15%? Because I know about the company’s business and its management. For lesser-known companies, I prefer a margin of safety (MOS) of 35%.
Adjusted Intrinsic Value = Calculate Intrinsic Value * (1 – MOS)
In our example, the intrinsic value comes out to be Rs.5,733. It is after applying the margin of safety. The current price of this share is Rs.3,950. As the estimated intrinsic value is higher than the current price, hence it is undervalued.
Conclusion
Beginners can use this formula to calculate the intrinsic value in excel. As it is easy to understand the concept, hence it is suitable for newbies. ROIC estimation is most critical. I will never overestimate this number.
EPS is also critical. It is especially true for companies whose EPS is random as it does not follow a pattern. I generally go with a higher correction factor and margin of safety for such companies.


Thank you
By using the formula i am getting 11218. discounting by 15% i get 9534 .Unable to find the error.
Future Price Formula = 80*(1+17.1%)^(10)*34.2 = 13,264.32
PV Formula = PV(7%,10,,-13264.3216,) = 6,742.91
Applying MOS @15% = 6742.91*(1-15%) = 5,731.47
Hi, How was the value of the ROIC trend and EPS trend plotted and determined?