
What is Return on Equity (ROE)? It is a financial ratio that is calculated by dividing net profit (PAT) by the total shareholder’s funds (Net Worth – NW) of a company. ROE is the measure of the company’s efficiency that highlights how well the company is using shareholder capital to yield net profits. A list of high ROE and high ROIC stocks.
Suppose there are two companies with a net profit of Rs.5 Crore. The first company used Rs.50 of shareholders’ capital to generate those profits. The second company has used only Rs.40 crore of shareholders’ capital. This way, the ROE of both companies will be 10% and 12.5% respectively.
Though the two companies are making the same profits, they cannot be treated as equals. The second company is more efficient in utilizing the shareholders’ capital, hence it gains an edge.
But only a high ROE number is not enough to brand a company as good. We’ll read more about it in this article. But before that, we’ll look at a few basics of ROE.
Return on Equity (ROE) – Calculation
The formula of ROE is simple.
ROE = Net Profit / Shareholders’ Capital
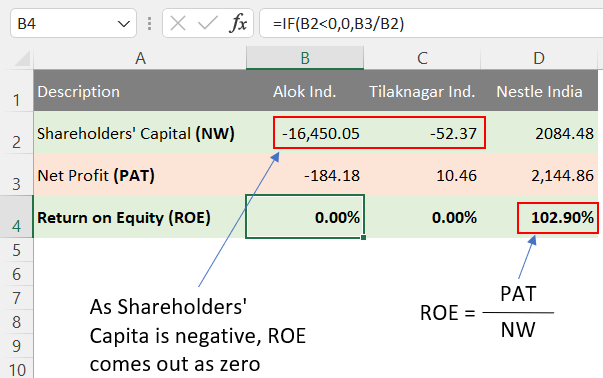
ROE can be calculated for any company. There is only one limitation, the shareholders’ capital (NW) must not be negative. It is an important consideration while calculating the Return on Equity (ROE) of a company. Why? To understand this, we’ll use two simple examples:
- #1. PAT is positive, NW is Negative: A company has reported a PAT of Rs.893.17 Crore. Its net worth (NW) is Rs.-84.7 Crore. If we use the above formula as it is, its ROE will come out as -1054.5%. Considering that the ROE is negative, a first-timer might conclude that it is a loss-making company. But in reality, the company has made profits in the current FY.
- #2. PAT is negative, NW is Negative: A company has reported a PAT of Rs.-1215 Crore. Its net worth (NW) is Rs.-18490.88 Crore. If we use the above formula as it is, its ROE will be 6.57%. Considering that the computed ROE is positive but low, the analyst might assume it to be a non-lossmaking but low-profitable company. But the fact is not what’s being shown by the ROE number.
So, how we can handle these kinds of anomalies while calculating Return on Equity (ROE)? The solution is simple. In all cases where the denominator (shareholders’ capital) is negative, we can assume ROE as zero.
Here are numbers from three real-life companies and ROE calculations for each of them.
The following variations are common in the ROE calculations:
- Preferential Dividend: In case the company has issued preferential shares in the past, the net profit number will be net of dividends to these preferential shareholders.
- Average Shareholders’ Capital: The denominator can also be an average of the value at the beginning and end of a financial year.
- PAT TTM: It is better to use the trailing twelve-month (TTM) PAT numbers. Hence, using the quarterly report to get the last four quarter’s PAT numbers will yield an updated ROE percentage.
An Example of ROE Calculation based on TTM data of PAT and Shareholders’ Capital
If we are using TTM numbers, it is also necessary to pick the PAT and Shareholders’ capital data of the same period. For example, if PAT is for the last 12 months then shareholders’ capital shall also be of the same 12-month period. But it is easier said than done, it makes a simple ROE calculation complicated. This is the reason why I avoid it in my Stock Screener’s calculation. But I’ll explain it anyway here. Please look at the calculations done based on the TTM data of PAT and Shareholders’ Capital.
[P.Note: Our example company has January to December as its Financial Year (FY)]
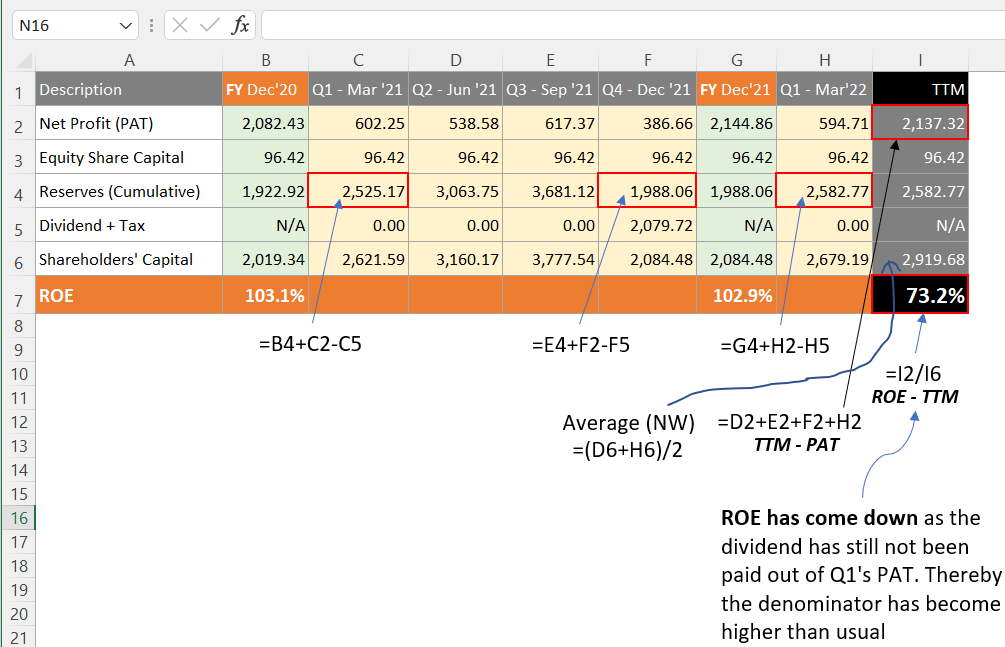
- Net Profit (PAT) – It is calculated for the periods Jun’21, Sep’21, Dec’21, and Mar’22. Adding the reported PAT for these four quarters gives is the PAT-TTM of Rs.2,137.32 Crore.
- Share Capital – For our example company, it has remained the same at Rs.96.42 Crore levels for the period between Jun’21 and Mar’22.
- Reserves – On FY ending Dec’21, the company reported a cumulative Reserve of Rs.1988.06 Crore. In the quarter ending Mar’22, the company reported a net profit of Rs.594.71 Crore. As no dividend is paid in the quarter, the cumulative Reserve will now grow to Rs.2,582.77 Crore.
- Shareholders’ Capital – Here our reference period is between quarters Jun’21 and Mar’22. The starting and ending shareholders’ capital is Rs.3,160.17 and 2,679.19 crores respectively. The average of these two periods will be Rs.2,919.68 crore.
- ROE-TTM – The return on capital for the period will be 73.2% (=2137.32/2919.68). Please note that the ROE has come down compared to the FY Dec’21 report. It has happened because the dividend on the quarter one ending Mar’22 has still not been paid. Thereby, the denominator (Shareholders’ Capital) number has increased, reducing the ROE percentage by more than usual.
How to judge if the calculated ROE is High or Low?
There are no thumb rules related to ROE being high or low. The value can be analyzed based on relative valuation only. But it is also important to compare ROE between comparable companies only. If we compare the ROE of a cement company with a software company, the former will only look bad. Check the example shown below. Company B2 is a cement company. When I compare its ROE of 16.03 with other software companies, it looks terrible.
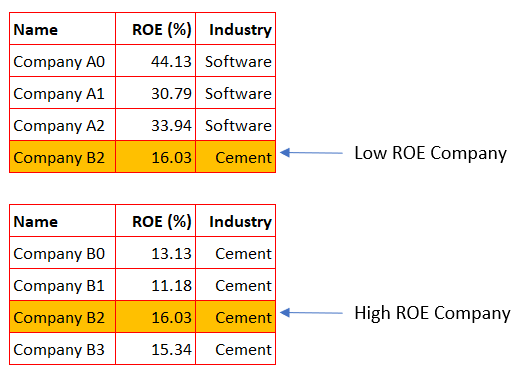
But to judge if a company is good or bad, we must compare apples to apples. Hence, I again compared Company B2 with its peer cement companies. I was surprised to find that within its industry, it had one of the highest ROEs.
A reliable ROE that can be compared with a company’s ROE will be the industry’s average ROE. To take our example of Software and Cement companies forward, let me present to you the average ROE of these two industries and a few more.
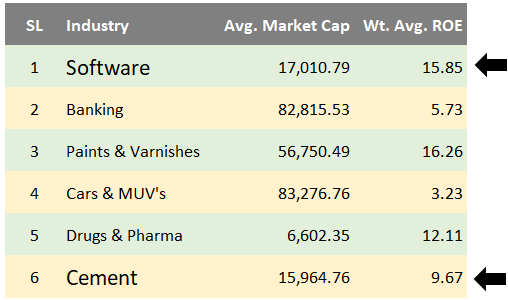
A company whose ROE is above its industry average can be said to be good. You can see that the ROE of Company B2 (16.03) is well above its industry average of 9.67. A more reliable metric will be to compare the ROE number which is an average of the last 3 or 5 years. A company that has kept its 5-year average ROE above its industry average is more reliable.
A high ROE percentage is a strong indicator of the company’s quality of management. Investors can view such a company as a better profit generator than their peers.
If one wants to remember just one number (for the sake of remembering it as a rule of thumb) for the ROE, then here are the statistics. I’ve analyzed the 5-year Return on Equity (ROE) of the top 500 companies listed on the BSE. The average ROE of these 500 number companies looks like this.
| Mean ROE 5-Year | 13.54 |
| Median ROE 5-Year | 15.95 |
From an analysis point of view, I consider median values as more reliable.
ROE of Industries in India
You can also get a list of average ROEs of about 185 number industries. Check the below table. These ROEs are calculated based on ROE data of about 2,000+ number stocks.
(Updated: 09-May-2022)
| SL | Industry | Avg. Market Cap | Wt. Avg. ROE |
| 1 | Oil Refineries & Marketing | 2,87,706.46 | 13.68 |
| 2 | Software | 17,010.79 | 15.85 |
| 3 | Banking | 82,815.53 | 5.73 |
| 4 | Household & Personal Products | 53,871.49 | 20.59 |
| 5 | Tobacco Products | 67,483.25 | 14.26 |
| 6 | Electricity Distribution | 1,23,113.88 | 15.03 |
| 7 | Paints & Varnishes | 56,750.49 | 16.26 |
| 8 | Cars & Multi Utility Vehicles | 83,276.76 | 3.23 |
| 9 | Drugs & Pharma | 6,602.35 | 12.11 |
| 10 | Cement | 15,964.76 | 9.67 |
Return on Equity (ROE) and Growth Rate
There is a concept called Sustainable Growth Rate (SGR). Return on Equity (ROE) is the basis on which one can estimate the SGR of a company. I’ve written an article on the topic. Please visit the provided link to learn more about it. It will be worth a read, as it explains how ROE can be used to interpret the growth potential of a company. I’ve also used the concept of SGR in my Stock Screener.
In terms of formula, SGR looks like this:
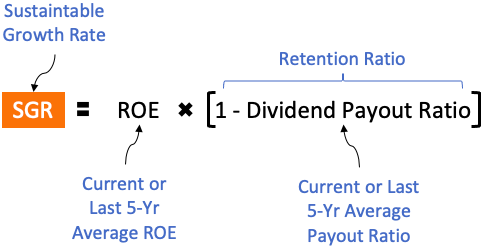
Let me briefly touch upon the SGR concept in this article. What is SGR? It is an estimated rate at which a company can grow using its capital base. What is a company’s capital base? The accumulated shareholders’ capital is the company’s funds. Let me explain it with an example.
These are two companies listed in our stock market. Both are companies operating in the Software Industry. Both companies have a similar ROE number (around 26%). However, their dividend payout ratios are different. This will make their sustainable growth rates (SGR) different. Check the below table.
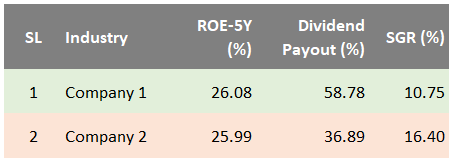
As shown in the above table, SGR for company-1 and company-2 is 10.75% [26.08 x (1-58.78%)] and 16.40% [25.99 x (1-36.89%)] respectively.
How we can use the ROE number to evaluate stock price? A preliminary level price valuation can be done using the Return on Equity number (ROE) and the SGR. How to do it?
- #1. The first step will be to convert the five-year average ROE into SGR using the formula shown above.
- #2. The second step will be to calculate the stock’s price growth for the last 5 years.
- #3. The third step will be a price and SGR comparison. If the stock’s price growth rate is higher than the calculated SGR, it is a sign that the price may be trading at overvalued levels. But it may also mean that other factors are enabling the faster growth rate. If the price growth is slower, further analysis is necessary to find the cause of it.
Why high ROE is not always good
Investing in stocks by referring only to a standalone Return on Equity (ROE) number is not advisable. Why? Because sometimes even a fundamentally weak company can yield a high ROE. There can be two such cases where the company has reported a high ROE but its fundamentals are weak. Let me explain it using real-life examples.
Example: Losses and Depleting Shareholders’ Capital
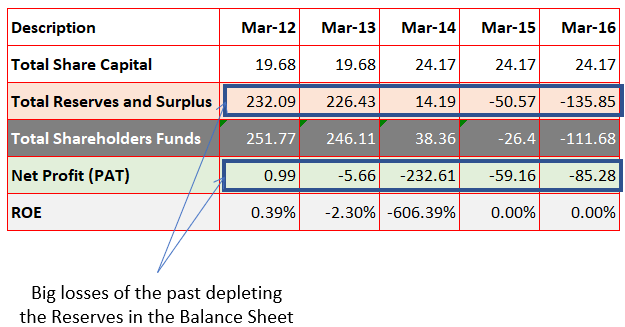
This is an example of a company that has reported huge losses in the years Mar’13 to Mar’16. The losses were so big that during the period its Reserves shrunk from Rs.232.09 crores to Rs.-135.85 Crore.
From Mar’17 onwards, the company again started booking profits.

The profits of Mar’17 to Mar’20 brought the Reserves back to positive. The reported Reserves of Mar’20 were a small Rs.8.47 Crore. In the same FY, the company reported a net profit (PAT) of Rs.35.7 Crore.
The calculated ROE of the company for the FY Mar’20 will be 421.49%. As the number in the denominator (Shareholders’ Capital) is so small compared to the numerator (PAT), the ROE becomes dramatically high.
For untrained eyes, such a high ROE figure can mislead them into believing that it is a good company. But in reality, these are types of must-avoid stocks.
Example: High Debt Dependency
This is an example of a company that has already depleted its Reserves (past losses). As a result, the weight of equity in the balance sheet is low. What does such a company does to manage its operating requirements? It will borrow money from the banks.

Out of the total capital, our example company had sourced about 65% to 85% of it from debt financing. Considering its weak equity base (negative reserves), maintaining a debt-to-equity ratio between 1.23 and 5.82 makes it fundamentally vulnerable.
What does this type of balance sheet tell about the company? The quality of profit generated by the company is weak. Why? Because the majority of its profit is debt-financed.
In Mar’20 the company reported a net profit of Rs.16.84 Crores. As its equity base was very light, the completed ROE of Mar’20 comes out as 48.43%. This is an excellent standalone ROE number. But the company’s balance sheet is too weak and risky for investment consideration.
These are a couple of examples that prove that a standalone Return on Equity (ROE) number can lead to wrong conclusions. So what is the solution? We must read two ratios in unison.
ROE and ROIC
A combination of ROE and ROIC (Return on Invested Capital) is good for analysis. ROE is a measure of how much net profit the company is generating using shareholders’ capital as a base. But a company can also artificially inflate its ROE by resorting to excess debt. Such companies are too risky for investment. What is the alternative analysis? We can use a combination of two ratios to avoid falling into the high ROE trap. The second ratio is ROIC.
I’ve written a detailed article on ROIC. I’ll suggest reading that article as well. It will certainly improve the understanding of the reader about the capital efficiency of companies.
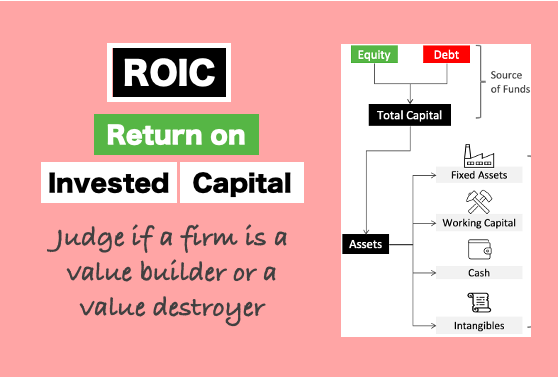
In the ROIC analysis, the efficiency scrutiny is done based on the total invested capital. Unlike ROE where only the equity component is taken for analysis, the spectrum of the invested capital is much wider. Hence, a combination of high ROE and ROIC numbers will suggest that both equity and debt are yielding good returns.
List of High ROE and High ROIC Stocks
(Updated: 01-June-2024)
| SL | Name | Industry | Price | Market Cap(Cr) | ROE (%) | ROIC (5Y) % | GMR Score |
| 1 | CIGNITITEC:[534758] | Software | 1,313.85 | 3,595.42 | 31.85 | 27.18 | 58.69 |
| 2 | TANLA:[532790] | Software | 918.05 | 12,344.09 | 35.48 | 23.81 | 57.91 |
| 3 | ZENTEC:[533339] | Others | 965.25 | 8,061.53 | 53.65 | 11.62 | 49.26 |
| 4 | NHPC:[533098] | Electricity Generation | 107.10 | 1,07,603.58 | 10.40 | 2.97 | 48.50 |
| 5 | TCI:[532349] | Road Transport | 836.85 | 6,514.76 | 17.75 | 9.69 | 47.94 |
DuPont Analysis – Three Components of ROE
In the DuPont analysis, the ROE formula is broken down into three components. The first two components are efficiency parameters and the third is a measure of financial leverage. Looking deeply into these three components of ROE tells a lot more about the business than a standalone ROE number.
Let me show the three components of ROE using DuPont Analysis:
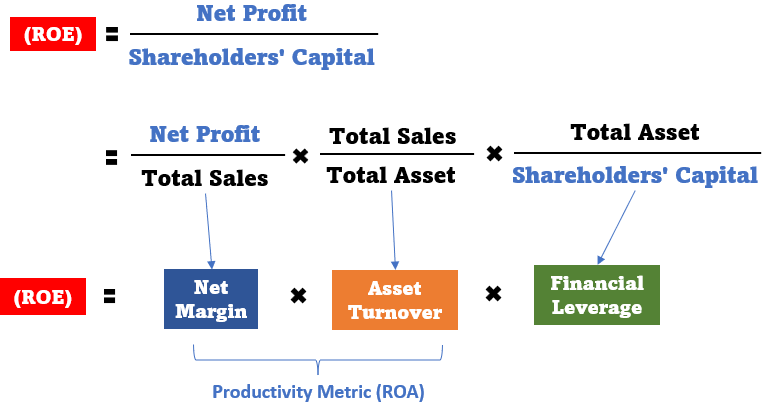
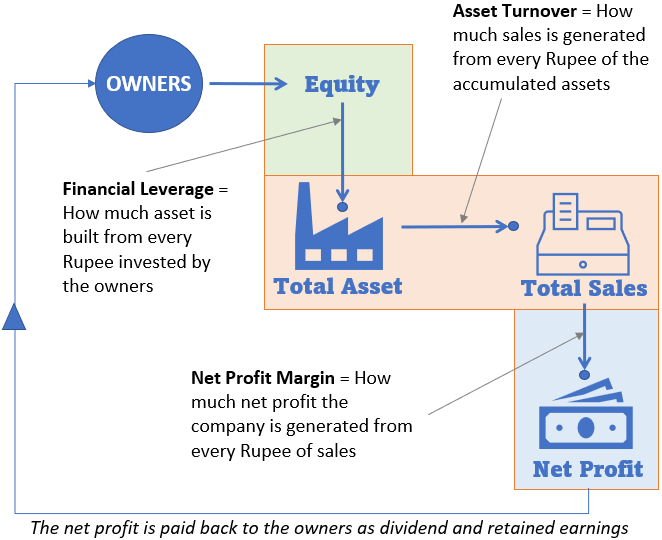
The three components of ROE are Net Margin, Asset Turnover, and Financial Leverage. As the formulas indicate, net margin measures how much net profit the company is generating for every Rupee of sale. Similarly, asset turnover is a measure of how much sales the company is generating for every Rupee of the accumulated assets. The financial leverage measures the size of total assets built for every Rupee invested by the shareholders.
The parameters used in the DuPont formula are not picked randomly. Each component provides us a snapshot of how the business is built and operated. The same has been explained using the infographics shown below.
We can use the DuPont formula to judge the quality of ROE of a company. Two companies may have similar ROEs, but their fundamentals may differ. This type of in-depth view is possible when we compare the ROE of a company based on its three components. Let me show you an example.
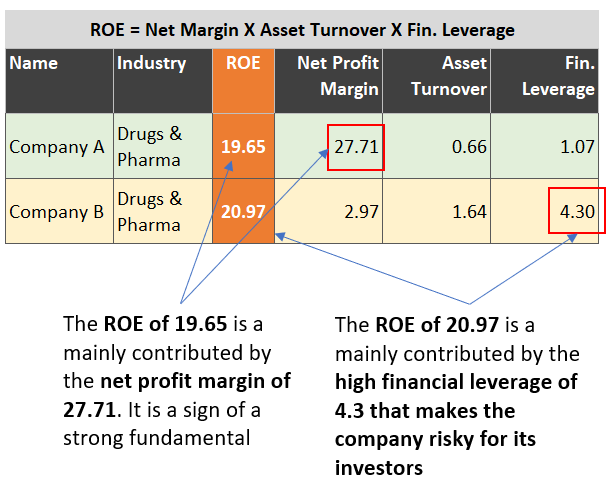
In this example, I’ve taken two companies from the Drug & Pharma industry. Both the companies had similar ROE percentages. So on the first look, both looked equally good because the ROE of about 20 is good for the said industry. But the lookout about one completely changed when I broke the ROE into its three components.
Company A’s ROE of 19.65 was more derived from its high net profit margin of 27.71%. But Company B’s ROE of 20.97 was completely dependent on its financial leverage. The high leverage number indicated that the company is mostly debt-financed. Hence, investing in such a company becomes risky for a shareholder.
Conclusion
Return on Equity (ROE) is a critical financial metric that investors can use to gauge the capital efficiency of companies. ROE is also a strong indicator of the quality of management. Management that cares for its shareholders will try to improve its ROE levels in long term. The higher the ROE number the better. But we must not make the mistake of comparing ROEs of different sectors/Industries.
It is also critical to understand that referring to standalone ROE numbers can be misleading. So what is the solution? In this article, I’ve suggested two additional metrics that must be referred to in addition to ROE. The first metric is ROIC and the second is the DuPont analysis.
Have a happy investing.
Thank you for this insight. I was looking all around and finally landed here .
Thanks AD
Excellent website with block diagrams of formulas which makes things easy to understand. As you have said that different industries are suited to different ratios like PE, PB, ROE, ROA, ROCE, ROIC, EV/EBITDA, etc. So can you please make a webpage showing which set of ratios are better suited to which of the 184 industries, like a ratio rank for each industry. This will prioritize the ratios which should be seen 1st & save a lot of time in doing fundamental analysis of 100s of large/medium/small cap stocks. Thanks & regards.
Excellent article.