
Let’s start with the most basic question. Why compare two mutual funds? It’s done to know which fund is better for investing. But such a comparative method is effective? If one knows the vital parameters for comparison, it can be more effective.
In fact, unlike stock analysis, a detailed fundamental analysis of mutual funds is not possible. Hence, a comparison between similar mutual funds can lead us to the best conclusion.
With this idea in mind, we have developed a web version of our mutual fund comparison tool. Earlier, we used to offer this tool as an Excel product. But the advent of a free web version will enhance its coverage and usability.
When do we compare mutual funds? Generally, we do it when we are researching an investment option. At this time, if we have decided to put our money through a mutual fund, then we would like to do it in the best fund. Mutual fund comparison is an exercise to pick the best mutual fund within our favoured schemes.
Suppose you have picked two equity-based funds for investing. The first is the Axis Bluechip Fund, and the second is the SBI Focused Equity Fund. How to know, out of the two, which is better? It can be known by using our “compare mutual funds tool.”
Example of Comparison
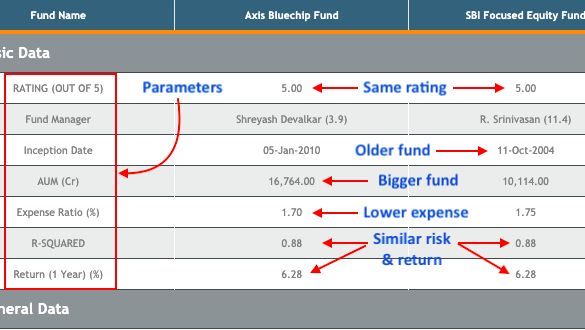
In the screenshot of our mutual fund comparison tool, we can see that in addition to returns, there are other comparison parameters. One can also compare Mutual funds in terms of its rating, asset size, expense ratio, risk, etc.
Just for example sake, the Axis Bluechip Fund and SBI Focused Equity Fund has a similar Rating (5 Star) and 1 Year Return numbers (6.28%). Hence, on the face of it, both funds will look the same to a novice eye.
But the person who is using this compare mutual funds tool will note the other differences. In terms of the age of the fund (see inception date), SBI’s fund is older. Hence has an edge.
But in terms of size of fund (see AUM) and the expense ratio, the Axis’s fund looks better.
So now you have to take a call. For the same star rating, return, and risk profile, which fund you would select? SBI’s scheme is older, but the Axis looks better managed. How? The fund has a bigger asset-size and also has lower expenses.
As you see in the screenshot above, mutual funds are compared based on seven (7) parameters. In total, our comparison tool has 40+ parameters available for comparison. It makes it more useful as a tool. Moreover, one can compare five (5) schemes at once.
First Do Screening Then Compare Mutual Funds
One of the sizeable limitations in the effective use of a comparison tool can be the lack of screening features. How?
Suppose you’ve decent know-how about mutual funds. You know which schemes are good and which are avoidable. Hence, you will pick only good mutual fund schemes for comparison.
But there are a lot of people who know less about mutual funds. How to pick schemes for onward comparison? Such people will need a screening criterion to narrow down their search.
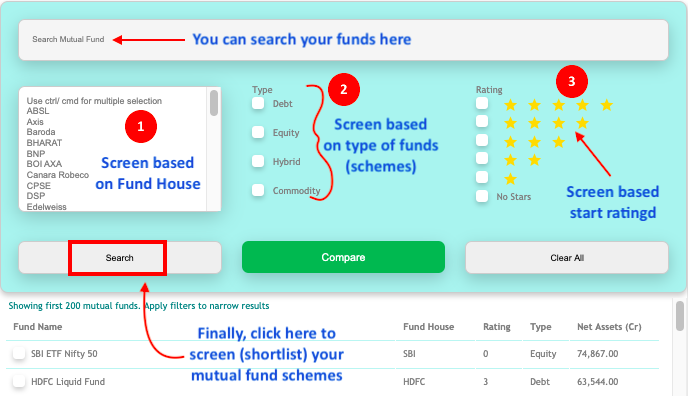
As shown in the above screenshot, our mutual fund comparison tool allows users to screen the mutual fund first. Then it can generate a comparison. The user can shortlist their stocks based on the following parameters:
Screening Parameters
- #1. Fund House: The user can shortlist the stocks based on the fund house. Suppose you want to invest in a mutual fund scheme offered by specific fund houses (like ICICI Pru, HDFC, Aditya Birla). Select your preferred fund house from the list. Use the control (windows) or command (Mac) key to select multiple names at once. If you are not sure of the fund house, leave this field as it is.
- #2. Type of Scheme: Broadly speaking, mutual fund schemes fall into four types: equity, debt, hybrid, and commodity. Use the checkbox to pick your preferred scheme type. Read more about the type of mutual funds.
- #3. Rating: It rates mutual fund schemes on a scale of 0 to 5. Five represents the highest, and zero represents the lowest rating. These ratings vary from time to time. The ratings can give our search a direction, though they are not super reliable. But for me, it works.
The Search Bar
The tool also has a search bar. One can use the search feature to find a mutual fund scheme and generate specifications for that scheme. The search feature is useful when the person wants to know about a particular mutual fund scheme (instead of using the comparison feature).
How to generate the comparative report?
Check the screenshot, it shows one example. There are two categories of actions which one can take
- #A. Screen mutual funds: Follow the steps numbered 1, 2, and 3 shown below.
- #B. Pick schemes: The schemes are picked from the shortlisted result using the check-boxes (see step 4).
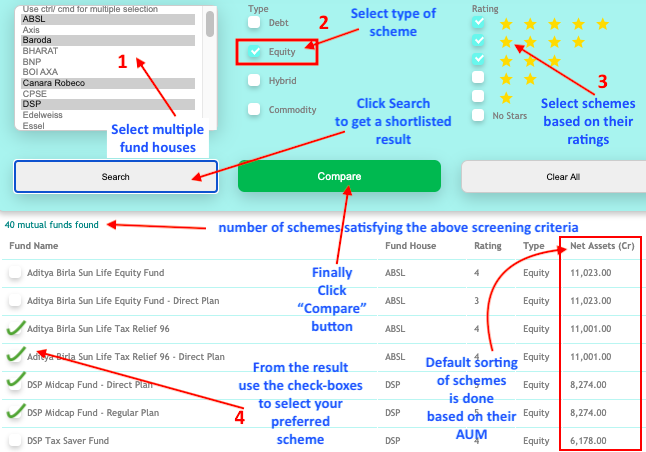
Based on the three screening parameters, as explained earlier, a shortlist is generated. Please note that by default, sorting of all mutual fund schemes is done based on their Asset Under Management (AUM).
From the result, one can use the checkboxes to pick a maximum of (five) schemes at a time. Once the five mutual fund schemes are selected, clicking on the green compare button will generate the final comparative report.
The Report – Compare Mutual Funds
All in all, there are 40+ parameters based on which one can compare mutual fund schemes. To make the parameters more meaningful and easy-to-read, we have clubbed them into four groups: (a) Basic Data, (b) General Data, (c) Rating for Debt Funds, (d) Past Returns, & (e) Risk Analysis.
(a) Basic Data
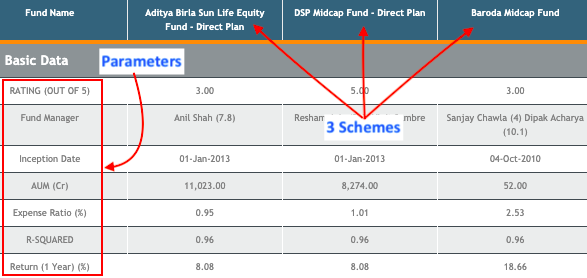
- Rating (out of 5): The funds are rated based on their potential to generate long term returns concerning the riskiness of their portfolio.
- Fund Manager: One can check the name of the fund manager. Time since when the manager is involved with the fund is also visible. Use these details to google more about the fund manager.
- Inception Date: The inception date gives an idea about the age of the fund. An old scheme with a high rating is a good starting point.
- AUM: Asset Under Management (AUM) depicts the size of the mutual fund scheme. It is calculated by counting the size of assets in the portfolio (in Rs. Crore). AUM is used to calculate NAV [NAV = (AUM-Liability)/number of units]. Read more about net asset value (NAV).
- Expense Ratio (%): Lower expense ratio is better. Within a fund category, the scheme with the lowest expense ratio is more likely to perform better over time. Read more about the expense ratio.
- R-Squared: It is a measure of how aligned is the performance of a scheme with its Benchmark. The R-squared value ranges from 0 to 1. A value of zero (0) means the mutual fund scheme does not correlate with its Benchmark’s movements. A value of one (1) means the fund perfectly emulates the Benchmark.
- Return (1 year) %: This indicates the rate of appreciation of the scheme’s NAV in the last 12 months.
(b) General Data
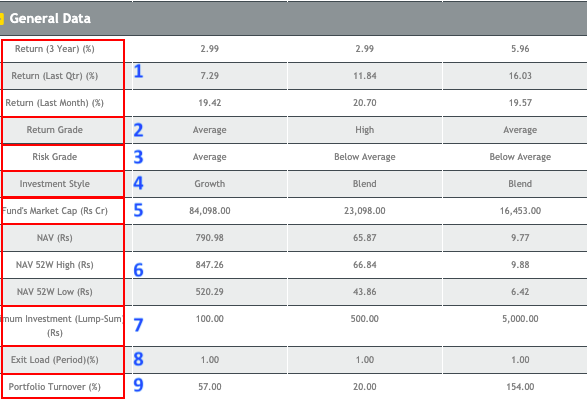
- Return (%): In this block, we can see returns of the last one month, one quarter, and three years at one glance.
- Return Grade: Fund’s risk-adjusted short-term returns are graded into five types. High: top 10% of all funds in its category, Above Average: next 22.5%, Average: next 35%, Below Average: next 22.5%, Low: bottom 10%.
- Risk Grade: Fund’s short term returns are compared with the risk-free rate (like a bank’s FD) to judge the risk of loss for an investor. The relative risk profile of a fund concerning its category average is then rated. High: top 10% of all funds in its category, Above Average: next 22.5%, Average: next 35%, Below Average: next 22.5%, Low: bottom 10%.
- Investment Style: This is applicable for only equity and hybrid funds. The fund investment style is classified into three types: (a) growth, (b) value, or (c) blend – growth+value. Growth style funds mainly buy growth stocks. Value funds mainly buy undervalued stocks.
- Fund’s Market Cap: This is again applicable only for equity and hybrid funds. What is visible is the weighted average market capitalization. Market cap value indicates if the scheme is predominantly investing in large-cap, mid-cap, or small-cap stocks.
- NAV: This block indicates the current NAV, 52W high NAV, and 52W Low NAV. Seeing all these three numbers at one glance can give a fair idea about the price trend of the scheme. Read more about net asset value (NAV).
- Minimum Investment: This indicates how much minimum lump-sum investment is possible in a mutual fund scheme. Some mutual funds allow a minimum investment as low as Rs.500. Some demand the least Rs.100,000.
- Exit Load: Generally, mutual funds in India charge an exit load of 1% when units are sold before 12 months holding time.
(c) Rating For Debt Funds
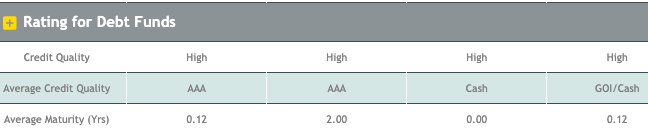
- Credit Rating: This is applicable mainly for debt and hybrid schemes. These type of instruments holds risk-free instruments (T-bills, Bonds, etc.) in their portfolio. These instruments earn interest for the buyers. A high credit rating indicates if the issuer tends to default on its obligations. Other ratings can be medium or low. Read more about debt funds.
- Average Credit Quality: This is the average credit rating of the scheme’s total portfolio. The individual credit rating of each instrument is collected. Like, government bonds or T-bills are free from any credit risk. Other financial instruments are rated in this order: AAA, AA, A, BBB, etc. The computation of the portfolio’s credit rating is done based on the individual constituents’ ratings. Read risk-free investing & high returns.
- Average Maturity: Each debt instrument has a maturity period. Instruments with shorter maturity period carry lower risk and vice versa. The data shown is the average maturity period (in years) of all financial instruments. Read SIP in debt funds is good?
(d) Past Returns
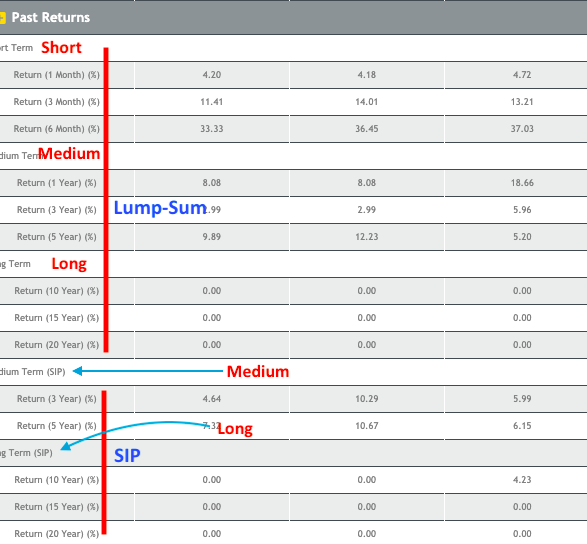
There could be two types of returns generated by a mutual fund. It depends on how the person is investing. There could be (a) return on lump-sum investment and (b) return on SIP investment. For the same scheme, both these returns will be different. Read A mutual fund return calculator.
Moreover, the whole return history is further sub-divided into short term returns (1 to 6 months), medium-term returns (1 to 5 years), and long term returns (10 to 20 years).
This way, the user of the mutual fund comparison tool will get a spectrum of returns, ranging from a month to twenty years (as applicable).
(e) Risk Analysis
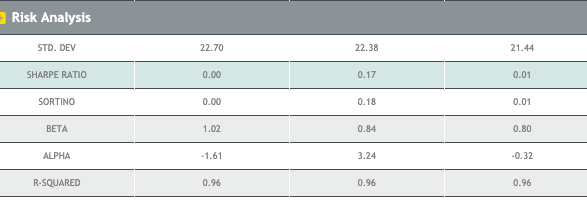
- Standard Deviation: It’s a measure of NAV’s fluctuation above and below the mean. It is indicative of price volatility. Example: Sd value of 22.7 can be read as NAV of fund fluctuating 22.7% on both sides of the mean.
- Sharpe Ratio: It is a financial ratio that measures the return of a volatile asset (like stocks, mutual funds, etc) relative to the risk taken to generate those returns. The higher is the Sharpe ratio the better. A rule of thumb says Sharpe Ratio of above 3 is great. Read more about the Sharpe ratio.
- Sortino Ratio: Sharpe ratio considers all types of volatility in its calculations. Sortino ratio is an advanced version of the Sharpe ratio. It only considers the downside price movement as a risk. It ignores price movement which is above the mean.
- Beta: It indicates how much the NAV of the scheme will fluctuate with movement in its benchmark index. The beta of 1 means, the movement will exactly match its benchmark. A beta above one means, if the index goes up by say 10%, NAV will jump higher than 10%, and if the index goes down by say 5%, NAV will fall by more than 5%. The beta of less than one indicates a smaller sensitivity to the benchmark’s movements.
- Alpha: It indicates the performance of a scheme compared to its benchmark. An Alpha of more than one means, the fund has outperformed its benchmark. Alpha of less than one indicates underperformance.
- R-Squared: It is a measure of how aligned is the performance of a scheme with its benchmark. The R-squared value ranges from 0 to 1. A value of zero (0) means the scheme has no correlation with its benchmark’s movements. A value of one (1) means, the scheme perfectly emulates its benchmark.
Conclusion
If you want to invest your money through the mutual fund route, then you will need a researching tool. Our compare mutual funds tool is simple but effective. It not only allows users to screen good schemes but also helps them further by generating a comparative result.


Do you compare mutual funds based on rolling return , upside and down side capture ratios also? I did not find these parameters in screen shots.
Hi Mani,
Many thanks for simplifying the data. I would like to know about index funds. COuld you please try to post your ideas? Waiting for your post. Thanks in advance
Regards
Vijendhar
Hi Mani,
The standard Deviation mentioned here in case of Mutual funds is for which period?(monthly/quarterly/yearly/since inception of fund etc.)
The standard deviation for equity funds is based on trailing three years, monthly returns.
For debt funds, it is based on the weekly returns over the past 18 months
The tool is difficult to use. I cannot make out how to select 2 MFs. I searched for SBI MF and then selected one. Then, I searched for Axis and selected 2nd MF while pressing Control key. But when I click compare, the previous selection of SBI MF is not shown.
Please use filer the list using fund house name (like SBI and Axis).
MF comparison is explained in detail.I think it’s a very useful tool for new investors.
Thank you
Dear Mr Manish, Many thanks for the MF comparison tool… it will certainly be useful. I am always struggling and looking for the impact of increasing and decreasing the fund corpse (assets)? Funds – when they are giving good returns …everybody is buying the same MF and them fund managers have little choice of either sitting on big cash pile or buy stocks at higher price and then slowly and steadily impacting the returns. Exactly, the reverse happens when people think.. – fund is not doing well- … many investors start withdrawing ….. forcing the fund managers to sell the most appreciated stocks and then as the withdrawal speed goes up… the performance and quality of MF holdings slowly go down. Requested to have your views and how best we can use this parameter and where to find the Assets / AUM data?
Good morning Mr. Mani(sh)
Excellent writeup on MF tool. I am sure it will greatly help all and novice in particular to understand and begin. For sure I will try and use your MF Tool to enhance my knowledge on MF.
Well done and keep up the good work.
Thank you for taking the time to post the feedback.