
Bank Stock Fundamental Analysis Tool
Introduction
How to analyze bank stocks? Analysis of banking stocks is not like analyzing stocks of other businesses. Why? Because the business model of banks is different from other businesses. Hence, their financial statements are also prepared differently. A Screener for Top 20 Banks.
In simple words, financial reporting of banks are different than other companies. The financial ratios which can analyze other stocks are not effective to analyze bank stocks.
So if you want to analyze bank stocks, do this first. My suggestion is, go ahead and read about the business model of banks. This will go a long way in doing the number crunching of bank stocks.
Anyways, I’ll touch a bit about the banking business in this article before talking about analysis of its stocks.
Topics:
- Banking Business:
- Banks: Growth & Limitations.
- Financial Ratios for Banks:
- 5 Steps to Analyze Bank Stocks:
- Conclusion.
Banking Business
I’ll try to explain how bankers think about making money from their line of business. If we can understand how banker’s think, we can value their stocks more effectively. But allow me to issue this disclaimer that what I’m explaining here is a too-simplified version of banking business. In real world, their operation is much more complicated.
#A. Line of Business: Providing Lockers
Bank’s collect valuable assets from public and keep them under lock-and-key. This is what is called as a ‘bank locker’.
This is one line of operation based on which the banking business started in the world. The “locker” facility is still provided by the banks, right? Yes.
When public comes to take back the deposited money/asset, bank’s just need to reach the locker and pay back the money/asset back to the depositor. This way, till the asset/money is in the bank’s locker, it is 100% safe. Read: How to build assets.
But to store money in locker, banks must charge a fixed fee. Example: If you want to keep Rs.5,00,000 worth of Gold, and Rs.3,00,000 cash in a locker, you may be charged a fixed annual fee of say Rs.5,000.
So you can see, this is one of most basic line of business for banks. Bank’s provide a safe and secure locker. In turn we pay them a fixed fee.
But this line of operation has a very narrow profit margin. Why? Because overheads are too high. Moreover, apart from security on deposit, the customers has no other motivation to open more lockers with banks.
Hence, banks has also found other methods to do the business – which are more profitable. Example: providing savings accounts to public.
#B. Providing Benefits on Saving Deposits
Banks collects deposits from public. Keeps 20% money safe in locker (read about CRR & SLR). Uses the balance money (80%) to generate some profits for itself.
So, in this business model, banks use a portion of our deposits to earn some money for itself. In turn, the profits that they earn are also shared with us. How the profit sharing is done? By giving us return on our deposits in form of interests (like 3.5% on savings a/c).
[Note: Compare this with “locker” type business model, where banks charge fees on our asset/money deposits – instead of paying returns]
What happens to the deposited money in savings account? The deposited money grows in size as they are earning interest. Suppose the principal deposited amount is Rs.1,00,000. At rate of 3.5% p.a. interest, the deposit will become Rs.103,500 after one year.
This is a win-win business model for every one (banks and us). How?
- For People: Firstly, they are getting a space where they can park their money safely. Secondly, they are also getting an incentive to park their money in banks as their deposited money will also grow in size. How? As bank’s will pay interest on the deposits. Read: Guide on how to save money.
- For Banks: As banks gets liquid cash from people, they can use this money to do onward business and earn some profits. This way banks are able to cover their cost of operation. Moreover, banks also make some profit. Similar Reading: Business model of airports.
Depositors are happy, and banking sector is also happy as they are making profits.
Banks: Their Growth & Limitations
How banks can grow? By collecting more deposits from public. Then by keeping 20% of it aside – as part of CRR and SLR, and using the balance 80% to lend to others. This way they will earn revenue and also make some profits.
But there is a limit on the amount of deposits a bank must collect from public. How this limit is defined?
Let’s understand this by using this hypothetical example. Suppose you have Rs.10,000 extra cash as savings in your piggy bank. You want to keep this money in bank and earn some interest. You have only two banks in your village. Bank-A has an account of 50 number villagers, and Bank-B has account of 350 number villages.
You are likely to select which bank? Majority will select Bank-B, right? Why? Because for a depositor, their money will be safer in a bigger bank.
As an investor, how you will quantify the size of a bank? One way to do it is by looking into their number of account holders. But the other and more efficient way is to look into their net worth. Why?
Because bigger is the net worth, more deposits banks can take from public. Hence, for banks to grow, they must focus on growing their net worth. Let’s understand this with an example.
- SBI’s Net Worth = Rs.195,367 Crore.
- Kotak Mahindra’s Net Worth = Rs.42,900
Both these are India’s top banks. So does it mean that both can collect the same amount of deposit from public? Technically speaking, the answer is Yes. But an investor must see “the deposits” from a different eye.
What are deposits? For a bank, deposit is its liability. Why? Because bank has to pay it back to public – with interest. The more are the deposits, the riskier it becomes for the bank. So what is the solution?
Maintaining a balance between its deposits and net worth. How to know about it? By checking their key financial ratios (specially equity multiplier).
Financial Ratios For Banks
The bank must maintain a balance between growth and risk. Growth is good, but it cannot be done at the stake of making its business riskier.
Example: Yes Bank. It only focused on increasing asset size. But it cared less about the quality of its assets. Hence as on date, it is sitting on a pile load of NPA’s.
How to check if a bank’s business is safe or heading towards high risk zone – like yes bank? Here are the following financial ratios we can check for banks:
#1. Advance-Deposit Ratio (ADR) & Their Growth Rates
A bank which maintains a low ADR (Advance To Deposit Ratio) is considered safe. Consider the case of State Bank of India. Considering that it is a public sector bank, it should mandatorily operate within safe limits. How to know this?
First couple of indicators are shown in the above infographics:
- A/D Ratio: In last five years of operation, average A/D ratio of SBI has been about 0.74. What does it mean? The bank is lending only about 74% of its borrowed money. This is what can make SBI a safe bank. Compare this with Yes Bank, it is lending more than its deposits (A/D ratio is above 1). Other banks Like HDFC Bank, Kotak Mahindra also has A/D below 1. Hence, Yes Bank is risky, while other banks are comparatively safer. Read: What happens when bank’s take a haircut?.
- Growth Rate: Here we will compare growth rate of ‘Advances’ and ‘Deposits’. What are advances? These are loans issued by the bank to public. When Advance growth is higher than Deposits, it indicates higher risk. Except for SBI, all banks has advance growth rate higher than that of deposits, hence are risky. But as Kotak and HDFC bank has kept A/D ratio below 1, hence are safe. But Yes Bank has both as Red flags. Read: About a flaw in banking system.
Checking A/D ratio is only a starting point. More checks needs to be done. Why? You’ll see how SBI, which looks like a safer bank in terms of A/D ratio, will fall apart in later checks.
#2. Equity Multiplier (EM)
The concept & utility of Equity Multiplier (EM) must be clear before analysing bank stocks. What is it?
Equity Multiplier (EM) represents the financial leverage available with a bank. What financial leverage is said to be safe for banks? Number 15. What does it mean? Read: Debt is good or bad for companies.
EM = Total Capital / Net Worth = 15 (max).
EM is a ratio between total capital and net worth. What is total capital? It is a sum of bank’s Net Worth plus External Debt. What is external debt? Example: deposits accepted from public. Read: About return on total capital employed (RoCE).
Investors can use this rule of thumb to estimate, if a bank is making its business risky by accepting too much deposits.
In the above screenshot you can see that, in terms of Equity Multiple, only SBI is getting a red flag. Other all banks, including Yes Bank, is within the safe equity multiple of 15.
#3. Return on Asset (ROA)
The concept of ROA must also be clear to analyse bank stocks. What is Return on Asset (ROA)? In terms of Formula, ROA is what is shown below:
ROA = Net Profit / Total Assets
It is a profitability ratio. Why investors must use it for banks? It helps investors to understand, how well the total assets are used by the bank to generate profits. The higher is the ROA, the better.
Unlike other business models, banking business typically show lower ROA. Why? Because banking business is based on taking deposits from public. Deposits for banks are what “debt” is for other companies. Other business can survive without debt. But banks needs debt to survive (read this).
Hence it is necessary to compare ROA between two banks only. Because the bank’s number will look fragile if you’ll compare ROA of a bank and a FMCG company.
What is shown above in the snapshot is ROA of few Indian banks. You can judge from these numbers that an efficient Indian bank like HDFC-Bank makes just 1.69% on ROA. Close to HDFC Bank is Kotak Mahindra at 1.56%.
As a rule of thumb, an Indian banks would be better off if it is making an ROA of 1% or more. Considering this rule – SBI is again getting a red flag.
#4. Return on Equity (ROE)
Knowledge of ROE is also a must to analyse banking stocks. What is Return on Equity (ROE)? In terms of Formula, ROE looks as shown below:
ROE = Net Profit / Net Worth.
ROE – It is a profitability ratio. Why investors must use it for banks? It helps investors to understand, how well the shareholders funds are used by banks to generate profits. The higher is the ROE, it means shareholders are benefitted more. Read: About how to calculate ROE.
As a rule of thumb, ROE >15% for banks is considered acceptable.
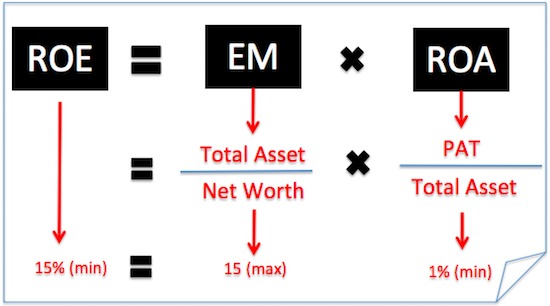
Why ROE of 15% is a number to look out for? Because it is derived from the two formula’s we have studied just now (check the above infographics:
- EM15: We have read here about equity multiplier. For a bank to be operating with reasonable risk, it’s equity multiplier should be maximum 15.
- ROA1%: We have also read here about ROA for banks. From the historical numbers, it has been established that banks do not make as big ROA as other companies. But a reasonable ROA for bank is minimum 1%.
- ROE15: I call it ROE15 Rule. It is derived from EM15 and ROA1% rule. So if a bank is satisfying ROE15, it is actually meeting the requirements of EM and ROA. We will use this rule to know how to analyze bank stocks later in this article.
Now we are ready for a more comprehensive analysis of banking stocks.
How to Analyze Bank Stocks: Steps
Analysis of banking stocks begins with (a) Knowing the business model of banks and (b) Knowing the concept of EM, ROA and ROE. Once a person is done with this, he/she can take the following steps to analyze stocks:
- Step #1. Collect Data. It essential to collect financial data of banks. One can get this data from websites like business-standard, economic times, moneycontrol etc. Which data to collect? NW, TA, PAT, Interest Income and Interest Paid. What to do with this data? Use it calculate EM, ROA, ROE and NIM. Check here for ROA & ROE for top banks.
- Step #2: Check ROE15 Rule. Compare stocks with the ideal values? Which values? Following: EM : 15 (max). ROA : 1% (min). ROE : 15% (min). The most important is to check the ROE. EM and ROA will vary from their ideal values. But their product (EM x ROA) must not go below 15. If banking stocks are not following the ROE15 Rule, it is a red flag. Investors must not ignore it while investing. Check here for ROE of Top Banks.
- Step #3. Check NIM. What is NIM? Net Interest Margin. In terms of formula “NIM = (Interest Earned – Interest Expended) / Total Assets“. The higher is the NIM the better, right? Because higher NIM means, more “interest profit (IP)” per unit asset. So a higher NIM Bank is better, right? Experts says that one must not conclude at NIM stage itself. Go for NIM Vs ROA analysis. Check here for NIM of Top Banks
NIM vs ROA Analysis on Banks
Which is more important for banks, higher NIM or higher ROA? Do not bother to answer. I suppose, even some bankers may not give a right answer here. Why? Bankers may think that by increasing NIM, ROA will also increase. But this may not be true.
What banks must do? Follow a Rule of Thumb: NIM (max) – 4%. ROA (min) – 1%. Why NIM must be limited to 4% (max)? If banks, will focus only on increasing NIM, at levels above 4%, research proves that it negatively effects ROA.
Why this happens? Because when banks focus only on increasing NIM, they end up issuing too many loans. In an attempt to disburse more loans, the end effect is more NPA’s (bad loans) – like yes bank etc.
Check NIM and ROA Trend
Note down last 5 or 10 years NIM and ROA of your bank. If NIM is going up and ROA is coming down, it is the first sign of danger. If ROA has fallen below 1%, it’s a red flag.
Example: NIM and ROA of Kotak Mahindra Bank is shown below. NIM is high at above 3.5% but within the 4% threshold. It is a good number. But ROA is falling. Hence, their net effect on bank’s fundamental is neutral. For investors – ROA must grow with time.
- Step #5. Check Growth Rates. Ideally, banks must produce more profit per unit asset (total capital employed). This makes the bank more efficient. How to measure it? Use ROA. What one must look for growth numbers? Two things: (a) PAT Growth, and (b) Total Asset Growth. Let’s understand this with an example.
Out of the below listed banks, which is better?
ICICI, Axis and Yes Bank is showing negative PAT growth in last 5 years. Hence we will remove these 3 banks from comparison. What is left is HDFC, Kotak & Bandhan Bank. What’s good about these 3 banks? Their Asset and PAT growth are positive. But which is better?
We must recall that, banks must produce more profit for the same asset size (total capital). This we can also interpret as, “Bank’s must grow their PAT faster than its Assets“. This way banks can increase its profitability (ROA).
So as per this rule, Kotak Mahindra bank is best followed by HDFC Bank. Bandhan Bank being a new bank, its growth rate is showing higher. But actually this bank is too small compared to Kotak and HDFC.
P.Note: Higher Asset Growth rate, compared to PAT growth, ultimately translates into falling ROA. This happens, whenever banks get into the rate race of NIM growth, forgetting about ROA. So next time, whenever any banks boasts their PAT numbers, compare it with Asset.
Improving ROA is an ideal number. But what is even better is a combination of improving ROA, and ‘PAT growth higher than Total Asset Growth’.
Conclusion
It is essential for banks to collect more and more deposits. But it must not cross the financial leverage of 15 (read this). Goods Banks maintain a minimum ROA of 1%. It is also important for banks to ensure ROE above 15% (rule of thumb).
Banks whose NIM is growing, but ROA is decreasing is not a good sign for investors. One easy check it to look at the following: (a) PAT Growth Rate (PATGR) – last 5 years, and (b) Total Asset Growth Rate (AGR) – last 5 years. A bank must exhibit, PATGR more than AGR
Suggested Reading:

Hi ..Mani Sir,
As an Concentrated Investor in Growing Banking Stock, these Informations are very useful to me at present and in Future also.Before Investing, I didn’t chek these parameters and actually it was not prudent to apply these parameters to new age growing bank, but I will definitely check it Time to time, so, This is very useful to me.
Thanks for your valuable advice.
Thanks a lot for posting your comment.
Hi Mani
I liked your Article, But your figures for Advances to Deposits Ratio(ADR) are wrong, kindly check them again as there is repetition of Mar 16 & Mar 17,Mar 18 & Mar 19 data . Even for Yes Bank,if you check the figures for Deposits & Advances are wrong,the correct figures are as followed:-
Deposits for FY ending March 2017-142,87,38,567
Deposits for FY ending March 2016-111,71,95,331
Deposits for FY ending March 2015-91,17,58,482
Advances for FY ending March 2017-132,26,26,769
Advances for FY ending March 2016-98,20,99,270
Advances for FY ending March 2015-75,54,98,162.
After considering the changes of correct deposits & advances figures,you will find that A/D Ratio will be less than 1 for Yes Bank . Hence we could not have identified yes Bank debacle using this A/D Ratio parameter.
I found that you used Standalone financial numbers for all calculation purposes in this article.
Don’t you think Consolidated financial numbers are more important.
In coming future Articles,can you throw some light on identifying companies doing accounting malpractices to inflate their stock prices ,especially in Banking & NBFC companies to avoid companies like DHFL,Yes Bank,IL&FS etc .Because Using Cash Flow Statement, for manufacturing & Retail companies,shady accounting practices can be detected easily but in case of Banks & NBFC’s this is quite complex.
Kindly throw light on the same
Regards
CA Harish
The picked value might be done in a haste. But I hope the concept of ‘how to analyze bank stocks’ is clear. Thanks.
Excellent piece of work Mani , you have just simplified the bank system. really a very nice article
Thank you
Nicely explained with all elated article link, Highly beneficial to analyse banking stock.
Wonderful article explained in a simple and straight forward way. Appreciate the clarity and the hard work went in simplifying the explanation.
Great piece
Thanks !!
Thank you sir for this precious information 😊
Best luck for future 🙂 sir
Sir can you analyze Bank of Baroda, PNB, Indian Bank, Bank of India, Bank of Maharashtra, DCB, UCO bank, Union Bank and Canara Bank
Wonderful article. For retail investors your articles are very good. Lot of learnings about value investing.
Thanks a lot for so many well explained articles. Appreciate your effort to educate people on investing.
Sir, I am a fan!
Nice article.
But i thought that Gross NPA and Net NPA are also very important while analysing banking stocks. Please let me know your thoughts on it.
Your articles are very well articulated, it is easy to understand and every investor needs to go through your blog before starting investing in markets, Thanks as always for your efforts put to make this informative article.
Thanks for posting your awesome views. It means a lot.
A very good analysis in very simple words. You are doing great job , making people to understand how the big institution works and what is their bussiness model. I request you to please publish some articles on derrivative segments. Specially i would request you to write an article on behaviour economics and crowd psychology
great
sir
very good analysis in simple terms . As a senior CA i find it very useful i had no time to do this type of work while in employment!and while doing bank audits after full time practice .All the time tied up with tight schedule of work . you are doing great service.It is sharing of knowledge .The layout is superb.
it is good i joined your blog as subscriber
Thanks for the awesome feedback.
Hi Mani, thank you for this great write up. Does this analysis also apply to NBFC’s?
Yes it’ll work
Very Good Analysis explanation
Very nice blog. Although you haven’t mentioned which method should be used to find intrinsic value of banking stock. As you have mentioned Bank has a different business model compared to other companies so does using same model like DCF will work to find intrinsic value of a bank stock?
Yes I am sure, DCF should work for banking stocks as well. Trick is to estimate the free cash flow of banking stocks accurately.