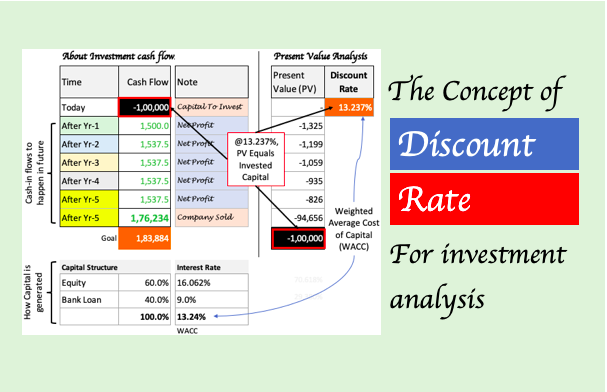
In this article, we’ll do the Net Present Value (NPV) calculation. Idea is to understand the concept of Present Value in a real-world scenario.
Imagine, we are an investor who plans to buy shares of a company called “ABC.” Using the information we’ve about ABC (financial reports, etc), we will make two educated assumptions:
- #1. Future Cash Flows: We will try to forecast the future cash flows of the company.
- #2. Risk: We will also assess the risk associated with investing in ABC.
Then, using the Net Present Value (NPV) concept will do the calculations and estimate a fair value of the company (ABC). In value investing terms, the fair value is called intrinsic value.
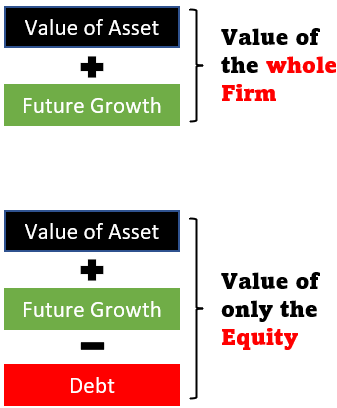
1. Value The Whole Firm or its Equity
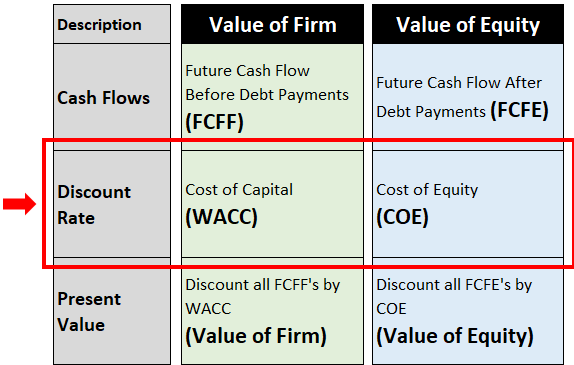
What is the difference? It is minor but it will alter the metrics we must use for the cash flow estimation and risk assessment. The difference between a firm and its equity is represented below:
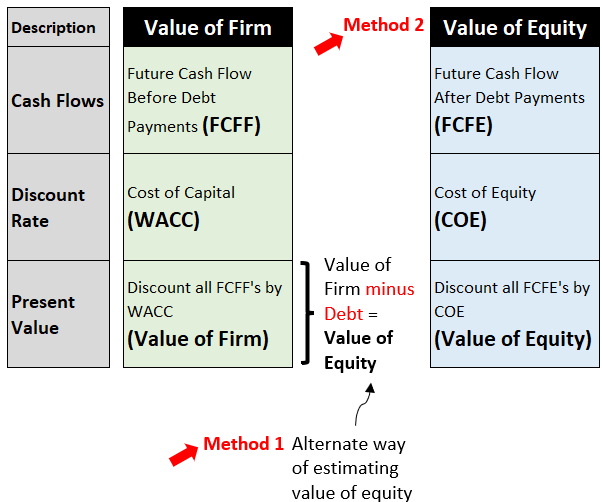
There are two steps to value the whole firm (business):
- First, estimate the total cash flows (cash flow to the firm). This cash flow is before the loan EMI payments (interest & principal).
- Second, the above cash flows are discounted by a rate equal to the total cost of capital (cost of debt plus cost of equity). This will give us the present value of the cash flows. The sum of present values of all cash flows is the value of the firm.
To value the equity only, we have two ways:
- Way #1: Subtract debt from the value of the firm calculated above. It will give us the value of equity.
- Way #2: Estimate cash flows to equity. It is the cash flow after debt payments are made. Discount the cash flow to equity by a rate equal to the cost of equity. Then, adding all the present values of the cash flows will give us the value of equity.
To answer the question of whether one can buy shares of ABC, we will need to do the following:
- Calculate the “Value of Equity” per share (Intrinsic Value per share). The value of equity can be calculated by the two methods shown above. In most cases, both methods will yield similar answers.
- Compare intrinsic value per share (IV) with the current share price (P). If P is less than IV, it means the share is undervalued (Good to buy).
Let’s go further deep into understanding the three components of our Net Present Value (or intrinsic value): cash flows, discount rate, and present value.
2. Cash Flows
Within the cash flow, there are two essential components required to do the intrinsic value maths, current cash flow, and its expected growth rate.
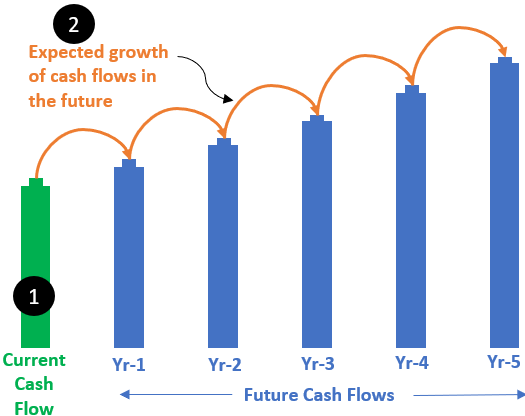
These two components will help us calculate the future cash flows of our example company ABC.
#1.0 Current Cash Flow (Current Free Cash Flow)
The concept of free cash flow has its roots in the dividends paid to the equity holders. For an equity holder, the free cash flow (FCF) is the following:
- Dividend: This is the actual cash that equity holders received from their holding company.
- Share Buyback: When companies perform shares buyback, their earnings get less liquidated. Hence, the current shareholders benefit by the way of price appreciation.
But there is a problem with this concept. How to estimate the intrinsic value of a company that neither pays dividends nor practice the philosophy of shares buyback? To include such companies within our ambit, we can use a theory called “potential dividends”. Even if the board of directors decides against dividend payment or share buyback, we’ll estimate what potential dividend a company can pay to its equity holders/shareholders.
A study of the last year’s financial reports of a company will give us our potential dividend. Henceforth, we will refer to it as “current free cash flow.”
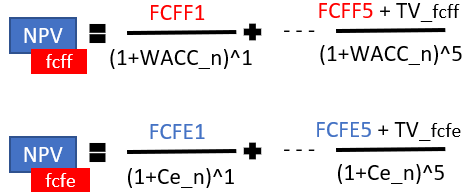
Now, as we know there are two types of free cash flow: Free Cash Flow to Firm (FCFF) and Free Cash Flow to Equity (FCFE). In terms of formula, both are represented as shown below:
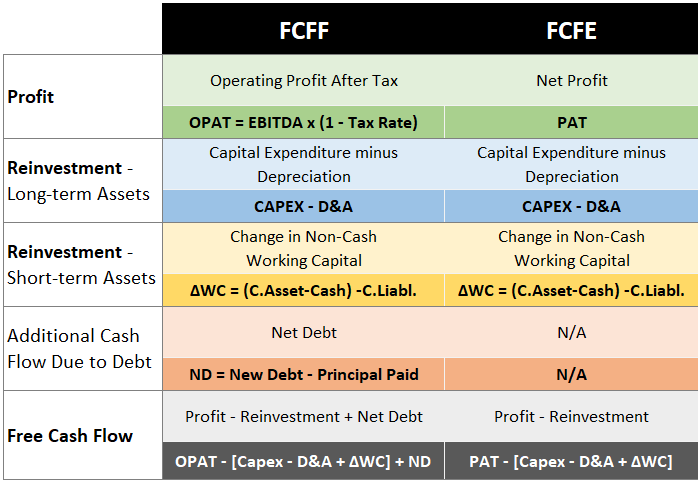
I’ll briefly describe the components of free cash flow as highlighted in the above image:
Components of Free Cash Flow
- Profit: In the case of FCFE what is considered profit is the net profit left for the shareholders after payment of taxes and interest expenses (PAT). While FCFF is profit left after tax but before interest and principal payments of debt (OPAT). Read more about operating profit margin.
- Reinvestment in L.T. Assets: Good companies reinvest a part of the profit to expand and modernize their long-term assets. Surely, the reinvestment reduces the cash available for the shareholders, but it pays in terms of future growth. In our jargon terms, we often refer to this reinvestment as CAPEX (Capital Expenditure). In our formula, we’ll use the metric called net capital expenditure (CAPEX – D&A).
- Reinvestment in S.T. Assets: In order to grow, the company must also reinvest in its short-term, assets. It is done to maintain a higher level of raw material inventory, finished good inventory, spares, account receivables, etc. To represent this ST reinvestment we use a metric called “change in non-cash working capital”. Its formula is shown in the above table (image).
- Debt: When new debt is taken, it adds to the cash inflow. When debt is repaid, it consumes cash. In an FY, if more debt is availed than repaid, the cash inflow increases. But the effect of it will be felt on the firm (FCFF) and not on the equity (FCFE). See the FCFF & FCFE formula.
[Please Note: After calculating the value of the total firm (business) using FCFF, the intrinsic value for the shareholders will be the value of the firm minus debt. So, though FCFF, included debt in the net present value calculation, to estimate the intrinsic value, debt will eventually be removed from the overall number]
FCFF and FCFE calculation for Example Company ABC
For our example company ABC, in FY Mar’2022, the potential dividend, or Free Cash Flow to Equity (FCFE) calculation is shown below. We can also follow the approach of intrinsic value estimation via the FCFF route. Calculation of both is as below:

[P.Note: Warren Buffett uses a similar formula for FCFE calculation. He calls it the “Owners’ Earnings.” There is a small alternation in his formula, it is a bit more conservative than what is shown above. His FCFE formula does not include the component of new debt.]
#1.1 Normal Period Growth of FCF
In the net present value analysis of a company, there are two growth periods. First, a normal growth that will happen during the next five years of analysis. The second is a perpetual growth that will happen during the terminal growth period. In this section, we’ll talk about normal period growth.
How to forecast the future growth rate for a company? We look at past records, income or profit trends, to base our estimates. But it is not a reliable way to estimate potential growth. Allow me to show you the past growth rate numbers (last 5-Years) of our example company ABC.
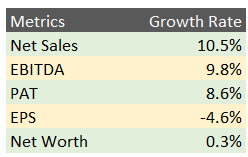
How to decide on a growth rate number for ABC? From the above data, it is confusing. Moreover, as the company becomes bigger its growth rate becomes slower. There was a time when I used to refer to the estimates of the analysts for their growth rate numbers. But the problem with this approach is that they analyze only a limited number of companies. What is the way out? Getting back to the very basics of business. How?
How does a company grow? There are two ways of doing it. First, modernize its existing facility and make it more efficient. Second, make new investments to expand the size of its current operations. In other words, a company can grow if its efficiency grows or/and its new investments grow.
How we can quantify these two growth parameters?
- Efficiency Growth: It can happen by cost-cutting thereby enhancing profitability. No company can grow forever based on efficiency growth alone. Growth driven by efficiency enhancement is only a short-term phenomenon. For long-term growth, investment is required.
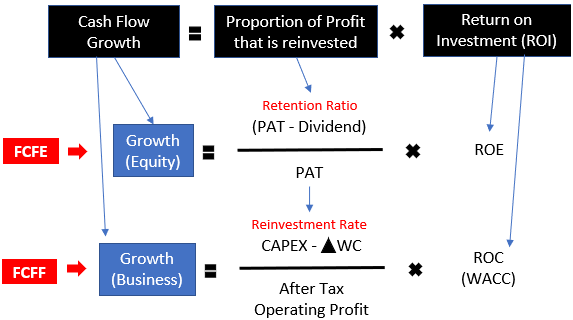
- Investment Growth: It can be measured by looking at how much of the net profit is reinvested back into the business. But only the quantum of reinvestment (retention ratio/reinvestment rate) is not sufficient, measuring the return on investment (ROE)/ROC) is also necessary.
Depending on what type of cash flow we’ve considered for company valuation, we either use retention ratio/ROE or reinvestment rate/WACC to decide on a growth rate number for a company.
Now, let’s apply the above growth formula to our example company, ABC. We will look at the historical data to understand what Retention Ratio and Reinvestment Rate we can assume for the future.
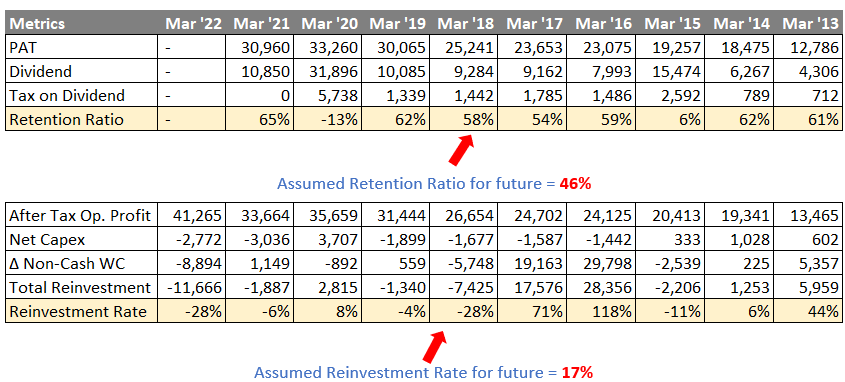
The growth rate we can assume for ABC will be as below:
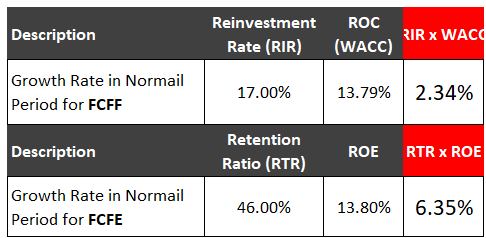
Fundamentally, ABC can grow its FCFF and FCFE at the rate of 2.34% and 6.35% per annum respectively.
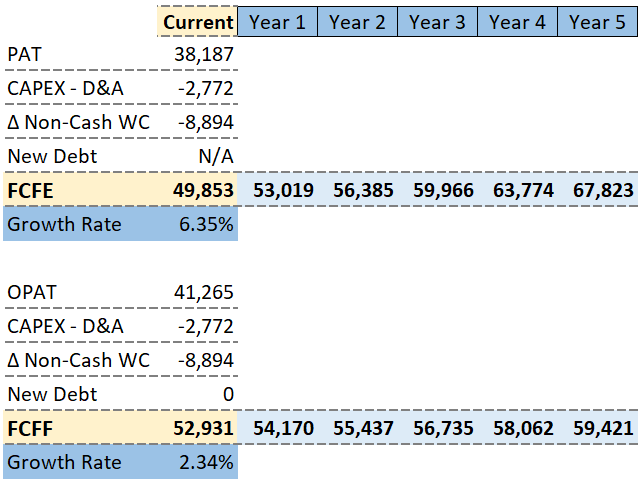
Expected Future Cash Flow (5 Years Hence)
So, what informations do we’ve till now about our example company ABC?
- Current FCFs: We know their current FCFF (52,931 Cr) and FCFE (49,853 Cr).
- Future Growth Rates: The FCFF will grow at 2.34% and FCFE at 6.35%.
These two values we can use to estimate the free cash flow for the next five years:
3. Discount Rate (Associated Risk)
In section #1.0 above, we estimated the free cash flows, FCFF and FCFE. In the fundamental analysis, we must also factor in the associated risk with a business or its equity.
Suppose two companies have a similar FCFE. But the cash flow of one looks safer and more predictable compared to the other. In this case, the safer cash flow should get more weight over the other.
How to give more or less weight to the cash flows? It is done by assuming a higher discount rate for riskier stocks.
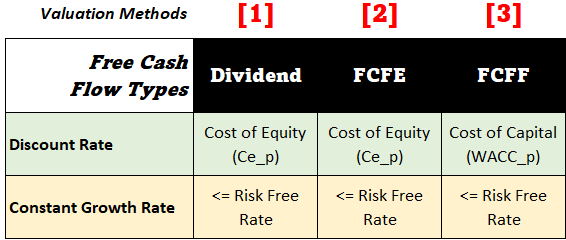
While assuming a suitable discount rate, we must look at what parameter we are using as the cash flow. If FCFF is used as cash flow, then the discount rate will be the cost of capital, cost of equity (Ce) plus the cost of debt (Cd). The Cost of capital is also called WACC (Weighted Average Cost of Capital). If FCFE is used as cash flow, the discount rate will be only the cost of equity (WACC).
[P.Note: In the Net Present Value calculation there will be two types of WACC. First is WACC_n, it is for a normal growth period (first five years). The second will be WACCC_p, it is for the perpetual growth period for Terminal Value (TV) calculation. We’ll read about terminal value later in this article.]
Cost of Equity (Ce)
I’ve written a separate article on Capital Asset Pricing Model (CAPM). It is a financial model that establishes a link between risk and returns from an asset. Reading about CAPM will give you a better insight into the cost of equity, cost of debt, and WACC.
Nevertheless, we’ll also touch base on the subject in this article. Investing in equity is risky. Hence, equity investors expect a higher ROI than other investors. How we can quantify the expected returns? We can use this formula for the cost of equity.
Cost of Equity (Ce) = Rf + Beta * Rp
There are three parts to this formula:
- Risk-Free Rate (Rf): It is the first component of the formula. It represents the minimum return that an equity investor expects from his/her investment in the worst possible scenario. The yield of a 10-Year government bond ideally represents the risk-free rate. The current yield of this bond is 7.2%.
- Risk Premium (Rp): When investors invest in a non-risk-free asset. they demand a higher return than a risk-free rate. This differentially higher return is called the risk premium. For an Indian scenario, a risk premium of 6%+ for a benchmark index like Sensex or Nifty-50 will be fair.
- Beta: A stock whose price is more volatile than the index (like Nifty-50) becomes riskier. Investors will demand a higher return for more volatile stocks. For our example company ABC, the 5-Year months beta is 1.1. As this value is more than one, it denotes that the price of ABC is more volatile than the index.
Using the above three values as our reference, we can calculate the cost of equity of ABC.
Ce = Rf + Beta * Rp = 7.2% +1.1 x 6% = 13.8%
The value of Ce for ABC is 13.8%. For a stock that is as volatile as indicated by its beta, it must yield a return of 13.8% or higher. This is the value we can use as a discounting rate for calculating the present value of all FCFEs of the future.
Cost of Debt (Cd)
For lenders, what is the risk of borrowing money? They will not receive the principal and interest. The more the perceived risk, the higher will be the offered interest rate. For riskier companies, the lenders will charge extra interest rates over and above the risk-free rate. The extra rate is called Spread.
How the risk is judged? By looking at the historical Interest Coverage Ratios (ICR) of the company. What is ICR? It is a ratio between the company’s EBIT and Interest. A higher ICR will make the company safe, and vice versa. How one can establish a relation between ICR and spread? I’ve sourced this table from the NYU Stern School of Business website:
| ICR > | ICR ≤ to | Rating is | Spread is |
| -100000 | 0.499999 | D2/D | 14.34% |
| 0.5 | 0.799999 | C2/C | 10.76% |
| 0.8 | 1.249999 | Ca2/CC | 8.80% |
| 1.25 | 1.499999 | Caa/CCC | 7.78% |
| 1.5 | 1.999999 | B3/B- | 4.62% |
| 2 | 2.499999 | B2/B | 3.78% |
| 2.5 | 2.999999 | B1/B+ | 3.15% |
| 3 | 3.499999 | Ba2/BB | 2.15% |
| 3.5 | 3.9999999 | Ba1/BB+ | 1.93% |
| 4 | 4.499999 | Baa2/BBB | 1.59% |
| 4.5 | 5.999999 | A3/A- | 1.29% |
| 6 | 7.499999 | A2/A | 1.14% |
| 7.5 | 9.499999 | A1/A+ | 1.03% |
| 9.5 | 12.499999 | Aa2/AA | 0.82% |
| 12.5 | 100000 | Aaa/AAA | 0.67% |
For our example company ABC, for the last five years ICR is as shown below:
| Description | Mar ’22 | Mar ’21 | Mar ’20 | Mar ’19 | Mar ’18 |
| EBIT | 50,209 | 41,439 | 42,734 | 40,875 | 31,961 |
| Interest | 486 | 537 | 743 | 170 | 30 |
| ICR | 103.3 | 77.2 | 57.5 | 240.4 | 1065.4 |
In the last five years, the ICR has stayed above the 57.5 mark. Referring to the above default spread table, ABC will qualify for a bond rating of AAA. In this case, its spread will ve 0.67%.
Since interest payments can save taxes for the company, hence we must also take this tax savings into the consideration. How to do it? By factoring in the marginal tax rate in the cost of debt formula. For an Indian company, the marginal tax rate will be about 25%. This way the cost of debt will be as shown in the below formula:
Cd = Rf + Spread * (1 – Marginal Tax Rate) = 7.2% + 0.67% * (1-0.25) = 7.7%
The value of Cd for ABC is 7.7%.
Cost of Capital (WACC_n)
Once the cost of equity and debt is calculated, the estimation of the cost of capital will be comparatively faster. The formula for WACC is as below:
WACC = Ce * E/(E+D) + Cd * D/(E+D)
- E = Shareholder’s Capital,
- D = Total Debt.
For our example company ABC, the proportion of debt and equity is shown below. The average values of debt and equity for the last five years are shown in the below table:
| Description | Mar ’22 | Mar ’21 | Mar ’20 | Mar ’19 | Mar ’18 | AVERAGE |
| Total Debt (D) | 0 | 0 | 0 | 0 | 220 | 44 |
| Shareholder’s Capital (E) | 77,173 | 74,794 | 74,368 | 78,898 | 75,866 | 76,220 |
| E+D | 77,173 | 74,794 | 74,368 | 78,898 | 76,086 | 76,264 |
Hence, the cost of capital (WACC_n) will be:
= 13.8% * (76,220/76,264) + 7.7% * (44/76,264) = 13.79%
The value of the Cost of Capital (WACC_n) for ABC is 13.79%. As the company has remained nearly debt-free for the last five years, its cost of equity is almost equal to its cost of capital.
#1.2 Terminal Value
We’ve estimated the future free cash flows for the next 5 years only. What about the cash flows from the sixth year onwards? We are assuming that the company in consideration will last for a very long time.
In intrinsic value estimation, we must limit our future forecasting capability. Hence, beyond the fifth year, we resort to terminal value. There are two ways we can allot a terminal value to a company:
- Liquidation Method: We’ll assume that beyond the fifth year the company will cease to operate. Hence, all assets of the company will be liquidated. The liquidation value for the assets will be our terminal value. It is a conservative way to value any company.
- Perpetual Growth Method: Beyond the fifth year, the company will continue to grow at a constant rate forever. This type of estimation will give a more realistic valuation of any firm. But extra care must be taken to assume a suitable growth rate beyond the fifth year of operation. Even a small change in this number can drastically overvalue or undervalue a company.
In terms of formula, terminal value calculation by perpetual growth method can be done like this
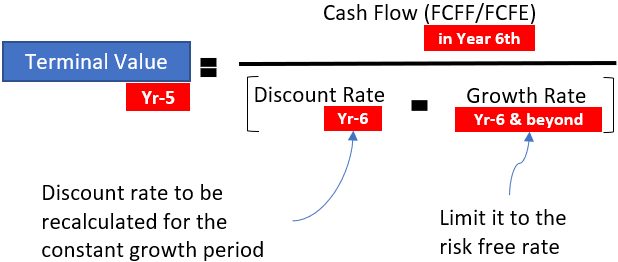
So, to calculate the terminal value we must calculate three additional numbers:
- Free Cash Flow of Yr-6th: There can be three types of free cash flows, dividend, FCFE or FCFF. For our example company ABC, we’ve calculated two types of FCFs. For practical purposes, either of the two will be sufficient.
- Discount Rate of Yr-6th: If we are considering FCFF as our free cash flow, the cost of capital (WACC) will be our discount rate. But remember that the WACC of the normal growth period and constant growth period are different. Here, we’ll have to recalculate the WACC.
- Constant Growth Rate of Yr-6 & Beyond: Experts say that any company cannot continue to grow at a fast growth rate forever. Suppose there is a company whose life is 200 years. In this lifetime, the average growth rate for the company will be limited. It cannot be greater than the growth rate of its economy. For a few years, the company can grow faster. But overall, its rate of growth cannot beat the GDP’s rate of growth. For our estimation, we’ll assume a constant growth rate below the risk- free rate.
Constraints in Constant Growth Period
Companies in constant & stable growth periods behave differently than normal growth companies. Hence, we must assume the following before doing our calculations:
- Beta = 1: Generally, they are mature companies. Their price movements mimic that of the Index like Nifty50, Sensex, or BSE100. Hence, it will be better to consider a beta one for them.
- D/E = Industry’s DE: As they are matured companies their size is big. They neither need excess debt not they can thrive on zero debt. Hence, assuming a debt-equity ratio equal to the industry average will be better.
- Reinvestment vs Dividend: Matured companies tend to share more dividends. But it is also necessary for them to ensure a constant growth rate. It’ll happen if they are reinvesting enough to ensure the assumed growth (risk-free rate).
- Return = Cost of Capital: In a constant growth period, the return on capital (ROIC/ROE) is almost equal to the cost of capital (WACC/Cost of Equity). Hence, assuming a higher growth rate in this phase will not increase the terminal value. Why? Because a high growth rate will demand a higher reinvestment rate. Higher reinvestment means decreased cash flow, hence the TV. Check the TV formula to picture the effect of reduced cash flow on TV. Hence. faster growth rates in this period are not effective.
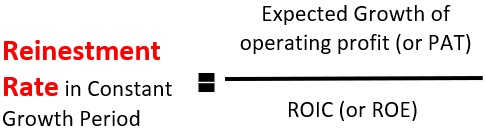
Reinvestment in a constant growth period is critical. How much the company shall reinvest? We can use this formula to quantify the numbers:
Calculating TV for ABC
Let’s apply the above rules to our example company ABC. But first, let’s read the assumptions:
- ABC will grow at a constant growth rate after the fifth year. This growth rate will not be greater than the risk-free rate. Assuming a time horizon of the next 20-years, the risk-free rate will be about 6% per annum.
- The Beta of ABC after the fifth year will be about one.
- The D/E = 0.9, its industry average.
- We’ll assume a cost of debt equal to 7.7% as calculated earlier.
What will be the cost of Equity (Ce_p) Cost of Capital (WACC_p)?
Let’s calculate it using the Ce formula:
Ce = Rf + Beta * Rp = 5% +1 x 5% = 10.0%
Now, let’s calculate the WACC using this formula:
WACC = Ce * E/(E+D) + Cd * D/(E+D)
= 10* 0.52 + 7.7*0.48 = 8.9%
[Please note that in the stable growth period, WACC = Return on Capital]
We’ll now calculate the Reinvestment Rate necessary or the constant growth period.
Reinvestment Rate = Expected Growth / ROIC = 6% / 8.9% = 67.41%
Termial Value
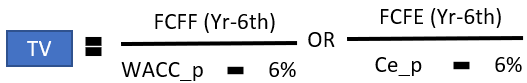
FCFF_6th = FCFF_5th * (1+6%) = 59,421 * 1.06 = 62,986
FCFE_6th = FCFE_5th * (1+6%) = 67.823 * 1.06 = 71,892
TV_fcff = 62,986 / (8.9% – 6%) = 752,886
TV_fcfe = 71,892 / (10 – 6%) = 764,808
The calculated terminal value of ABC based on our assumption is Rs.752,886 Crore (FCFF based) and Rs.764,808 Crore (FCFE based).
Present Value
Let’s calculate the Net Present Value of future cash flows for our example company ABC.
This is done by discounting the free cash flows of the first five years and the terminal value. The same is shown in the below screenshot.
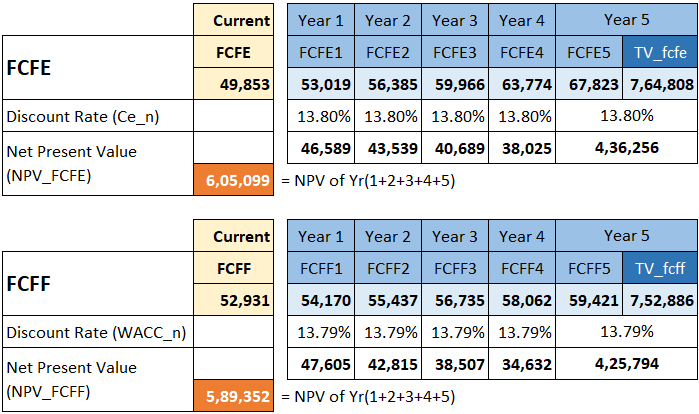
The intrinsic value of ABC is as below:
- Intrinsic Value (FCFE Based): Net Present Value of FCFE’s and Terminal Value = Rs.6,05,099 Crore.
- Intrinsic Value (FCFF Based): Net Present Value of FCFF’s and Terminal Value = Rs.5,89,352 Crore.
On per-share basis, the intrinsic value will come out as below:
Conclusion
In the Net Present Value estimation critical is to correctly estimate the future free cash flows. Once we are done with the FCFs, we need to focus on the correct values for the discounting rates. It is also important not to over and underestimates the growth rate during the constant growth period (terminal value phase).
If one can take care of these important things, intrinsic value estimation using the net present value concept will be more accurate.
In this article, I’ve tried to explain the concept of Intrinsic value estimation using the net present value concept in most tiny details. I hope you’ll love the intricacies of maths.
I know the mathematics side of Net Present Value estimation can get complicated. Hence, we’ve implemented the whole algorithm in our stock screener. There is a list of the top 850+ stocks whose intrinsic value is estimated and are readily available for subscribers upon click of a button.
Keep reading and have a happy investing.