
Among other metrics, our stock screener stands out because of two important numbers, the overall score, and intrinsic value. The intrinsic value of stocks is estimated based on a few standard financial models like DCF and a few of my own algorithms and logic.
But the overall score-rendering proved to be more complicated. Why? Because first, no proven scoring method is available to do it. Second, one must look at multiple aspects of the business to score it in overall terms, which is not straightforward.
Table of Contents
Introduction to the Overall Score
The overall score is derived from six tenets of the business, price valuation, future growth prospects, quality of the management, the profitability of the business, financial health, and above all the economic moat.

For parameters like price valuation, growth, health, and profitability, specific metrics are available for measurement. But the main challenge is the quantification of the economic moat and the quality of management. There are separate articles written on these two subjects. You can please follow their links to read more about them.
Once all the six components are individually quantified, we built an algorithm that converts them into a single value called the overall score. The quantification of the individual components is done by scoring them on a scale of zero to five. Zero is the lowest and five is the best score. A combination of these scores is then combined to render an overall score on a scale of 0% to 100%.
As a rule of thumb, a stock scoring an overall score of 75% plus and is also undervalued, falls under the investment-grade (disclaimer).

So, now we’ll see each of the individual parameters in more detail. Idea is to make the users of the stock screener aware of how the overall score is rendered in real-time.
#1. Price Valuation
To score a stock in terms of its price valuation, we first estimate its intrinsic value using multiple valuation models. Once the intrinsic value is estimated, we compare it to its current stock price. Depending on the degree of over or undervaluation, the stock is graded on a scale of 0 to 5. Five denotes undervalued and zero means most overvalued.
The valuation models used for intrinsic value estimation are shown below:
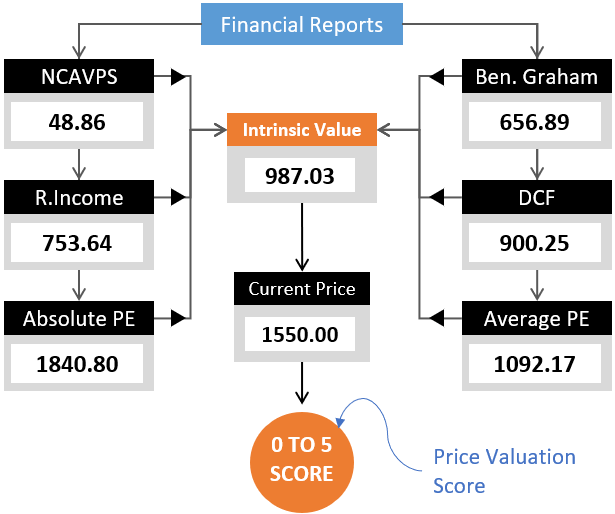
To know about the valuation models in detail, please check the following articles:
- Net Current Asset Value Per Share (NCAVPS).
- Benjamin Graham’s Formula.
- Discounted Cash Flow (DCF) Model.
- Absolute PE method.
- Residual Income Model.
#2. Profitability of Business
There are several metrics available to measure a company’s profitability. I’ve written a detailed article on how to measure the profitability of a company from its financial reports. In that article, you’ll find that there is a mention of six number ratios. The ratios described there are the following. Please check the links to access a detailed write-up on the topics.
- Gross Profit Margin.
- Operating Profit Margin.
- Net Profit Margin.
- Return on Asset (ROA).
- Return on Equity (ROE).
- Return on Capital Employed (ROCE).
Among all these six profitability/return ratios, ROCE is the most real-life representation of profitability. Hence, in my algorithm to score a company based on its profitability, I’ve used ROCE as the metric. To know why ROCE is a superior metric over others, I’ll suggest you read this article.
In addition to ROCE, the concept of owner’s Earnings is also used to quantify the profitability of a company.
But to make the estimation more realistic, some weightage is also given to the trend of ROCE and Owner’s Earnings. In order to earn a perfect score, a company must not only post a healthy ROCE and owner’s earnings, but it must also show growth. A falling trend will reduce the score.
The trend analysis is done for the periods of 3-Years, 5-Years, 7-Years, and 10-Years. Higher weightage is given to the recent trend than the 10-Year trend.

So, a combination of the absolute numbers, for ROCE and Owner’s earnings, and their trend analysis makes the profitability score more reliable.
#3. Future Growth
By looking at the past numbers, we can know how fast the company grew till today. But how to estimate the future growth rate of a company? Frankly speaking, it is one of the tougher codes to crack in company valuation. Looking at past growth rates of sales, profit, cash flows, net worth, assets, etc may give unsustainable and unreliable values.
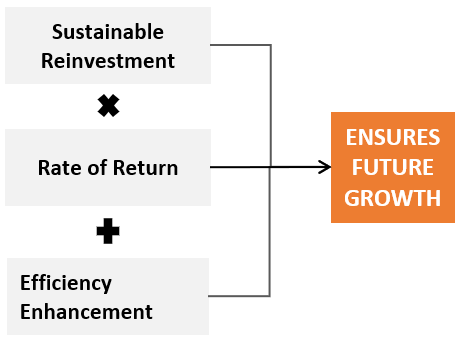
Hence, I decided to look at growth from the very basics. I tried to answer this question, how any business grows? There are three ways a company can grow its business:
- First, it must ensure that it is yielding a positive return on its invested capital ROIC).
- Second, it must try to improve the ROIC by reducing costs thereby improving operating profit.
- Third, it must grow its asset base and working capital that acts as fuel for future growth. This step is achieved by retention and reinvestment of net profits.
There is a separate article on how to identify stocks of fast-growing companies. In that article, you’ll find a formula that is useful for future growth rate estimation.
We can also understand the concept of growth like this. It is the invested capital that yields profit for a company. A formula that highlights this aspect of the business is called ROIC (Return on Invested Capital).
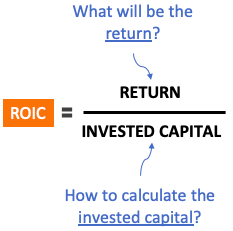
The company has the tendency to grow if its ROIC is not negative. For a given ROIC, a company will grow by increasing the corpus of its invested capital. Higher invested capital will also increase the return.
While infusing more capital into the business, the top management must ensure that it increases the return proportionally. Otherwise, ROIC will go down, and the effect of growth will get subdued.
My algorithm uses the below parameters to estimate a suitable growth rate for a company
[P.Note: There are two types of growth rates, normal period growth rate, and perpetual growth rate. In this article, we are talking about the normal period growth rate.]
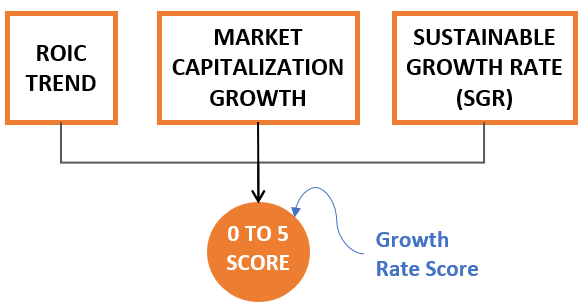
Suggested Reading: Sustainable Growth Rate (SGR)
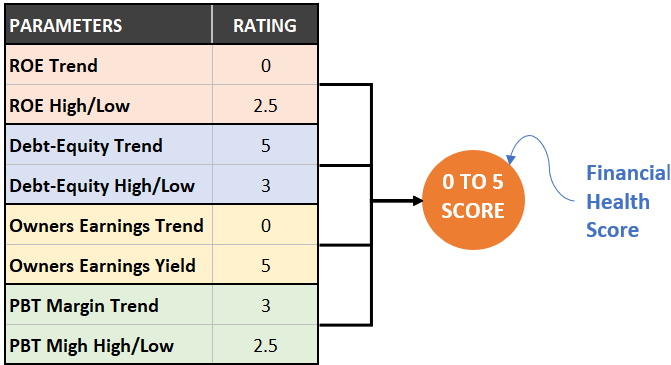
#4. Financial Health
I like to analyze the financial health of a company more from trend analysis than from absolute numbers. I know it is not a standard way, but it works. Before I talk more about the trend analysis I would like to point you to an article on the financial health of a company. There the concept is covered in more depth. I can assure you, that it will be worth a read.
The concept highlighted in the article is implemented in our algorithm to investigate the financial health of a company. The algorithm focuses on the debt level, return on equity, free cash flow, and PBT margin to render the financial health score.
#5. Quality of Management
There is a separate detailed article on the topic of quality of management. It is the basic concept on which I’ve built the algorithm for management analysis and its scoring. Here I’ll present to you a summarized version of what builds the management score of the stock screener.
What is the role of a company’s top management? This is the question based on which all parameters were selected to quantify the quality of a company’s management team.
The top management must see and manage the business from a macro level (as much as possible). Though at times only macro-management may not be sufficient. The micro-management must be delegated to an able team. What’s visible about a company from a macro level?
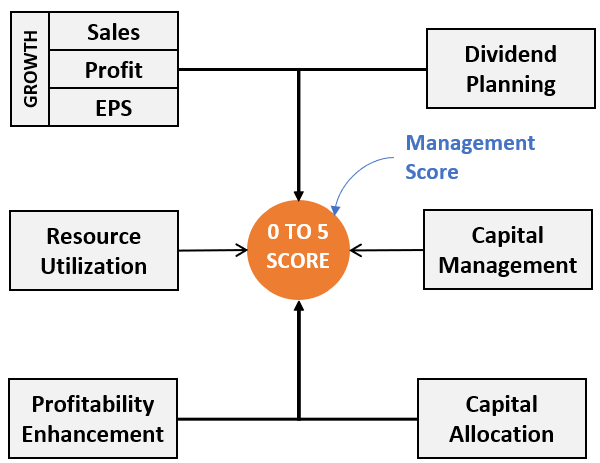
To the top management, the above six variables will be most visible. Our algorithm scores the efforts of the management based on these six parameters.
#6. Economic Moat
Moat is a term used by Warren Buffett for companies with a competitive advantage (monopoly business). Buffett loves companies with a wide economic moat. I’ve written a detailed article on the economic moat. There I’ve explained the concept of a wide and narrow moat that is used in our stock screener to give scores to companies.
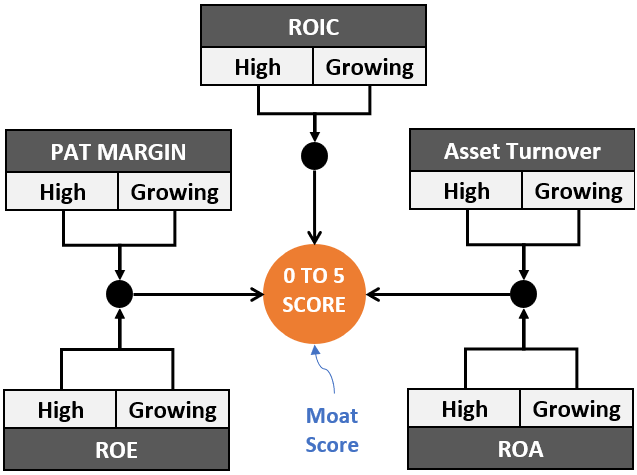
It is not so straightforward to judge the competitive advantage of a company just by looking at its financial reports. So, how to identify such companies? I’ve taken an easy approach. I tried answering a simple question. What is a typical characteristic of a monopoly business?
They have an extremely high pricing power. As a result. their margins are high and tend to improve with time.
My algorithm uses the following metrics to check and quantify moat and render it as a score on a scale of zero to five.
Conclusion
Experts tell us to invest in strong companies at the right price. To understand if a company is strong or not, one must analyze the company holistically. My overall score algorithm consists of six components. Together, these six parameters help us to screen almost all aspects of the business (directly or indirectly). The output of this screening is the overall score. A high overall score is an indication of a company being fundamentally stronger than its peers.
Overall Score Breakup Theme – Check the six component scores obtained by premium stocks in or stock screener WebApp.


How often the Overall score, GMR Score and Intrensic value will change. Is there any period of time or day to day change in stock price.
Generally speaking, both scores are majorly impacted by the business fundamentals. It means major changes will be visible only once each year. There will also be changes as quarterly reports are updated. Minor changes are also observed with daily price movements.
This is how its algorithm is written.
Thanks for asking.
gmr score means what?
It is a theme-based score. Themes can be undervaluation, growth, profitability, etc.