
PEG ratio is a useful valuation metric for stock investors. Potential investors can use it to gauge if a stock is overvalued or undervalued.
PEG is a ratio which establishes a correlation between company’s price valuation with its future growth prospects (see here).
We are more conversant with the use of P/E ratio (Price to Earnings Ratio). PE provides a quick-check on the price valuation.
As a general rule of thumb, a P/E multiple below 15 is considered low (good). But with time, it seems that the PE15 rule has become obsolete. Read: Low P/E stocks.
Good stocks often trade at a much higher P/E multiples. Example: stocks like HUL, Britannia, Marico, Titan etc trades at more than PE50 multiples.
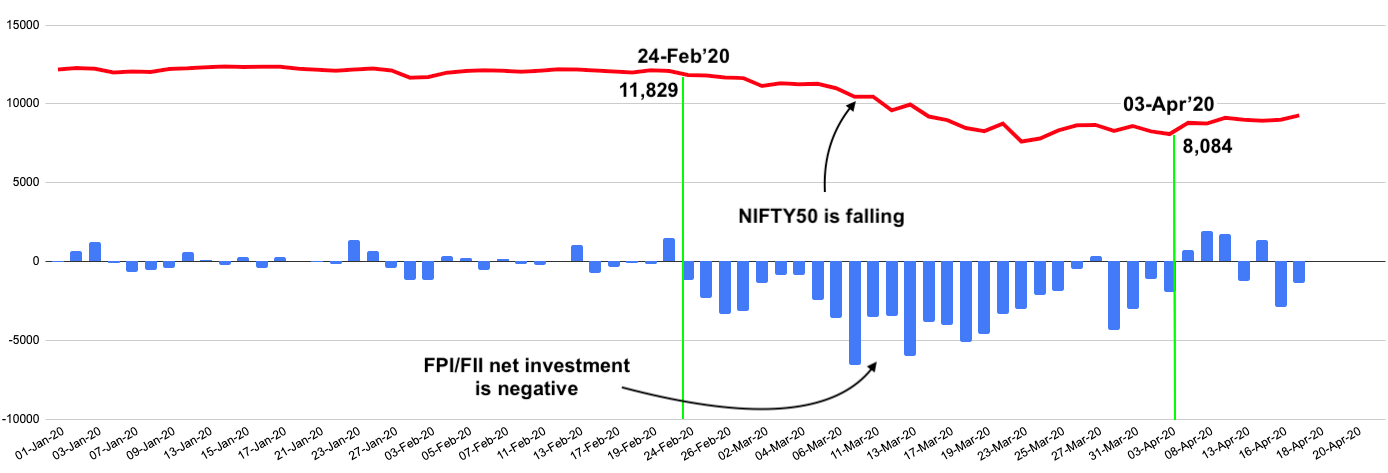
If it is so, how come FII & DII’s still buy these stocks? The reason is perhaps hidden in their PEG multiples. We will read about it here. See: Effect of FII investment on NIFTY 50 (Mar’20).
PE, PEG & EPS-Growth Relationship

As you can visualize from the above infographics, PEG ratio actually factors-in both price valuation and the stock’s future growth prospects. If handled correctly, PEG can prove to be a reliable intrinsic value pointer. So let’s see two of its components:
- P/E Ratio: Price to Earning ratio (P/E) is a ratio between stock’s current price (P) and earning per share (EPS). It is a metric which tells us how high is the stock selling compared to its EPS [PE = P / EPS]. As a general rule, when P/E multiple is 15 or below, it is considered good. Read: Significance of low P/E.
- EPS Growth: Ideally, Earning Per Share (EPS) of good company’s grows with time. EPS is a ratio between company’s net profit and its number of shares (EPS = PAT / Shares). From an investors point of view, EPS growth rate matching inflation is a minimum expectation. Read: High EPS stocks.
While calculating PEG ratio, we are actually valuing the company’s stock price by also considering the “expected future EPS growth rate”. Here one assumes a future EPS growth rate based on EPS trend of the past years.
[P.Note: New investors must note that EPS has the most direct influence on company’s stock price]
How to calculate PEG Ratio?

The theory of PEG gained it’s popularity when Peter Lynch started to use it as one of his valuation metrics. This almost changed the way people looked at high and low P/E stocks – as taught to us by Benjamin Graham.
Benjamin Graham liked stocks which had PE below 15. But does it mean that all stocks having PE above 15 are bad? No. How we can see PE above 15 stocks differently? This is where the theory of PEG becomes handy. What is the theory?
High PE stocks with low PEG ratio can still be treated as undervalued. These are stocks which has high future growth prospects (mainly EPS growth).
Example #1
Let’s try to value a real-life stock using the PEG metric. Our example stock will be HUL. Stock metrics of HUL which can lead us to its PEG multiple is shown in the below infographics.

The above infographics shows the PEG of HUL, based on last 5 years data, as 7.07. As a general rule, PEG above 1 is considered overvalued. Hence, we can say that HUL’s share is extremely overvalued. Read: About value investing.
But for a moment, forget about HUL being overvalued or undervalued. Why? Because I would like a use this example to show you how to read the numbers of PEG. This understanding will help us to realise what it actually means by PEG values – less than one, more than one, very high PEG etc.
- PEG < 1: The lower is the PEG number the better. When PEG of a stock is less than 1, at that market price, the stock is undervalued. . At those price levels, there is a good chance that the market price will move up in times to come. Why price will go up? Because EPS will grow and this will push the price up. How much the price will go up? At least till that level where PEG ratio becomes one.
- PEG = 1: At price levels where PEG is equal to one, we can say that price is already in-sync with its future growth prospects. It means, the market price has already factored in the future-growth potential of the stock. From these price levels (PEG:1), there is equal chances of price moving up or down.
- PEG > 1: The higher is the PEG, more overvalued is the stock. At these price level, there is a strong tendency for the stock-price to go down. The higher is the PEG ratio, lower will be the possibility of stock’s price to go up.
Example #2

Let’s use our learnings in example #1 to understand the valuation of HDFC and Ultratech Cement.
- HDFC: Current price of HDFC is Rs.1,774, and its EPS is Rs.102.6. This makes its P/E as 17.29 (=1774/102.6). Considering the last 5 years EPS growth rate of 17.97% p.a, PEG of HDFC comes out to be 0.96 (=17.29/17.97). As PEG of HDFC is just below 1, we can say that HDFC’s stock is slightly undervalued.
- Ultratech Cement: Current price of Ultratech is Rs.3,871, and its EPS is Rs.189. This makes its P/E as 20.48 (=3871/189). Considering the last 5 years EPS growth rate of 16.96% p.a, PEG of Ultratech comes out to be 1.21 (=20.48/16.96). As PEG of Ultratech is above 1, this stock looks overvalued at current price levels.
Limitations of PEG Ratio
PEG may not be suitable for large companies (like blue chip stocks). Why? Because these companies may have reached a point of saturation. As a result their future growth numbers are smaller. This also means that their EPS growth rate will be small.
As their EPS growth rate is small, hence their market price appreciation is also slower (compared to growth stocks). Hence these stocks reward it’s investors more through dividend payment than by price appreciation. PEG does not account the dividend yield to value its market price.
Moreover, just because they are large blue chip stocks, their stocks are always in high demand. As a result their P/E multiples are high. Considering this, if such stocks will display low EPS growth rate numbers, their PEG will always be high.
But this does not means that these stocks are always overvalued. Hence, to value such companies PEG ratio may not be a sufficient tool. What is the alternative? It is better to opt for a more detailed analysis of such stocks.
A more reliable valuation technique is estimation of intrinsic value using models like Discounted Cash Flow (DCF) method.
Quick Tip: It is better to use PEG ratio is an initial valuation indicator. A more detailed analysis must be done before committing to any stock. Decision making just on basis of PEG shall be avoided. I use my stock analysis worksheet to get more clarity about my stock’s price valuation and it’s fundamental strength.
Clarity about low EPS growth Rate
Low EPS growth does not always mean the business is bad. There can be conditions where, due to external factors, EPS growth rate of company may be low (temporarily).
Low EPS growth rate may result in higher PEG ratio. Like, what was happening with pharma stocks till a couple of months back. But this did not mean that these companies were bad. People who had invested in those companies say in year 2018, 2019 have seen windfall gains amid COVID-19 stock rally.
So what is the point? When we calculate PEG ratio, we do with historical EPS data. But beaten down stocks (like Pharma), past EPS growth may not be a good representation of what is going to come in future.
How to use PEG ratio as a tool

PEG is one of the financial ratios which can be used in the process of fundamental analysis of stocks. For example, consider fundamental analysis as a full FAT text book. In this text book, PEG ratio is one of topics which talks about price valuation.
The point I’m trying to push here is that, fundamental analysis of a company is a huge task. We should not misunderstand it as if it can be done by using few financial ratios (like P/E, P/B, PEG etc).
Professional value investors spends months together on a company to do its detailed fundamental analysis. Why it takes so much time? Because they read 10+ years annual reports. They spend considerable time in doing number crunching of data indicated in financial reports.
The bigger idea of these pro-investors is to first understand the company, and then make an estimation of its intrinsic value. This is what value investing is all about. This is how Warren Buffett thinks and takes decision of buying or selling a business.
If we think that PEG ratio is an enough indicator to judge intrinsic value of stocks, then we are mistaken.
So how to use PEG ratio for stock analysis? Use it as your first indicator. How to do it?
First prepare your list of favourite/target stocks. In this list, stock whose PEG ratio is high, ignore them for the moment. You can target those stocks which has PEG close to 1 or below. Do a more detailed fundamental analysis of these stocks. Idea should be to unearth their intrinsic value. Read: Warren Buffett rules of investing.
Final Step

Low PEG number means stock is undervalued, and high PEG indicates overvaluation. But it will be good for investors to handle PEG ratio with utmost caution. Why? Because it has potential for gross miss-interpretation. How I use PEG?
- First: I always have my list of top stocks ready. I keep tracking my stock’s price with reference to how the indices are performing (like Nifty-50, BSE 500 etc). When I prepare my list of stock, I make it a point to include their PEG ratios (TTM, 3Y & 5Y) mentioned in this list.
- Second: When I see a stock whose PEG is close to one, it is an indication of undervaluation. But here I ask my first question? What is the current price trend of this stock? If the price is already at its peak, there are more chances of correction, even though PEG is close to one (or even below). I would rather wait for a correction and then take the next step. Meanwhile, I will go for its intrinsic value estimation.
- Third: When PEG is close to one, I would open the companies annual reports and try to know more about the company. I would also read about the SECTOR in which the stock is operating. Idea is to make a guess about the future growth prospects of its business. After making these studies, I would project a EPS growth (EPSG) number for next 5 years. Based on this EPS-G number, if PEG is coming about 0.6-0.7, I will buy this stocks and hold it for at least next 3 years.
No matter how high is the company’s P/E ratio, if its future growth potential supports that P/E, the stock is worth investing in. Probably this is the reason why stocks like HUL, even though trading at PE70 multiples, still has good demand among stock investors.
P.Note: The more popular is the stock, more effective is the impact of PEG ratio on its current price levels. Suppose a stock like HUL falls to PEG below 1 (say in COVID like crisis), I think, it will not take more than a month for such stock bounce back to it’s previous highs. Read: About stock market correction.

बहुत ही ज्ञानवर्धक लेख।
Your articles are educative and well written.
Read today and keep up the good work
Your blogs are wonderful!
It is so simple
It teaches finance for non-finance people.
Keep it up!
Regards,
Balaji
Thank you.
Thanks once again for the well articulated in regard to defining PEG ratio, your inputs are helping me out to identify/analyse the companies to invest.Your explanations will be of great help in the decision making and our approach towards investments.
Thanks once again and look forward many more articles from you.Honestly your language of writing of financial terms are easy to understand for any lay man who is keen to know about finance.
Thanks for an awesome feedback.
I chanced upon your articles just today and they were really valuable and explained very well.Thanks Mani!
The pleasure is mine. Thanks.
Wonderful. I enjoyed reading. Thanks for in simple language.
My pleasure. Thanks.
Thanks Mani for your valuable writings.
Comppany like Hind. Unilever the PEG is always above 5. it means we should not buy this stock?
for all FMCG PEG is always above 2 what to do in this senarios.
Leo
On the face of it, high PEG means overvaluation.
But a second check is better (by estimation of intrinsic value).
Thanks for your comment.
Wow to this website. v good articles with crystal clear understanding.
How EPS growth is calculated? Pls show with examples….if this calculation covered in your worksheet?
Long term EPS growth rate is calculated using CAGR formula.
I recently started reading your blogs and they are amazing . I could easily say that your blogs gave me wider perspective about true value investing using PE ratio,PEG ratio these kinda terms which i never heard of while investing in stocks….
What is Cagr formula?
How do we know that our Cagr figure is accurate… bacause we are just assuming the gwoth rate based on past growth rate…
Is there any way or formula where we can get a clear and almost about right Cagr
Thank you
Thanks for asking.
CAGR = [(EPSn/EPS)^n – 1]
Future growth rate can only be estimated by seeing into the past.