The Price to Free Cash Flow (P/FCF) ratio is a valuation metric that compares a company’s stock price to its free cash flow. By dividing the stock price by the free cash flow per share, the P/FCF ratio provides insight into how much investors are willing to pay for each unit of cash generated by the company. A lower P/FCF ratio suggests that the stock may be undervalued, while a higher ratio may indicate overvaluation. It is a valuable tool for evaluating a company’s cash flow efficiency and potential investment value.
Introduction
Valuation ratios are key tools used in stock analysis to assess the relative value of a company’s stock. They provide a quantitative measure of a stock’s price in relation to various financial indicators such as earnings, cash flow, or book value. By comparing these ratios to industry benchmarks or historical values, investors can gauge whether a stock is undervalued or overvalued.
But using multiple valuation metrics is crucial in assessing a stock’s value. Different ratios provide different perspectives on a company’s financial health and market perception. Relying on a single metric may overlook important factors or introduce biases. By considering a range of valuation ratios, investors can gain a more comprehensive understanding of a stock’s valuation and make more informed investment decisions.
The Price to Free Cash Flow (P/FCF) ratio is a valuation metric that compares a company’s stock price to its free cash flow. It offers insight into how the market values a company’s stock relative to the cash it generates after accounting for operating expenses and capital expenditures. By dividing the stock price by the free cash flow per share, the P/FCF ratio helps investors assess whether a stock is trading at a premium or discount based on its cash flow generation. This ratio is particularly useful in evaluating a company’s ability to generate and manage its cash flow efficiently.
Let’s read more about it.
Understanding Free Cash Flow (FCF)
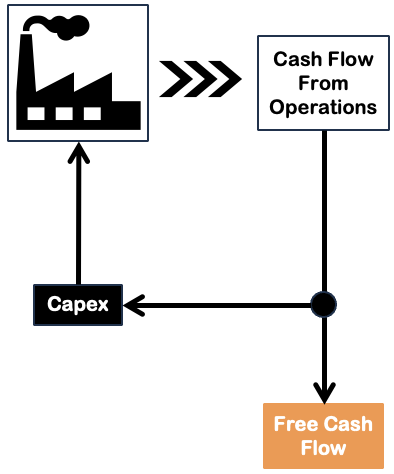
Free cash flow (FCF) represents the cash generated by a company after accounting for operating expenses and capital expenditures. It is a crucial measure of a company’s cash generation potential as it reflects the amount of cash available for various purposes. The purpose could be like reinvesting in the business, paying dividends, reducing debt, or pursuing growth opportunities.
FCF is calculated by subtracting capital expenditures (such as investments in property, plant, and equipment) from the operating cash flow (the cash generated from core business operations). It provides a clearer picture of a company’s financial health than other metrics like net income, as it focuses on the actual cash available to the company. Read more about free cash flow (FCF) here.
The significance of FCF lies in its ability to indicate whether a company is generating sufficient cash to support its operations and growth initiatives.
- Positive FCF suggests that the company has surplus cash, which can be used for expansion, debt reduction, or rewarding shareholders.
- On the other hand, a negative FCF could indicate that the company is struggling to generate enough cash to meet its financial obligations.
Price to Free Cash Flow (P/FCF) Ratio
The Price to Free Cash Flow (P/FCF) ratio is a valuation metric that compares a company’s stock price to its free cash flow. It provides insight into how much investors are willing to pay for each unit of free cash generated by the company.
The Formula
The calculation of the P/FCF ratio is relatively straightforward. It involves dividing the market price per share of the company’s stock by its free cash flow per share. The formula is as follows:
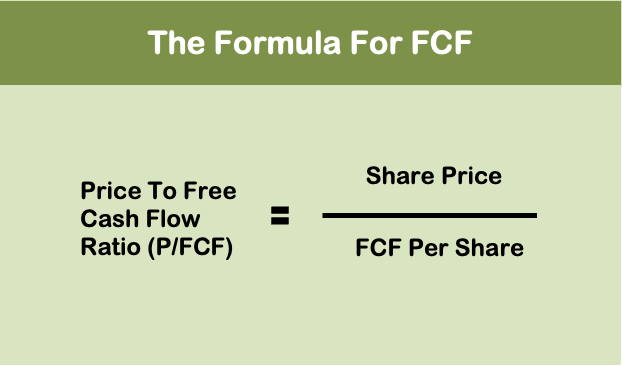
The stock price per share can be obtained from the market, while the free cash flow per share is calculated by dividing the total free cash flow generated by the company by the number of outstanding shares.
For example, if a company has a stock price of Rs.50 per share and generates a free cash flow of Rs.2 per share, the P/FCF ratio would be 25 (calculated as 50 / 2). This means that investors are paying 25 times the company’s free cash flow for each share they purchase.
A comparison of the P/FCF ratio of a company to its industry peers or historical values is useful. This way, the investors can assess whether the stock is trading at a premium or discount relative to its free cash flow generation. A lower P/FCF ratio suggests the stock may be undervalued, while a higher ratio may indicate overvaluation.
Why P/FCF ratio analysis is important
The rationale behind using the Price to Free Cash Flow (P/FCF) ratio as a valuation metric is justified. It stems from the importance of cash flow in assessing a company’s financial health and investment potential. Here are a few key reasons why the P/FCF ratio is commonly used:
Reasons
- Focus on Cash Flow: Unlike other financial metrics such as income or PAT, the P/FCF ratio directly considers the company’s ability to generate cash. Cash flow is a vital indicator of a company’s financial strength. It reflects its actual cash-generating capability and liquidity.
- Cash Availability: Free cash flow represents the cash available after covering operational expenses and capital expenditures. It provides insight into the funds a company can use for various purposes. Such as reinvesting in the business, paying dividends, reducing debt, or pursuing growth opportunities. The P/FCF ratio allows investors to assess the value placed on this available cash.
- Flexibility and Stability: Cash flow is often considered more stable and reliable than other financial metrics. Why? Because it is less susceptible to accounting adjustments or non-cash items. The P/FCF ratio helps investors gauge the stability and flexibility of a company’s cash flow generation.
- Future Growth Potential: Evaluating a company’s valuation based on its free cash flow allows investors to consider the potential for future growth. A higher free cash flow may indicate a company’s capacity to invest in the business. The investment can be in R&D, expanding operations, or pursuing acquisitions. This in turn will drive future income and profits.
- Comparison with Peers: A comparison of a company’s P/FCF ratio to its industry peers or historical values is helpful. It can help identify relative strengths and weaknesses. It provides a benchmark for assessing whether a stock trades at a premium or discount compared to similar companies in the same industry.
The Market Likes Company’s Cash Flow Generation Ability
The Price to Free Cash Flow (P/FCF) ratio relates to the concept of cash flow and market value. It provides insight into how the market values a company’s cash flow generation. Here’s how it connects to these concepts:
- Cash Flow: The P/FCF ratio directly incorporates the company’s cash flow into the valuation process. The P/FCF ratio highlights the relationship between the company’s cash flow and its market value.
- Market Value: The P/FCF ratio reflects the market’s perception of a company’s cash flow potential and its willingness to pay for that cash flow. A higher P/FCF ratio suggests that the market values the company’s cash flow at a premium. It indicates an optimistic view of the company’s prospects. Conversely, a lower P/FCF ratio may imply that the market values the company’s cash flow at a discount.
Interpreting the P/FCF Ratio
Interpreting the Price to Free Cash Flow (P/FCF) ratio in terms of stock valuation involves assessing whether the ratio indicates undervaluation or overvaluation. Here’s how to interpret the P/FCF ratio:
- Lower P/FCF Ratio (Undervaluation): A lower P/FCF ratio suggests that investors are paying less for each unit of free cash flow generated by the company. This may indicate a potential undervaluation of the stock. It could imply that the stock is priced attractively compared to the cash flow it generates. Such a stock presents an opportunity for investors to consider purchasing the stock.
- Higher P/FCF Ratio (Overvaluation): Conversely, a higher P/FCF ratio may indicate that investors are paying a higher premium for each unit of free cash flow. This could imply the potential overvaluation of the stock. It suggests that the market is valuing the company’s cash flow at a higher multiple. This can possibly exceed what is considered reasonable based on the company’s financial performance. In such cases, investors may want to exercise caution or consider the potential risks associated with an overvalued stock.
It’s important to note that the interpretation of the P/FCF ratio should consider other factors. The factors could be industry norms, growth prospects, and overall market conditions. Comparing the P/FCF ratio to industry peers and historical values provides additional context for a more accurate interpretation.
For a comprehensive valuation analysis, it is recommended to use the P/FCF ratio in conjunction with other valuation metrics, such as:
- P/E ratio (Price to Earnings),
- P/S ratio (Price to Sales), or
- Dividend Yield.
A holistic approach that combines multiple metrics helps to paint a more complete picture of the stock’s valuation and assists in making informed investment decisions.
Low Vs High P/FCF Ratio
A low Price to Free Cash Flow (P/FCF) ratio suggests the possible undervaluation of a stock. While a high P/FCF ratio indicates possible overvaluation. Here are the implications of each scenario:
- Low P/FCF Ratio (Possible Undervaluation):
- Investment Opportunity: A low P/FCF ratio may indicate that the stock is priced attractively relative to its FCF generation. It suggests that investors are currently paying less for each unit of cash flow the company generates. This could present an investment opportunity, as the stock may have the potential for future price appreciation.
- Market Misjudgment: A low P/FCF ratio could suggest that the market may be underestimating the company’s growth prospects, financial stability, or future cash flow potential.
- High P/FCF Ratio (Possible Overvaluation):
- Risk of Overpaying: A high P/FCF ratio indicates that investors are paying unreasonably higher premiums for each unit of FCF It suggests that the stock may be priced above its reasonable valuation based on its cash flow generation.
- Expectations and Growth Outlook: A high P/FCF ratio could imply that the market has high expectations for the company’s future growth or cash flow prospects. It may suggest that investors are willing to pay a premium due to the anticipation of strong future earnings and cash flow expansion. However, there is a risk that the company may not meet these lofty expectations.
- Caution Required: Investors should exercise caution when faced with a high P/FCF ratio. It is crucial to thoroughly evaluate the company.
Industry & Peer Comparison of P/FCF
Comparing the Price to Free Cash Flow (P/FCF) ratio against industry peers and historical values is crucial. It will give a better context and understanding of a company’s valuation. Here’s why this comparison is important:
Importance
- Industry Comparison: Different industries have varying norms and dynamics, including variations in capital intensity, growth rates, and profitability. Comparing a company’s P/FCF ratio to its industry peers helps to assess its relative valuation within the specific industry. If a company’s P/FCF ratio is significantly higher or lower than its peers, it may indicate a potential overvaluation or undervaluation, respectively. Understanding industry benchmarks is essential for accurate valuation analysis.
- Relative Performance: Examining a company’s P/FCF ratio over time allows for comparison against its own historical values. By assessing changes in the ratio, investors can gauge the company’s financial performance. This way it is easy to judge if the valuation has become more attractive or less favorable. It helps identify trends and potential deviations from historical norms. It provides insights into a company’s financial health and trajectory.
- Identification of Outliers: Comparing the P/FCF ratio against industry peers and historical values can help identify outliers. These are companies that significantly deviate from the norm. Outliers may indicate unique characteristics, such as superior cash flow generation, market expectations, or potential concerns. Identifying these outliers prompts further investigation and analysis to understand the underlying reasons for the deviation.
- Valuation Range: Industry peers and historical values provide a range of P/FCF ratios against which a company’s valuation can be assessed. This range helps investors assess whether a stock’s P/FCF ratio is within a reasonable range. It adds a benchmark for evaluating the stock’s valuation.
Pros and Cons of Using (P/FCF) Ratio
Using the Price to Free Cash Flow (P/FCF) ratio as a valuation metric has its pros and cons. Let’s explore them:
Pros:
- Focus on Cash Flow: The P/FCF ratio considers a company’s cash flow. FCF is a critical indicator of its financial health and ability to generate real cash. It provides a clearer picture of a company’s financial performance than metrics based on accounting earnings alone.
- Relative Valuation: The P/FCF ratio allows for easy comparison of a company’s valuation to industry peers or historical values. This relative valuation approach provides context and helps identify potential undervaluation or overvaluation of a stock.
- Cash Flow Perspective: By incorporating cash flow, the P/FCF ratio provides insights into a company’s ability to grow. FCF can fund operations, invest in growth, pay dividends, reduce debt, and withstand economic downturns. It highlights the actual cash available to the company for various purposes.
- Stability and Flexibility: Cash flow is generally considered a more stable and reliable measure than earnings. It is less prone to manipulation or accounting distortions. The P/FCF ratio, therefore, provides a more stable basis for valuation and analysis.
Cons:
- Limited Focus: The P/FCF ratio focuses solely on the cash flow aspect. It does not consider other fundamental factors such as growth prospects, industry dynamics, competitive advantage, or qualitative aspects of the business. Hence, it should be used in conjunction with other metrics to gain a comprehensive understanding of a company’s value.
- Variability in Cash Flow: Cash flow can fluctuate significantly from year to year. It is especially true for companies operating in a cyclical industry. Relying solely on the P/FCF ratio may not capture this cyclical nature of business.
- Industry-Specific Considerations: Different industries have varying capital requirements, growth rates, and cash flow characteristics. Comparing P/FCF ratios across industries may not provide an accurate assessment.
- Ignoring Debt and Capital Structure: The P/FCF ratio does not explicitly account for a company’s debt levels or its capital structure. This omission may overlook important factors that affect a company’s financial health and risk profile.
Comparison Between P/E and P/FCF Ratio
Both P/E and P/FCF ratios are valuable valuation ratios. But their effectiveness can vary depending on the specific circumstances and objectives of the investment expert. Here’s a comparison to help you understand their relative effectiveness:
Comparison
P/E Ratio: The P/E ratio is widely used and well-known in the investment community. It compares a company’s stock price to its earnings per share (EPS).
- Pros: The P/E ratio is simple to calculate, readily available, and provides insights into the market’s valuation. It is particularly useful for assessing profitability and growth potential.
- Cons: The P/E ratio relies on reported earnings (PAT). The PAT can be subject to accounting adjustments and one-time events. It may not capture the complete picture of a company’s financial health. It is especially true for companies with irregular earnings or high capital expenditure requirements.
P/FCF Ratio: The P/FCF ratio compares a company’s stock price to its free cash flow per share, which represents the cash available after accounting for operating expenses and capital expenditures.
- Pros: The P/FCF ratio focuses on cash flow. FCF is a more stable indicator of a company’s financial performance. It provides insights into a company’s ability to generate cash, invest in growth, and pay dividends.
- Cons: The P/FCF ratio may not capture growth opportunities or qualitative aspects of a business. It does not consider a company’s debt levels or capital structure explicitly.
My take
The choice between P/E and P/FCF ratios depends on the investor’s priority. If the investor prioritizes profitability and growth potential, the P/E ratio may be more effective. However, if the investor is focused on cash flow generation and financial stability, the P/FCF ratio may be a more suitable metric.
In practice, investment experts often use both ratios in conjunction with other valuation metrics. The other valuation metric that uses FCF more holistically is discounted cash flow (DCF) analysis. It gives a more comprehensive understanding of a company’s valuation.
Case Study and Examples
Here are two real-world examples of how the Price to Free Cash Flow (P/FCF) ratio can be applied to evaluate stock valuations:
For Example
- Reliance Industries Limited (NSE: RELIANCE):
- As of the current date, let’s assume Reliance Industries has a stock price of Rs.2,500 per share and an annual FCF of Rs.50 per share (assuming).
- Calculating the P/FCF ratio: P/FCF = Stock Price / Free Cash Flow = 2500 / 50 = 50.
- Interpreting the result: A P/FCF ratio of 50 suggests that investors are willing to pay 50 times the annual FCF generated by RIL. This ratio indicates the market’s valuation of the company’s cash flow relative to its stock price.
- Comparison: To assess whether the stock is undervalued or overvalued, let’s compare it to the P/FCF ratio of its industry peers or historical values. Let’s say the industry average P/FCF ratio is 35. A P/FCF ratio of 50 may suggest potential overvaluation.
- HDFC Bank Limited (NSE: HDFCBANK):
- Assuming HDFC Bank has a stock price of INR 1,500 per share and an annual free cash flow of INR 75 per share (assuming).
- P/FCF calculation: P/FCF = 1500 / 75 = 20.
- Interpretation: With a P/FCF ratio of 20, investors are willing to pay 20 times the FCF.
- Comparison: If the industry average P/FCF ratio is 25, a P/FCF ratio of 20 may indicate potential undervaluation.
Example of Comparison Method
Comparing and contrasting the Price to Free Cash Flow (P/FCF) ratios of different Indian companies or industries can showcase the utility of this valuation metric. Here’s an example:
Two Industries For Example
- Information Technology Industry:
- TCS: Assume TCS has a P/FCF ratio of 30.
- Infosys: Assume Infosys has a P/FCF ratio of 25.
- Wipro: Assume Wipro has a P/FCF ratio of 20.
- Interpretation: In this scenario, the P/FCF ratios of the three major IT companies indicate varying market valuations of their cash flow generation. TCS has a higher P/FCF ratio of 30. It suggests that the market is willing to pay a higher premium for each unit of its free cash flow. Wipro, with a lower P/FCF ratio of 20, indicates a comparatively lower valuation. The varying ratios reflect differences in how the market perceives the company’s current and future prospects.
- Banking Industry:
- HDFC Bank: Assume HDFC Bank has a P/FCF ratio of 25.
- ICICI Bank: Assume ICICI Bank has a P/FCF ratio of 15.
- Axis Bank: Assume Axis Bank has a P/FCF ratio of 18.
- Interpretation: Comparing the P/FCF ratios of these banks, HDFC Bank has a relatively higher P/FCF ratio of 25. ICICI Bank and Axis Bank have lower ratios of 15 and 18, respectively. It suggests a higher valuation for HDFC and a lower for ICICI and Axis.
By comparing the P/FCF ratios of different companies within an industry, investors can gain good insights. They will know how the market values the cash flow generation. This way the investors can easily make relative assessments of valuations.
Conclusion
The P/FCF ratio serves as a valuable valuation metric for investors seeking to evaluate stock prices relative to a company’s FCF.
Throughout this article, we explored the significance of the P/FCF ratio in assessing stock valuations. We highlighted its calculation, rationale, and interpretation. This article is emphasizing the importance of comparing it against industry peers and historical values for better context.
We discussed how the P/FCF ratio relates to the concepts of cash flow and market value. It highlights its focus on cash flow and its ability to provide insights into a company’s cash generation potential. Additionally, we highlighted the pros and cons of using the P/FCF ratio. We’ve acknowledged its strengths in focusing on actual cash flow and facilitating relative valuations. We have also recognized its limitations in isolation.
It was emphasized that the P/FCF ratio should not be used in isolation but rather in conjunction with other fundamental analysis tools. By combining the P/FCF ratio with qualitative assessments, financial statements, growth prospects, and industry dynamics, investors can form a more comprehensive evaluation of a company’s value.
We encourage readers to consider the P/FCF ratio as a valuable tool in their stock evaluation process. By incorporating it alongside other fundamental analysis tools, investors can gain a deeper understanding of a company’s financial health. A holistic approach will enable informed investment decisions and help navigate the complexities of the stock market.
Suggested Reading: Relative Price Valuation – A Method To Compare Stocks & Judge It’s Value


“Interpreting the result: A P/FCF ratio of 50 suggests that investors are willing to pay 40 times the annual FCF generated by RIL. This ratio indicates the market’s valuation of the company’s cash flow relative to its stock price.”
In the above paragraph a correction is required. In place of “pay 40 times” it should be “PAY 50 TIMES”.
Corrected. Thanks