
What is relative price valuation? Allow me to explain it using two hypothetical examples.
- Single Stock: Suppose there is only one company listed in a stock market. Everyone trades only that stock. As a result, the P/E ratio of that stock has become 98. Now, a new company got listed in the market. The P/E ratio of that stock in its IPO stage was 50. Comparing a PE98 with a PE50 company, surely the latter looks cheap, right? When we compare the P/E of the two companies, we are actually doing a relative price valuation.
- Single Industry Market: Suppose companies of only one industry, banking, got listing in the stock market. There are 25 banks listed having an average P/E and P/B ratio of 30 and 2.5 respectively. The biggest bank that got listed (ABC) listed has a P/E ratio of 62 and a P/B ratio of 4.5. Comparing the industry average numbers with ABC, ABC looks very expensive. When we compare the P/E of companies with their industry average, we are again doing a relative price valuation.
To judge the valuation of a company, we can compare the company with its peers and the industry as a whole. This type of comparative valuation is what’s called relative price valuation.
Relative Valuation Vs Absolute Valuation
One example of an absolute valuation model is the Net Present Value (NPV) calculation. There we try to estimate the intrinsic value of a company based on the following three factors:
- Present free cash flow.
- Expected future growth rate.
- The risk associated with the future cash flow generation.
We use the first two metrics to calculate the future free cash flows. The third metric is used as a discounting factor to calculate the present value of the future cash flows. In this type of analysis, there is no need for data from peer companies or industries. The judgment of over or undervaluation is done by comparison between the current price of the stocks with the calculated NPV.
In the relative valuation approach, the decision about over or undervaluation is made by comparing the metrics of the reference company with its peers and industry average. For example, a company with a lower P/E ratio or EV/EBITDA multiple will be treated as undervalued.
Multiples Used In Relative Price Valuation
While we value a company, we can choose to value the whole firm or just its equity. What is the difference? When we value the whole company (firm), we consider net cash flow before repayment of the debt obligations. But when we value only equity, we consider cash flows after all debt liabilities are met. Read more about it here.
For example, Net Profit (PAT) is a cash flow that is the net of interest on the debt. Hence it is a metric that can be used in equity multiples.
Operating profit (EBITDA) is a cash flow that is before the interest on the debt. Hence this metric can be used in Enterprise Value (Firm) multiples.
It is an important understanding in relative price valuation analysis. We must not make the mistake of using an equity value in the numerator of a ratio and firm value in the denominator. For example Market Cap/EBITDA or Price/Total Capital will be a wrong ratio to use in the relative price valuation.
#1. Equity Multiples
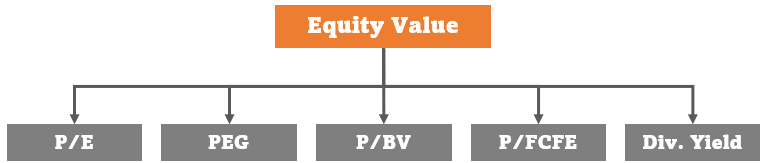
In the equity multiples, necessarily the numerator and the denominator should be an equity value. For example, price is an equity value. Why? Because it denotes the cost per share for the shareholder to buy a single stock of a company. Similarly, EPS is an equity measure because it represents the net profit payable to the shareholders. Hence, the ratio between price and EPS (P/E) can be used for comparison.
- P/E Ratio: The PE ratio can also be expressed as a ratio of Market Capitalization and Net Profit. This ratio is one of the most used equity ratios of all. In the numerator there is Price and in the denominator there is EPS. Both the metrics are equity values. Read more about the P/E ratio.
- PEG Ratio: The P/E ratio is an equity multiple. Dividing this multiple (P/E) with another equity value (EPS growth rate) will shape the PEG ratio. Read more about the PEG ratio.
- P/BV Ratio: In the PE ratio we compare share price with profit per share (EPS). Replacing EPS with another equity value (Book Value per share) gives us this P/BV.
- P/FCFE: Free Cash Flow to Equity (FCFE) is a pure equity value. Replacing EPS in the PE formula with FCFE gives a very refined equity multiple. Read more about FCFE here.
- Dividend Yield: Dividend is also a pure equity value. It is the portion of net profit that is actually shared with the shareholders. Replace the EPS in the PE formula with dividend per share. Now, invert the whole formula upside down, the numerator becoming the denominator and vice versa. This will give us the dividend yield ratio. Read more about the dividend yield formula.
#1. Firm Multiples
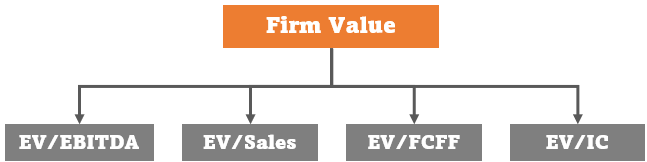
Companies (Firms) can also use debt to enhance their cash flows. But this debt comes at a cost – future payables in the form of loan EMIs. So what is the overall effect of the debt? It is constructive or destructive? To understand this, we can value a firm using the absolute valuation method, like NPV. Alternatively, we can also judge the valuation using relative valuation method by using the following ratios for comparison:
- EV/EBITDA: This ratio is analogous to the P/E multiple (MCap / PAT). Enterprise Value (EV) is the firm value used as an alternative to the Market Capitalization which is an equity value. Similarly, EBITDA is a measure of operating profitability (before considering the effect of debt).
- EV/Sales: The sale number is a good example of firm value. Using Sales as a ratio with EV highlights the cost to be paid to buy the whole firm for every Rupee of sales generated by it.
- EV/FCFF: Enterprise value as a multiple of FCFF is a more accurate relative valuation multiple than EV/EBITDA. But the hurdle here is the correct estimation of FCFF (Free Cash Flow to Firm)
- EV/Invested Capital: Enterprise value expressed as a multiple of the invested capital can also be a reliable firm multiple. I’ll prefer it over more general numbers like sales or EBITDA used in the denominator.
The Limitations of Relative Valuation
In the relative price valuation technique, we generally use ratios or multiples for comparison. For example, we compare the price-earnings ratio (P/E), price-book ratio (P/B), EV/EBITDA, etc multiples of peer companies. As compared to intrinsic value analysis, the relative valuation method is both easy and quick. But the issue with this valuation method is that we do not know what is high and what is low.
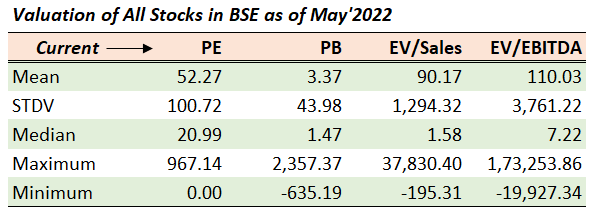
Experts say that to get a perspective of high and low, we can start by looking at the summarized values. For example, observing the P/E, P/B, and other ratios of that whole market will build a perspective. The below table shows the P/E, P/B, EV/Sales, and EV/EBITDA multiple of the BSE (derived from about 4000+ listed stocks).
Comparison of a company’s price multiple with the market average or industry average will give wider perspective about its valuation. Before doing the peer analysis, it will be an ideal starting point. But use of average multiples also have its limitations.
Limitations
These summarized multiples help in the analysis. But while looking at them we must not forget their limitations. First, a clear anomaly is a huge difference between the maximum and minimum values of the ratios (check four ratios shown above for the BSE’s stocks). Hence, considering only mean (average) values for reference can be misleading.
Second, if we will further dig deeper into the numbers, we’ll find that it is biased towards a bigger positive numbers. Why I say so. Let me explain it using an example.
For example, suppose there is a company with a negative PAT. What will be its P/E? Its PE cannot be calculated, right? So most summarized ratios will first eliminate these stocks, and then would calculate the average PE without them.
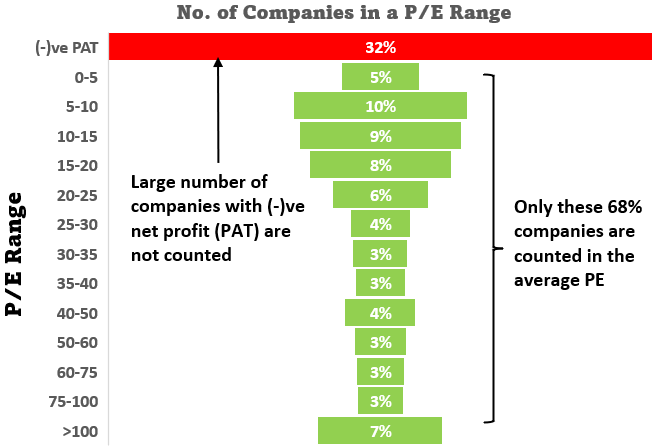
When I was doing my calculation, I found that out of 4000 number stocks, 32% of them had no P/E ratio. This happened because their net profit (PAT) was negative. So, to estimate the PE ratio of the market or of an industry, we generally remove the negative numbers. But imagine, in doing so we are reducing our sample size by 32%. It is bound to yield inaccurate results, especially when we are computing average of the market or of an industry. Hence, such computations are biased towards positive and bigger multiples.
This type of handling of the ratios, like the P/E, is prone to give us non-realistic results. What is the alternative? A better statistical number to consider in such cases is Median instead of Mean (Average).
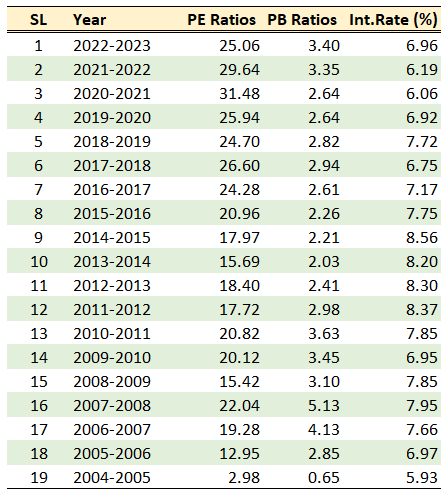
Thirdly, no matter how accurate are the calculated average multiples, they change with time. Let me present to you the PE and PB ratio of the S&P BSE 500 index. You can check how their numbers have changed over time – the last 19 years.
Why P/E Ratio Change with Time
The ratios can change because of a combination of reasons. Three prominent causes of PE change can be the fundamentals of the businesses, prevailing interest rate, and perception of risk.
- Fundamentals: When the economy is booming, more money flows into the stock market. This can cause the PE multiple to inflate. In a growing economy, sales, profit, net worth, and EPS of a company can grow faster. A market filled with more fast-growing companies tends to have a higher P/E ratio.
- Interest Rate: When interest rates are falling, it is a sign that the government wants to see more spending. As loans become cheaper, businesses and people, are lured to spend more. When spending is rising, businesses make more money. Again, a growing business will demand a higher PE and vice versa.
- Risk Perception: An economy surrounded by effects of the pandemic, war, troubled neighbors, etc may look risky for investing. In such a case, investors become risk-averse and tend to spend and invest less. Such a market will have lower P/E multiples.
Conclusion
Not everyone has the skill and time to resort to doing an absolute valuation of a company. Not only absolute valuation is difficult but is also time taking. In this context, relative price valuation is both easy and quick. But yes, it may not be as accurate as intrinsic value analysis. My point is that, investing in stocks without any self-analysis can be several times more inaccurate than the relative valuation approach. So, one can start the stock analysis journey by learning the relative price valuation approach.
It is also essential to understand the concept of equity valuation and firm valuation. For a normal stock investor, the equity valuation approach is more than sufficient. For such investors, it will be better not to waste time comparing companies using firm multiples like EV/EBITDA, etc. It may sound fancy but we can avoid it. Why? Because equity multiples can give equally accurate comparisons.
While we are comparing a stock ratio with the industry average ratio, as explained in this article, we must be aware of the limitations of relative price valuation metrics. The point is that, though comparative analysis is easier to comprehend, it may lead to wrong conclusions. So we must use relative valuation with caution. It is always better to learn the process of fundamental analysis and then do a more complete evaluation of a company.


Nice the blog was very informative thank you for sharing. Do check our website we are the Top builders of Jalgaon.