If you’ve ever scratched your head wondering how to figure out if a company is actually worth your hard-earned cash, you’re in the right place. Today, we’re diving deep into something called Return on Invested Capital (ROIC). It’s one of those metrics that sounds fancy but is actually super practical once you get the hang of it. Think of it as your secret weapon for spotting companies that know how to make money work harder than the same money can make in a bank’s fixed deposits. Check here for a list of high ROIC stocks (like Mastercard, Airbnb, etc).
I stumbled across ROIC a few years back when I was trying to make sense of why some stocks with low price-to-earnings ratios (P/E) were duds, while others were hidden gems. Turns out, ROIC is like a backstage pass, it shows you how efficiently a company uses its money to generate profits.
So, grab a coffee (or tea, no judgment here), and let’s unpack this together.
What Exactly Is ROIC?
Imagine you lend a friend $100 to start a lemonade stand. A year later, they hand you back $110. That extra $10 is your return, right? ROIC is kind of like that, but for companies.
It measures the return a business generates from all the money it’s got from investors, both the folks who bought shares (shareholders) and the ones who lent it cash (bondholders or banks).
Here’s the basic gist: a company raises money by issuing stocks (equity) and borrowing (debt). That pot of cash is called invested capital. The profit it makes from that pot? That’s the return. ROIC is just the ratio of those two:
ROIC = Return / Invested Capital
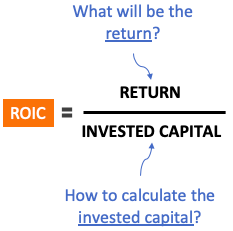
In plain English, ROIC tells you how much bang a company gets for every buck it invests.
A high ROIC means they’re squeezing a lot of juice out of their lemonade stand. A low one? Well, maybe they’re spilling more than they’re selling.
Breaking Down the ROIC Formula
Alright, let’s get a little hands-on. The formula might look intimidating at first, but it’s not rocket science. Here’s how it works:
ROIC = After-Tax Operating Income (NOPAT) / Invested Capital
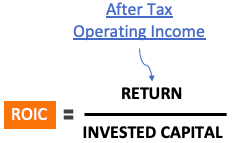
Step 1: The Numerator—NOPAT (The Return)
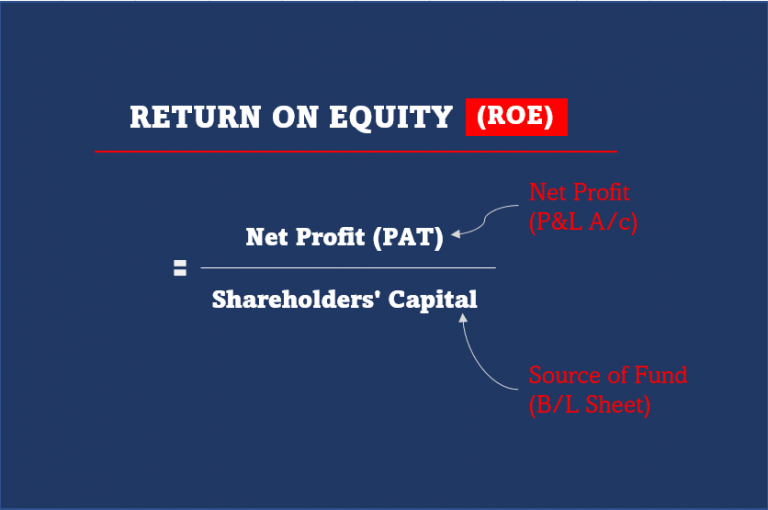
NOPAT stands for Net Operating Profit After Tax. It’s the profit a company makes from its core business, after taxes, but before paying interest to lenders. Why not just use net profit (PAT)? Great question! Net profit only tells you what’s left for shareholders after everyone—lenders included—gets their cut. NOPAT, though, shows the total profit available to both shareholders and lenders, which makes it a fairer measure for ROIC.
Here’s how you calculate it:
NOPAT = (Net Profit – Other Income) + Interest × (1 – Effective Tax Rate)
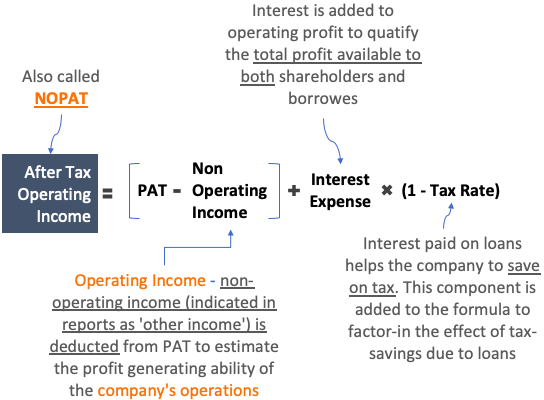
- Net Profit (PAT): What’s left after all expenses.
- Subtract Other Income: This is stuff like interest from investments, not core operations.
- Add Back Interest (adjusted for tax): Interest is a cost of debt, and since ROIC cares about returns to all investors, we toss it back in, adjusted for the tax shield it provides.
Let’s say a company has $100 in net profit, $10 in other income, and pays $20 in interest with a 25% tax rate. NOPAT would be:
$100 – $10 + $20 × (1 – 0.25) = $90 + $15 = $105.
That’s the “return” part.
Step 2: The Denominator—Invested Capital
This is the total money the company’s put to work. But here’s the kicker: not all cash counts.
Invested Capital = Fixed Assets + (Current Assets – Current Liabilities) – Cash
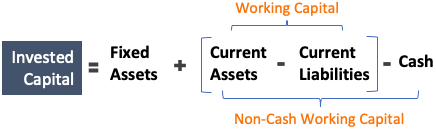
- Fixed Assets: Think factories, machines, buildings—the stuff that keeps the business humming long-term.
- Working Capital (Current Assets – Current Liabilities): This is the cash tied up in day-to-day operations, like inventory or bills due soon.
- Minus Cash: Cash sitting in the bank doesn’t count because it’s not “working” to generate profits.
So, if a company has $500 in fixed assets, $200 in current assets, $100 in current liabilities, and $50 in cash, the invested capital is:
$500 + ($200 – $100) – $50 = $500 + $100 – $50 = $550.
Step 3: Put It Together
ROIC = NOPAT / Invested Capital.
Using our example:
$105 / $550 = 0.19, or 19%.
For every $100 invested, the company’s churning out $19 in profit. Not bad, right?
Why Should You Care About ROIC?
Here’s where it gets relatable.
You wouldn’t throw money at a business that wastes it, would you? ROIC helps you spot the winners. A company with a 19% ROIC is doing way better than one limping along at 3%. Why would you buy stocks of a company which is making 5% ROIC? Rather, you would put it in a bond that will generate at least 4%.
But it’s not just about the number, it’s about what it tells you.
- Efficiency Check: High ROIC means the company’s a lean, mean, profit-making machine.
- Value Creation: Compare ROIC to the company’s Weighted Average Cost of Capital (WACC)—the cost of borrowing and rewarding shareholders. If ROIC beats WACC, the company’s creating value. If not, it’s burning it.
- Investment Clue: I use ROIC to double-check stocks. A low P/E stock with a high ROIC? That’s a bargain. A high P/E with a low ROIC? Maybe it’s overpriced hype.
Real-World Example: High ROIC Stocks
List of High ROIC Stocks (updated on 01-March-2025):
| SL | Name | Market Cap | Price | ROIC (TTM) | ROIC (3Y Avg) |
|---|---|---|---|---|---|
| 1 | Apple | $3.585T | $241.84 | 42.07% | 42.30% |
| 2 | NVIDIA | $2.958T | $124.92 | 132.62% | 71.10% |
| 3 | Meta Platforms | $1.675T | $668.20 | 35.76% | 29.99% |
| 4 | Mastercard | $530.525B | $576.31 | 46.78% | 45.09% |
| 5 | Spotify Technology | $123.855B | $608.01 | 36.20% | -1.79% |
| 6 | Arista Networks | $117.29B | $93.05 | 52.47% | 44.88% |
| 7 | KLA | $94.443B | $708.84 | 39.36% | 37.35% |
| 8 | Airbnb | $87.017B | $138.87 | 40.13% | 30.84% |
| 9 | Lululemon Athletica | $45.991B | $365.61 | 36.79% | 35.03% |
| 10 | Veeva Systems | $36.908B | $224.14 | 38.95% | 33.92% |
| 11 | IDEXX Laboratories | $34.877B | $437.11 | 37.79% | 36.28% |
| 12 | Dexcom | $34.177B | $88.37 | 49.13% | 17.78% |
| 13 | Texas Pacific Land | $32.821B | $1,427.95 | 49.73% | 99.70% |
| 14 | Monolithic Power Systems | $29.436B | $611.01 | 35.53% | 38.62% |
Look at Mastercard, 46.78% ROIC. That’s a company making its capital sweat. Compare that to Spotify, which has a massive market cap but decent 36.2% ROIC. These numbers scream efficiency, but you’d want to check their WACC to see if they’re truly adding value.
How to Interpret ROIC Like a Pro
So, you’ve got the number, now what?
On its own, ROIC shows you return per $100 invested. Higher is better, but context is everything.
- Industry Matters: A steel plant might have a lower ROIC than a software firm because it’s capital-heavy. Don’t compare apples to oranges.
- ROIC vs. WACC: If ROIC is 2-3% above WACC, that’s a sweet spot. More than that? Jackpot. Less? Red flag.
- Trends: A one-year ROIC is a snapshot. Look at 5-10 years to see if they’re consistent or slipping.
ROIC’s Quirks and Limits
ROIC isn’t perfect—I’ll be real with you.
It’s awesome for long-term vibes but can miss short-term drama. Say a company splurges on a new factory. ROIC might dip that year because invested capital spikes, even if it’s a smart move for the future.
It also doesn’t care about industry quirks or one-off events, so don’t lean on ROIC alone.
ROIC vs. ROCE vs. ROA: The Showdown
| Metric | ROIC (Return on Invested Capital) | ROCE (Return on Capital Employed) | ROA (Return on Assets) |
|---|---|---|---|
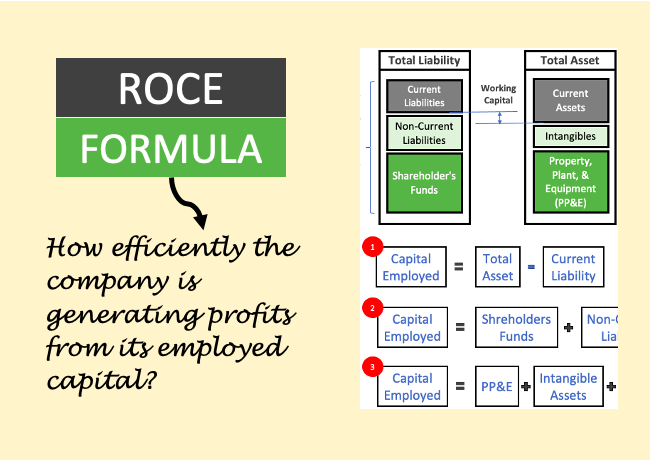
| Formula | NOPAT / Invested Capital | EBIT / (Shareholder’s Equity + Non-Current Liabilities) | PAT / Total Assets |
| Focus | Profitability is relative to total assets, irrespective of capital structure. | Capital efficiency and profitability, considering equity and long-term debt. | Profitability relative to total assets, irrespective of capital structure. |
| Applicability | Best for assessing long-term capital efficiency and sustainability of returns. | Suitable for evaluating capital efficiency, especially for companies with varying debt. | Appropriate for analyzing asset efficiency and short to medium-term profitability. |
| Debt Sensitivity | Very sensitive to debt levels, valuable for assessing leverage impact. | Sensitive to debt but less so than ROIC, suitable for companies with moderate leverage. | Not sensitive to debt levels, focused on asset utilization. |
| Investor Perspective | Valuable for both equity and debt investors, useful for long-term assessments. | Useful for equity investors and evaluating capital allocation. | Relevant for asset efficiency and short to medium-term operational assessment. |
When to Use Each Metric and Insights Provided:
- ROIC (Return on Invested Capital): Use ROIC when you want a comprehensive view of a company’s capital efficiency and profitability over the long term. It is valuable for assessing both equity and debt returns, making it suitable for long-term investors. ROIC is sensitive to changes in debt levels, making it insightful for evaluating leverage’s impact on returns.
- ROCE (Return on Capital Employed): Employ ROCE when you want to assess capital efficiency and profitability while considering long-term debt, but you have a specific focus on equity returns. ROCE is suitable for companies with varying levels of debt and provides insights into the efficiency of capital utilization. It’s valuable for industry comparisons but still requires consideration of industry norms.
- ROA (Return on Assets): Choose ROA when you want to evaluate how efficiently a company uses its assets to generate profits in the short to medium term. ROA is less influenced by capital structure differences and is appropriate for analyzing asset efficiency. It’s relevant for assessing operational efficiency and profitability, especially for shorter-term investment horizons.
ROIC is the true measure of corporate performance, as it considers both profitability and capital efficiency. Investors should focus on the long-term sustainability of a company’s ROIC to make informed investment decisions.
How I Use ROIC (And You Can Too!)
Here’s my playbook:
- Spot Efficiency: High ROIC = they’re good at making money.
- Compare Peers: Is this company crushing it in its sector?
- Value Hunt: Low P/E + High ROIC = undervalued gem.
- Risk Check: High ROIC with sane debt? Less risky bet.
- Long Game: Consistent ROIC over years? That’s a keeper.
For example, if I see a stock with a P/E of 10 and an ROIC of 20% (way above its WACC of 8%), I’m intrigued. It’s cheap, efficient, and creating value. Flip side: a P/E of 50 and ROIC of 5%? Nope, I’m out.
Conclusion
ROIC is like a financial X-ray, it cuts through the noise and shows you how well a company turns capital into profit.
Aim for companies where ROIC beats WACC, they’re the ones growing your money, not torching it. Pair it with P/E, and you’ve got a one-two punch for smarter investing.
Next time you’re eyeing a stock, give ROIC a spin. It’s saved me from some clunkers and pointed me to winners.
Got questions? Drop them below—I’d love to chat more about this stuff!
Have a happy investing.
Thanks much for this. It would be good to see an example as well
Best information for investors but can it be converted in screener which can direct price valuation for ups and downs.Thanks a lot
Yes. One of our theme-based stock screeners displays high ROE and ROIC stocks. Thanks.
Hii.. Thanks a lot for the article. I was searching a good article on ROIC and stumbled on this luckily.. Thanks again..
Ive one question
Could u please share the formula for WACC so that I can use it in screener.in and compare it with their ROIC
You can get the WACC formula here (http://ourwealthinsights.com/cost-of-capital/).
Thanks for asking