
Rupee Cost Averaging Calculator
| Date | NAV (₹) | Units | Actions |
|---|
- Enter the fixed rupee amount you plan to invest each period.
- Click “Add Period” to insert a new row and type in the NAV for each investment date.
- Hit “Calculate” (or change any value) to view units purchased, total invested, and your average cost per unit.
- This tool’s objective is to help us visualize how Rupee Cost Averaging smooths out our entry price over multiple market cycles.
Introduction
Like long-term investing is a strategy to invest money, ‘rupee cost averaging’ is also an investment strategy to invest money by taking lesser risks. It enables people to eliminate the need to time the market.
In rupee cost averaging the investor does not utilize all the funds to buy an asset at a single moment of time. Instead, the funds are spent in small-small amounts to buy the asset over a period of time (say in the next 2 years). This is called spreading the money.
Why spread? Because our markets are volatile. Sometimes, the prices are high and other times they are low. As per rules, one must buy investments when their prices are undervalued. Avoiding overvalued assets is also necessary.
But what if the investor does not know which price is overvalued and which is undervalued? This happens most of the time with majority people. As people are not trained to value assets, they end up buying them at bad price points.
This is the risk when a common man invests his/her money, and they end-up making losses. What is the solution? Following two strategies will eliminate the risk of loss: (a) long term holding, and (2) rupee cost averaging.
The Concept of Rupee Cost Averaging
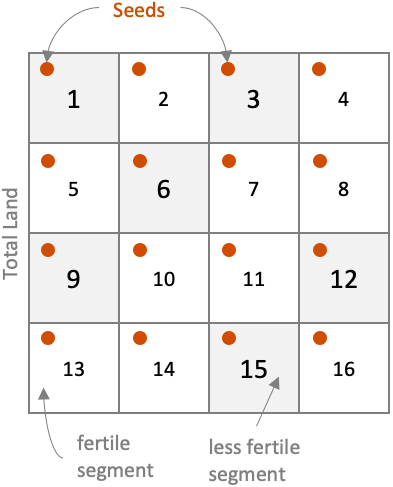
Suppose a farmer bought a new land for cultivation. Someone around him gave a tip that not all parts of the land are equally fertile. How the farmer will manage this risk?
As farmer had no way to knowing which parts are less fertile than others, he decided to follow a strategy of spreading all his seeds, equally, over the total land. This way, all his 16 seeds will not be concentrated on one part of land, thereby minimising the risk.
How the farmer did it? The farmer divided the total land-area into sixteen equal segments. He planned that, each segment will be sown with only one seed. If few segments are less fertile, only those seed sown in less fertile segments, will be at risk. Balance seeds will grow well.
The same analogy can be applied to understand the concept of ‘rupee cost averaging’. Let’s see how…
The analogy
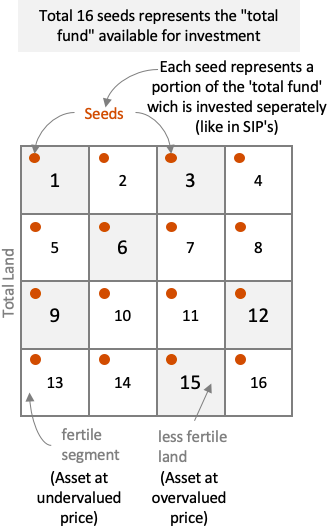
- Seeds: each seed sown in the 16 segments, represents small-small investments. You can imagine it as our SIP’s (say Rs.2,500 per month) that we do each month to buy units of mutual funds (assets).
- Segment (Grey): The segments shaded in grey represents those months where units of mutual funds are overvalued (high NAV). These segments has been numbered as 1,3,6,9, 12 & 15. The SIP’s invested in these months will buy less number of units. Hence will yield less capital appreciation in future.
- Segment (White): The white segments are months where NAV of mutual fund is undervalued. The SIP’s invested in these months will buy more number of units. Hence will yield more capital appreciation in future.
[Note: Some months yield less capital appreciation, and some will yield high. As a result, the overall future returns will be averaged. We will know more about it when we will take real life examples]
From the point of view of investors, it is more profitable to buy ‘units’ in months like 2,4,5,7,8 etc (white). The investor shall avoid months like 1,3,6,9 etc (grey).
But as there is no way of knowing which months will be undervalued and which will be overvalued, hence systematic investing was followed. But on downside, the returns also gets averaged.
What is Rupee Cost Averaging?
It is an investment strategy where money is invested gradually, in equal instalments, instead of investing in lump-sum at one time.
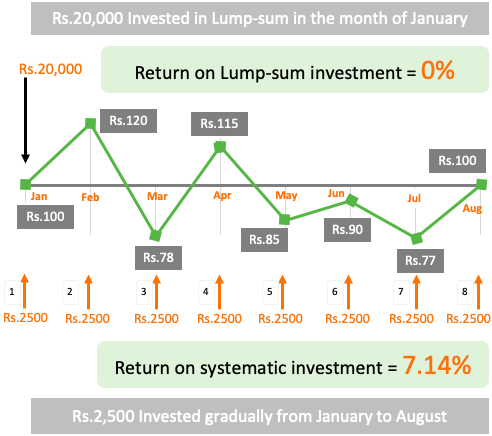
To understand rupee cost averaging, let’s take an example. Suppose you have Rs.20,000 available for investing. As the stock market is showing a falling trend, you want to invest your money (see the above graphics).
You can follow two strategies to invest your money:
- Invest in Lump-sum: Invest Rs.20,000 in one go (in January). You are buying units of a mutual fund whose NAV is @Rs.100 in January. This way you will accumulate 200 number units (20,000/100). Suppose at the end of August, the NAV remains at Rs.100. Hence your gain by August will be 0%.
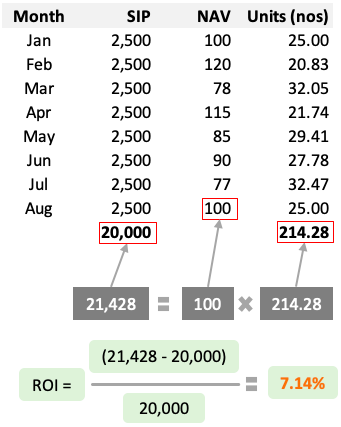
- Invest Systematically: You divided Rs.20,000 into 8 equal instalments of Rs.25,000 each. You then invest Rs.2,500 each month from January to August (in 8 months). NAV of mutual fund varies each month. Hence total number of units accumulated from January to August is 214.28 number (see the calculation shown in graphics). This way, your gain by August will be 7.14% (see calculation above).
You can note that the same mutual fund, in the same time horizon, is yielding different returns (0% vs 7.14%). How this was possible? Just by following the right investment strategy. What is the right strategy? Investing systematically leading to Rupee cost averaging.
But Rupee cost averaging also has its limitations. Please keep reading, you will know more. [Remember: When I saw its limitations, I reduced my SIP’s to minimum. So please read till the end to know the secret].
When Rupee Cost Averaging Works and When Not?
Generally speaking, rupee cost averaging will work when investment is practiced for long term. How long should be the long-term? 7 to 10 years. In this kind of “time horizon” rupee cost averaging will work.
But there is a small rider: “Do not sell units when the benchmark index (like Nifty or Sensex) is falling – like in Mar/Apr’20”. Moreover, don’t miss to read the #situation-3 and the conclusion
Lets understand about ‘rupee cost averaging’ with help of few real life examples.
Situation #1: Time Horizon: 3 Years, NAV: Rising

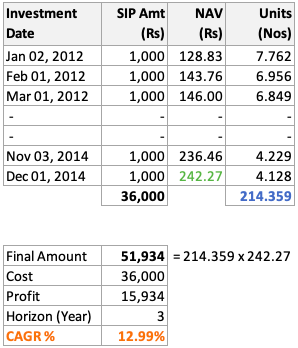
Example: HDFC Index Fund – Sensex Plan
The investor has invested for a time horizon of 3 years. In this period the market was bullish. Hence the NAV trend of the fund was mostly rising. In such a bullish market, the investor could generate a return of 12.99% per annum.
Please Note: The overall trend of the market was bullish. NAV of the fund rose from 128.82 to 242.27 levels in this period. The investor first purchased the units systemstically, and then booked profit on 01-Dec-2014 (theoretically) when he thought the index has peaked.
It is necessary to book profits when you think the index has reached a peak. This is the rule. How to judge if it’s a peak? Plot a curve (like shown above) and see the NAV trend. You would want to see a rising curve.
Situation #2: Time Horizon: 4+ Years, NAV: Rising & Then Fall
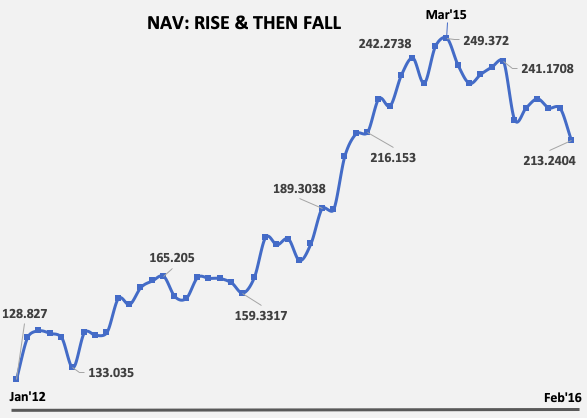
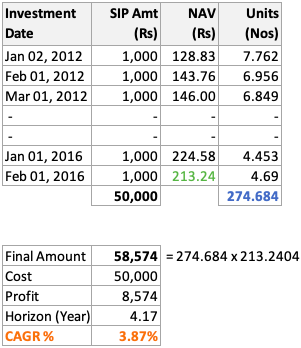
Example: HDFC Index Fund – Sensex Plan
Comparing situation #1 and situation #2 will give an interesting conclusion. Like in condition #1 in situation #2 as well, the investor started investing in Jan’12. He continued to buy units of index fund till Feb’16 (4 years, 2 months).
But when he saw the NAV continuously falling between Mar’15 and Feb’16, his patience gave up. He panicked and sold all his units in Feb’16.
He did not follow the rule. What is the rule? To take advantage of the rupee cost averaging, one must sell only when the index (NAV) is moving up, and is showing that it is at its peak. Never sell when index (NAV) is falling.
Just because the investor did not follow the rule, though he held the units for fairly long time (4+ years), he could earn only 3.87% per annum returns (See the calculation shown in graphics above).
Situation #2.2: Time Horizon: 8+ Years, NAV: Rising & Then Fall
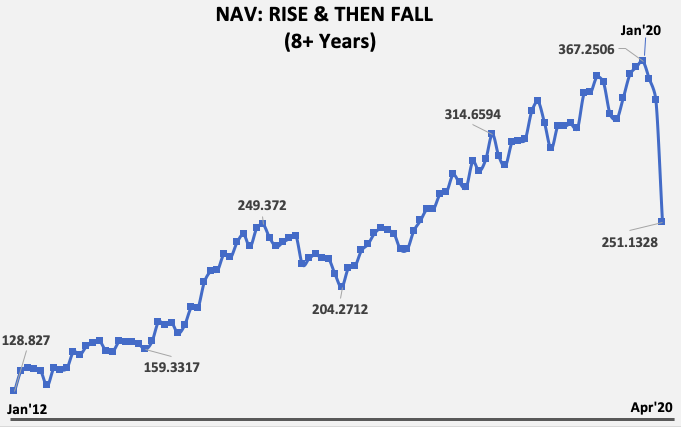
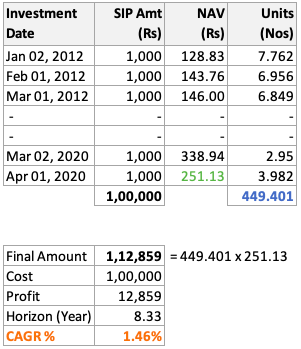
Example: HDFC Index Fund – Sensex Plan
This is a similar example like situation #2. Here the only difference is that the person has held the units for comparatively longer period of time (8+ years).
Like in situation #1 & #2, the investor started investing in Jan’12. He continued to buy units of index fund till Apr’20 (8 years, 4 months).
But when he saw the NAV falling drastically between Jan’20 and Apr’20, he panicked. As result he sold all his units in Apr’20.
Again the rule was not followed. To take advantage of the rupee cost averaging, one must sell only when the index (NAV) is moving up, and is showing that it is at its peak. Never sell when index (NAV) is falling..
Just because the investor did not follow the rule, though he held the units for a very long time (8+ years), his returns were too low (1.46% p.a.).
Situation #3: Time Horizon: 7+ Years, NAV: Rising (sold at peak)
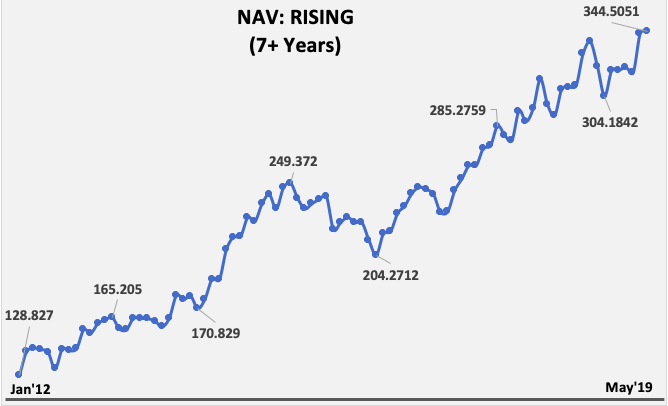
Example: HDFC Index Fund – Sensex Plan
This example shall be read in conjunction with the previous one (situation #2.2). This example is going to give us a new realisation about Rupee Cost Averaging (in other words about our SIP’s).
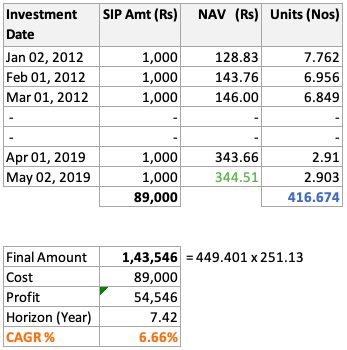
Please note that, in this example, within the period of Jan’12 and May’19 (7.42 years), the NAV of index fund rose from Rs.128.83 to Rs.343.66. This is a growth rate of 14.18% p.a.
Let’s see how our SIP faired in the same time period. As an investor, when we see “NAV of a fund rising at rate of 14.18%”, we would expect some similar numbers for our investment, right? You will be surprised to see the yield-number of the SIP’s (check the calculation shown in graphics above).
In this time period (7.42 years), the investor accumulated 416.674 number units. He decided to sell all his units on 02-May’19 itself (theoretically). On 02-May’19 the NAV was at Rs.344.51. This way the investor could yield a return of only 6.66% p.a.
Though NAV was rising at 14.18%, but actual return of the investor was only 6.66%. Why this happened? Because what a SIP investor earns is only “averaged returns“. Read more: My SIP return calculator.
This is from where the word “Average” comes in this theory of “Rupee Cost Averaging”. Investing in SIP’s makes our return average. What does it mean? In case when market is falling, it will minimize our loss. But on other hand it will also limit our positive yield (like 6.66% vs 14.18% shown above).
What is the conclusion?
“No gain without pain” 🙂
Why we invest using SIP’s? Because it helps us to automate our investments, right? In other words we can say that we are taking less pain but expecting high gains. But in reality, just because we are investing on auto-pilot, our net realised gains will be much smaller (6.66% vs expected of 14.18% – see above).
Where we mostly apply the theory of “Rupee Cost Averaging”? We use it while practising systematic investment plans (SIPs) in mutual fund.
Let’s take an Example: HDFC Index Fund – Sensex plan. For a moment assume that you are in January’2012 and an expert told you this – “.. between the period Jan’12 and May’19 (7.42 years), the HDFC index fund’s NAV will grow at a rateof 14.18% per annum”.
What you will do after this declaration? You’ll invest in this mutual fund and expect earn a return of 14.18% p.a. But as you did not have a lump-sum money for investing, you decided to start a SIP.
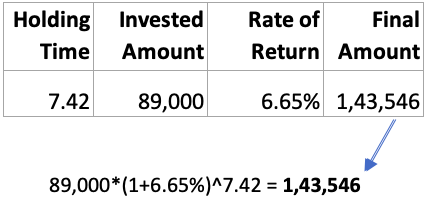
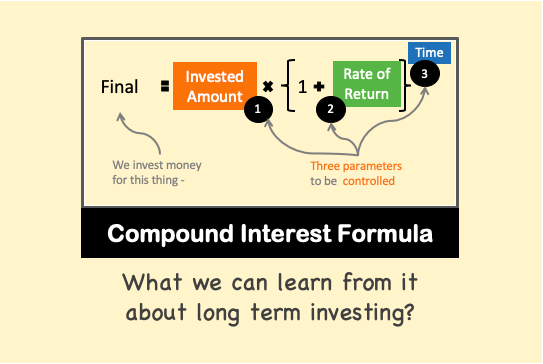
But before that lets see what 14.18% per annum returns means. Let me explain it by showing you a calculation:
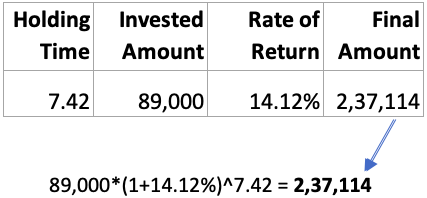
But what was the actual final amount you could make through SIP? The final value was Rs.1,43,546. This is a return of only 6.66% and not what you expected (14.12%) – read example shown in situation #3 above.
Hence we can conclude that, “Rupee Cost Averaging” (or SIP’s) is an investment strategy which we should use for risk aversion only. If risk is killing us, only then apply this to practice. But if our priority is high returns, SIP (rupee cost averaging) will not work.
How to use Rupee Cost Averaging?

When I’ll use Rupee Cost Averaging? I’ll use it only when I’m not sure of my equity-linked investments. What do I mean?
Suppose today is 23-Jan’08, I’ve already seen that Sensex has fallen from 20,800 to 17,600 levels (fall of -15.38%) in just 12 days. As Sensex is falling, I thought why not pick some good stocks (practising value investing). I had some spare cash of Rs.89,000.
But I was not sure which will be the best stocks. Neither I was sure that if this is really the market bottom. Hence I was not willing to invest all of Rs.89,000 in one go. I decided to play safe, hence I went for the SIP in an equity fund.
SIP again? But we have already seen that SIP gives only averaged returns (read situation #3). Yes, I’m still proposing to use SIP. But the way SIP will be used here will make all the difference. Please keep reading.
Generally, a bear market does not last for more than 12-14 months. Here I’m assuming that the market will continue to fall till next 12-14 months.
Hence, I’ve decided to do the following two things with my investment:
- Spreading Funds: I’ll spread my funds (Rs.89,000) into twelve equal instalments of Rs.7,416.6 each (89,000/12 = Rs.7,416.6) in form of SIP. It means, for next 12 months I will buy units of an index fund, by investing Rs.7,416.6 each month (from 23-Jan’08 to 23-Dec’08).
- Hold for long term: Once my SIP duration is over, I’ll hold the units for at least next 10 years. Means, I’ll sell my mutual funds units not earlier than 23-Jan’2018.
Let’s see how much return this strategy will give me in times to come:

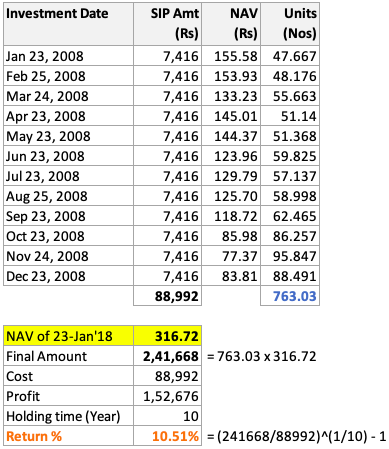
This strategy will fetch me a return of 10.51% per annum. Had I invested my Rs.89,000 in equal instalments of Rs.7416 per month for next 10 years (7416 x 10 x 12 = 89,000), I would have fetched a return of only 6.85% per annum (as on 23-Jan’18).
Suggested Reading:


Breif knowledge sharing and very helpful
Gone through this article in detail today. While it is correct that SIP will cut down both risk and reward, the difference is not going to be as much as shown in this article.
Your formula for calculating SIP return is inherently flawed. You are calculating SIP CAGR like a lump sum investment CAGR, which is not correct. You get returns only the amount and for the corresponding period you are invested in. For example in Situation#3, For a SIP of 1000 for 89 months and a return amount of 1,43,546, SIP Returns are around 12%. Not 6.66%.
In specific cases where investments are staggered in-spite of having a lump sum amount in hand, this comparison might be relevant, but not for all. In majority of cases, SIP returns might be slightly lesser than lump sum, but not so much less as shown.
You are right. But I never said that the CAGR published is wrong. Our interpretation of the numbers is flawed. I’m sure you have the clarity about the numbers, but not everyone has this clarity. They might make a mistake from the numbers published across the web.
How a common man will know how much will be the ‘final corpus’ upon investing Rs.1,000 per month for 89 months when published return numbers are 14.18% per annum? People who know this maths will calculate. People who have access to a SIP return calculator will can also calculate. But what about others? They will make a mistake. This is why an awareness about a “possible misinterpretation” is necessary.
I’ve personally made this mistake. I also know few senior citizens who has realised that their SIP is never yielding the returns they’ve assumed. I’m sure this article will strike a chord for such people. These are people who does not want to see big return numbers only on paper but also need cash-flows which commensurates with their assumptions.
sir,
really superb, u r analysis is very good,you cleared many myths in sip investments,and i got very much clear when i have to invest lumpsump and sip.and many mf houses cheating people by showing growth rate, but what investor getting no body knows,tq.
Thanks. It will be an overstatement to say that Fund houses are cheating because it is us who interpret their numbers in a wrong way. Hence I thought to write this article and share the realisations with my readers.
Rupee Cost Averaging or as our American counterpart say “Dollar Cost Averaging” is a great method to buy less when the market is high and buy more when the market is down.
A very thorough and informational article on this concept.
Great job!