
The objective of this article is to emphasize the need for maintaining basic liquidity and solvency levels for a financially healthy company. We’ll learn about liquidy vs solvency from the eyes of a stock investor. We’ll look at the concept and financial metrics that will help to quantify and comprehend a company’s liquidity and solvency levels. For quick answers, check the FAQs.
Introduction
A financially healthy company tries to maintain its liquidity and solvency at all times.
- Liquidity: Liquidity is the ability of a company to meet its short-term financial obligations, the current liabilities. A company’s solid current-asset base allows it to manage its current liabilities. Highly solvent companies can also arrange for cash through bank loans thereby indirectly giving themselves the ability to manage liquidity concerns.
- Solvency: Solvency is the ability of a company to meet its total financial obligations, both, current liabilities and non-current liabilities. What gives a company its ability to remain solvent? The total asset base – which includes the current and non-current assets.
What do we mean by financial obligations? There are two types of financial obligations, short-term and long-term obligations. The short-term obligations are the current liabilities. Long-term obligations are non-current liabilities that mostly include long-term loans, deferred taxes, provisions, etc.
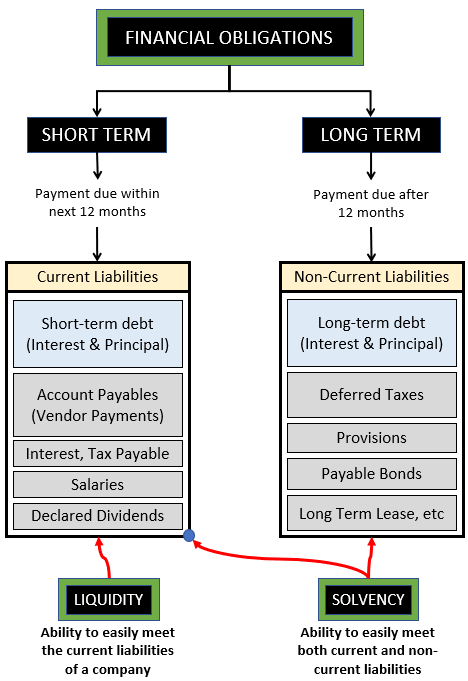
When a company is able to meet its short-term obligations, it is said to be liquid. A solvent company can take care of both short and long-term obligations. Though it is possible that, at a moment in time, a company can be solvent but not liquid. Similarly, a company can be liquid but not solvent.
We’ll read more about it in the next part of this article.
Video [Hindi]
Understanding The Concept of Liquidity Vs Solvency In Terms of Loan Management
Before we dig deeper into the liquidity vs solvency debate, we must first build an essential understanding of loans. Let’s understand it using a simple example of a 7-year bank loan (like a car loan).
Part#1: Short and Long-Term Debt Obligation
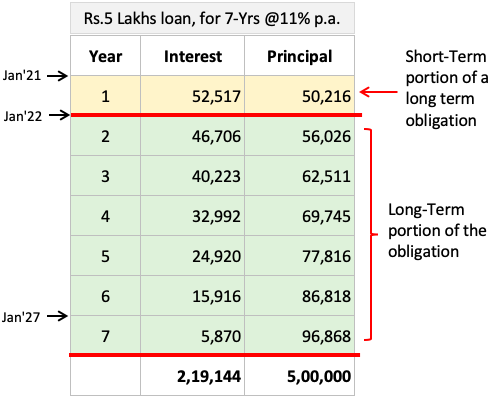
The data set shown above is the payment schedule of a loan taken by the company. A Rupee five lakh loan is taken for seven years at 11% per annum interest. As the loan tenure is more than one year, its treatment will be like a long-term obligation.
But the portion of the loan, interest, and principal, that is due for payment in the next 12 months of loan issuance (Between Jan’21 and Dec’21), will be treated as a short-term obligation.
The split between short and long-term obligations changes every month. All principals and interests payable in the next 12 months, from the current date, are treated as a short-term obligation. Hence, with every passing month the quantum of short and long-term debt obligations will change.
So the accountant of the company will have to update the value every month.
Part#2: Liquidity, Solvency, and Loan Management
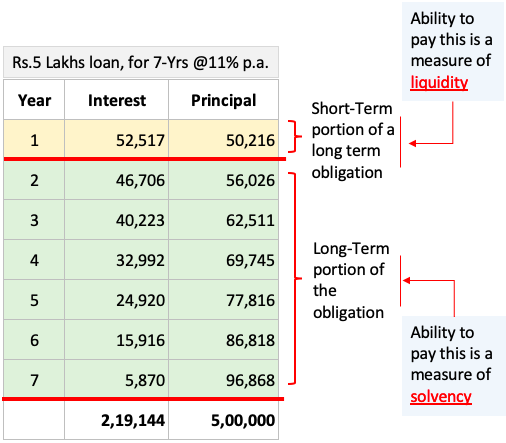
Let’s visualize liquidity vs solvency as highlighted in the above infographics.
When we say that a company is liquid, it means, it has the ability to pay the interest and principal component of the loan that is becoming due in the next 12 months. This is equivalent to a company’s current liability. In our example, the current liability will be Rs.52,527 plus Rs.50,216. In real life, a company’s current liability includes salaries, vendor payments, etc in addition to the loan dues.
A solvent company means, it has the ability to pay the interest and principal component of the loan becoming due after 12 months from today. This is equivalent to a company’s non-current liability. In our example, the non-current liability is interest and principal payable between the years two to seven. In real life, a company’s non-current liability includes payable bonds, deferred taxes, provisions, leases, etc in addition to the loan dues
Liquidity Management
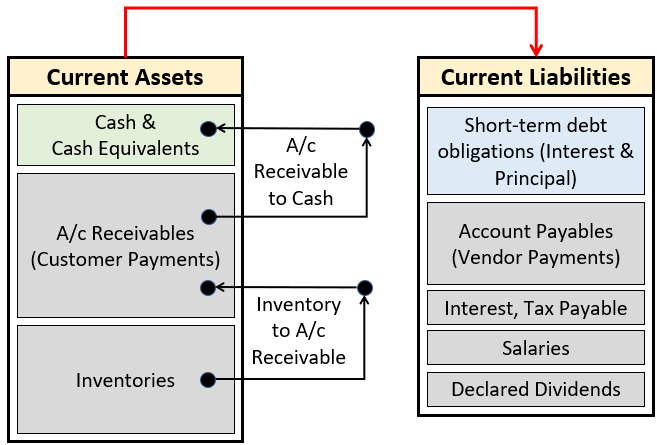
Liquidity is not only about the payment of short-term debt. A company’s liquidity is measured by its ability to pay all current liabilities, which also includes short-term debt. What enables a company to pay its current liabilities? It is their current asset.
Current liabilities are such expenses that will become due for payment within the next 12 months. How to pay for it? Using cash. From where this cash will come? It will come from the cash parked in the company’s bank account, and other components of the current assets like account payables, inventory, etc.
Liquidity is a lifeline for any company. Till the company is able to issue salaries, vendor payments, pay taxes, repay debts, etc, it will continue to survive. This is the reason why so much focus remains on deliveries, billing, and collections.
Till the company is able to sell its products and services and is able to collect dues from its customers, it can meet its current liabilities. This way the company can survive for eternity.
But it is also true that only liquidity management is not enough. Allow me to explain it with an example.
Example
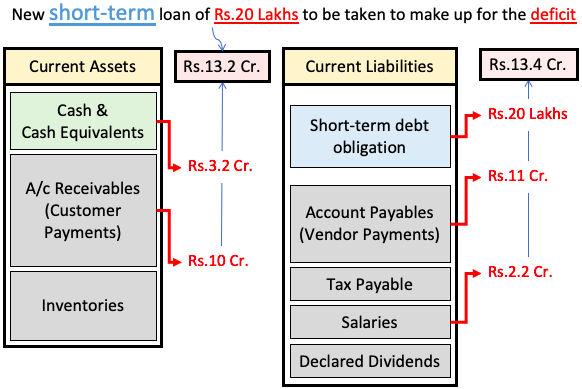
Suppose there is a company whose current liability is Rs.13.4 Crores. Its break-up is as listed below:
- Salaries: Rs.2.2 crore.
- Vendor payments: Rs.11 crore.
- Loan repayment: Rs.20 lakhs
The company has the following current assets worth Rs. 13.2 Crores. Its break-up is as listed below:
- Cash in bank: Rs.3.2 crore.
- Payments from customers: Rs.10 crore.
The company is falling short by Rs.20 Lakhs to meet the demand of current liabilities. In this case, the company can approach a bank and ask for Rs.20 lakh loan. If the company is solvent it will easily get this loan. If the company is insolvent, banks will not give a loan even if 98% of its current liability is already financed from its current assets.
I’ve used this exaggerated example to highlight the need for companies to also maintain their solvency. Only liquidity management may work in normal times. But in tough times, when the cash in-flow from customers dries out, liquidity management will only be possible for solvent companies.
For good companies, there is no prioritizing between liquidity vs solvency. For them, both are important. In fact, good companies will first prioritize their solvency before liquidity.
Liquidity Ratios & Metrics
How companies can keep a track of their liquidity status? They can do it by following the trend of their liquidity ratios.
So till now, we’ve seen the focus on current assets versus current liabilities to judge a company’s liquidity position. Likewise, the financial ratios also focus on these two parameters to analyze the liquidity position.
There are four variations of current assets used by financial metrics to quantify the degree of the liquidity position of a company.
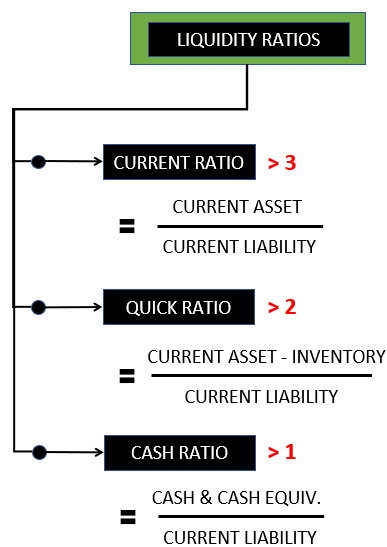
#1. Current Ratio
The current ratio can be calculated by dividing the total current assets of a company by its total current liabilities. The bigger the ratio more liquid is the company. Generally speaking, a current ratio of greater than three (3) can be counted as an indicator of a reasonably liquid company.
#2. Quick Ratio
The quick ratio is like a derivative of the current ratio. But the quick ratio is a more stringent measure of liquidity, hence is more reliable than the current ratio. The quick ratio can be calculated by dividing the total current assets minus the inventory of a company by its total current liabilities. As a rule of thumb, if a company’s quick ratio is great than two (2), it can be said to be very liquid.
#3. Cash Ratio
The cash ratio is an even stricter representation of the liquidity of a company. Here, only the cash & cash equivalent components of the current asset are considered for the calculation of the ratio. The cash ratio can be calculated by dividing the cash & cash equivalent of a company by its total current liabilities. If a company’s cash ratio is great than one (1), it can be said to be liquid enough to take care of the current liabilities.
#4. Working Capital
Working Capital = Current Assets – Current Liabilities
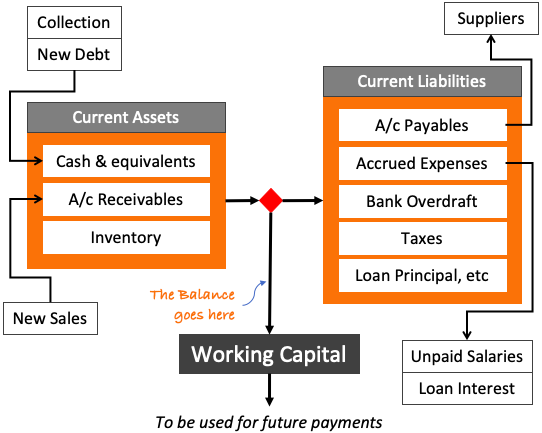
The difference between the total current assets and total current liabilities is called working capital. It is a representation of how much spare current assets are left with the company after meeting all current liabilities. The availability of the spare current assets can then be used to manage forthcoming current liabilities (of the next financial year).
So, if a company’s working capital comes out as positive, the company can be assumed as liquid. But to quantify the degree of liquidity one will have to use the above ratios.
Solvency Management
Most of the time, if the financial ratios are showing that the company is liquid, it’s a sign of good financial health. But for some companies, liquidity and solvency analysis might result in different interpretations.
It means, a company can be liquid but its financial health can still be weak. How? A company’s liquidity level is good, but they are living under the threat of insolvency. Why? Because they are reeling under a load of excess debt. Such companies are called insolvent.
- Insolvency is a state where the company is unable to pay its debts when its due. Neither it is able to pay the interest nor the principal. Insolvency is caused when the cash flow of the company slows down to a level where it is not able to oblige majority due payments.
How to quantify the solvency level of a company? By the use of solvency ratios and metrics.
Solvency Ratios & Metrics
What are the signs that a company is reaching the state of insolvency? Check the below five (5) solvency ratios and financial metrics that works as a decent measure/indicator of solvency.
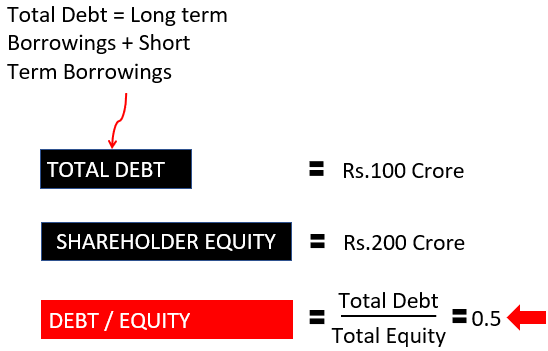
#1. Debt To Equity Ratio
A company’s total debt load is compared with its total equity base (shareholder’s funds). Ideally, a company can operate from its shareholder’s funds. But it will have limited growth. If it wants to grow faster, will need more capital. The extra funding can come as bank loans. But in the passion to grow faster, a company cannot risk its solvency status. It shall not add excess debt to its balance sheet. How to know if the debt is excess or not? Use the debt-to-equity ratio. As a rule of thumb, a debt-to-equity ratio of below one (1) is considered safe.
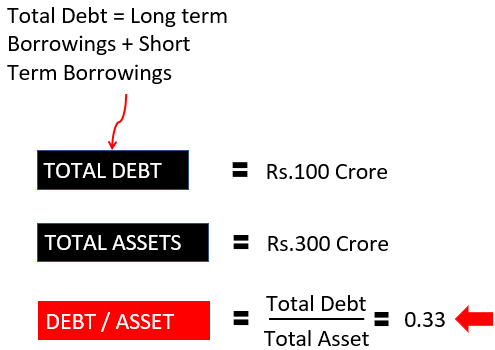
#2. Debt To Asset Ratio
Here the company’s total debt load is compared with its total asset base. This ratio is a measure of, out of the total asset base of a company, how much is financed through loans. A conservatively financed company is seen as a financially healthier company. As a rule of thumb, if about one-third or fewer assets are financed from loans, a company can be treated as solvent.
#4. Asset Coverage Ratio
The asset coverage ratio is a way to judge the ability of a company to pay off its total debt (principal) in case it becomes insolvent. The logic is, if a company can repay its debt in an insolvent state, it can certainly pay today when it is solvent.
When a company becomes insolvent, it first declares itself as bankrupt. Then, the lender can sell its tangible and current assets to raise funds. The funds so raised are used to clear the outstanding loans.
Read more about the asset coverage ratio here. Below is the asset coverage ratio formula.

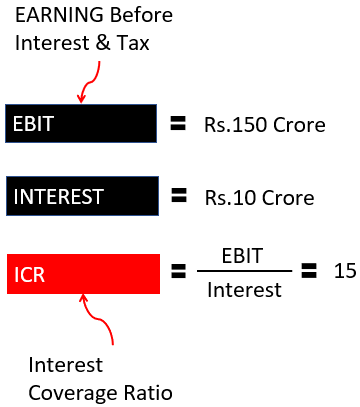
#4. Interest Coverage Ratio
Till now, we have compared the total debt load of a company with its equity or asset base to build an impression about its solvency. Now we will use two different metrics.
Suppose there is a company that makes a profit of Rs.150 crore in an FY. The interest payable on the loans it has borrowed is only Rs.10 crore. Will it not be very easy for this company to pay its loan dues, right?
The Interest Coverage Ratio (ICR) uses this concept of profit vs loan-interest comparison to quantify a company’s solvency status. As a rule of thumb, an ICR of more than three (3) is considered a healthy indicator of solvency.
#5. Net Worth
Suppose you do not have time to calculate the above ratios, you need to quickly comprehend if a company is solvent or not. How to do it? Open the company’s balance sheet and check if its net worth (total shareholder’s equity) is positive or not. A negative value here will be a strong indicator of insolvency. Healthy and solvent companies will display a large positive value here.
Liquidity vs Solvency – Which is more important?
The answer to this question is not simple. Hence we’ll have to look at this question from a perspective. So, let’s understand it using examples.
Example #1: Weak Liquidity, Strong Solvency
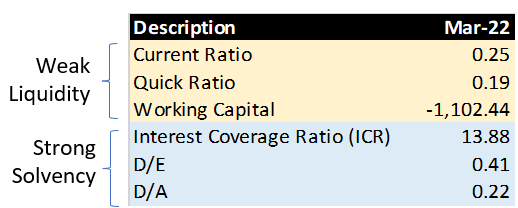
This is an example of a company whose liquidity is weak but has strong solvency numbers. Weak liquidity means, the company is cash-starved and is not able to meet its current liability demands.
As the company has a strong solvency status, it can approach a bank and ask for a loan to manage its weak working capital. Such a company can easily get a loan.
Hence, a solvent company can operate like a financially healthy company even if it has liquidity constraints. How? Due to its ability to get bank loans.
So, being solvent should be the company’s top priority.
[Note: Availing of bank loans is a temporary way to manage liquidity. If a solvent company keeps adding debt to its balance sheet to fund its weak working capital, its status will change. Its debt-to-equity and the debt-to-asset ratio will eventually rise and make it financially unhealthy.
Example #1: Strong Liquidity, Weak Solvency
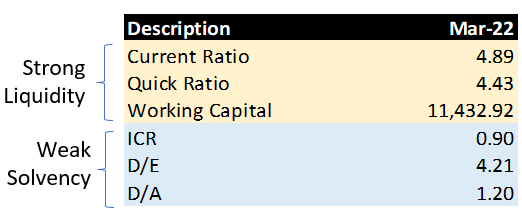
This is an example of a company whose liquidity is strong but its solvency is weak. The current and quick ratios are as high as four (4). These are strong liquidity indicators. But the same company is showing a low ICR, and high D/E and D/A ratios.
Till the liquidity levels of this company are high, there will be fewer problems. But suppose, a situation like COVID-19 strikes us where the customer payments dry out. The liquidity position of the company will gradually start deteriorating.
In such circumstances, the company cannot even approach banks for loans because of its weak solvency status. In all probability, banks will not offer a loan to such a company. It means insolvent companies will find it much harder to sail out of tough times.
This again proves that maintaining solvency is essential. A liquid company may ignore it, but if the cash flow goes negative, it may not survive.
Checking Liquidity & Solvency Ratio Trends
To judge the overall financial health of a company, experts always include solvency and liquidity ratios in their analysis. Why do both? Because we have seen examples of companies that showed no signs of a liquidity crunch till they became insolvent.
Such companies did not reach the point of insolvency suddenly. They reached them gradually over time. Checking their past solvency ratios will prove that.
Looking at a year’s solvency ratio of a company is not as useful. Better is to compare these ratios with that of its competing companies. Moreover, a trend analysis of solvency and liquidity ratios will give an even deeper understanding. Deteriorating solvency and/or liquidity ratios year on year is a clear sign of poor financial health.
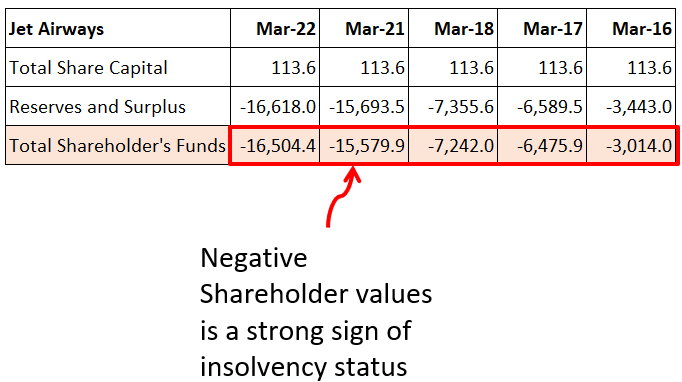
Example: Jet Airways
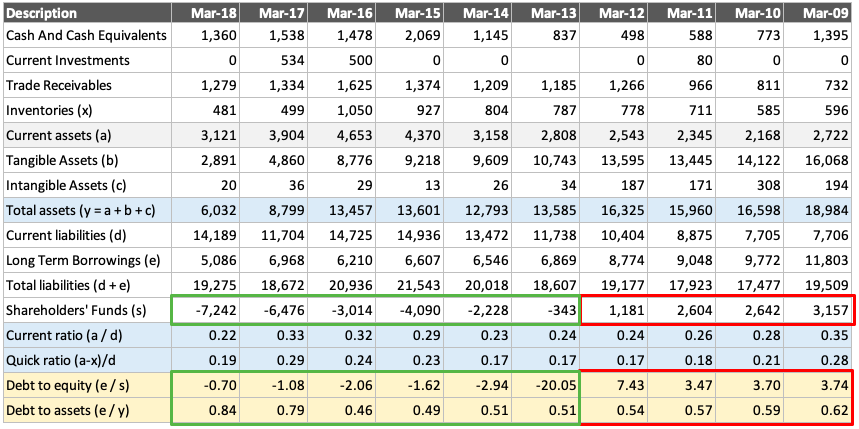
We remember the problem years of Jet Airways as 2017-2018. Why? Because during this time, the Airline closed its operations. But if we will see its balance sheet, the possibility of future failure was visible in the year 2009 itself.
See how the shareholders’ funds of the company were decreasing from Rs.3,157 Cr. to Rs.1,181 Cr. between the years 2009 and 2012. In the year 2013, the shareholder’s funds eventually became negative. A negative shareholders’ equity is one of the most visible indicators of insolvency. But see, it did not happen in a day. The company was showing signs of it long before.
You can even see the debt-to-equity (D/E) ratio. Between the years 2009 and 2012, the D/E ratio rose from 3.74 to 7.43. In the same period see the company’s Debt to Asset (D/A) ratio was hovering between 0.54 to 0.62. These numbers are an indicator that about 60% of the company’s assets are funded using debt.
It is amazing how investors were still buying shares in this company.
Conclusion
A company can face a temporary liquidity problem. But it can sail out of it if it maintains healthy solvency ratios. How? Because banks will be more than eager to lend money to such companies. If not, the company still has the option of keeping its tangible assets as collateral for borrowing.
Hence, maintaining liquidity is necessary but to remain afloat for the long term, a company must give extra care to remain solvent at all times.
FAQs
The most liquid asset for a person, enterprise, or state is cash. The cash can be in form of paper currency or money parked in a bank account. Corporations also count non-cash current assets, like account receivables and inventory, among liquid assets. Why? Because it can be readily converted into cash. The state of having access to direct cash or other assets that can be readily converted into cash is called liquidity.
Cash is of course the most liquid asset. All paper-based assets like stocks, mutual funds, and ETFs, is a form of liquid assets as they can be quickly redeemed for cash. Some physical assets are considered liquid, like gold and silver. A real estate property is not a liquid asset. In terms of corporate finance, finished goods inventories and paid loans and advances are also considered a form of liquid assets.
When an individual, company, or state is in a state to pay off its debt, they are considered solvent. Suppose a company has a total debt of Rs.15 crores. Though the company has only Rs.5 crore in current assets, it has an investment in stocks (of other companies) worth Rs.23 crore. As the size of its current investment is bigger than its total debt, the company can be said to be solvent.
Solvency level can be measured by the use of financial ratios. The most common of such financial ratios is the debt-to-equity ratio. Other ratios like debt-to-asset, interest coverage ratio, and asset coverage ratio can also be used to measure solvency. If a company has a positive net worth, it is also an indicator of solvency.
Have a happy investing.


Nicely written…..
Please wite something on Government Securities.
Thanks.
You can read this post on how to buy government bonds