
Stock market moves in cycles (up and down). Falling prices are almost a daily routine.
So, in backdrop of this fact, what is a stock market correction?
When stock market index falls by -10% or below, it can be termed as a “correction”.
Stock market corrections are frequent, or it is a rare phenomenon?
On this, allow me to share with you some numbers. Read: About signals of stock market crash.
Stock Market Correction in Last 10 Years
I’ve done a small study on S&P BSE 500 Index. The report is this…
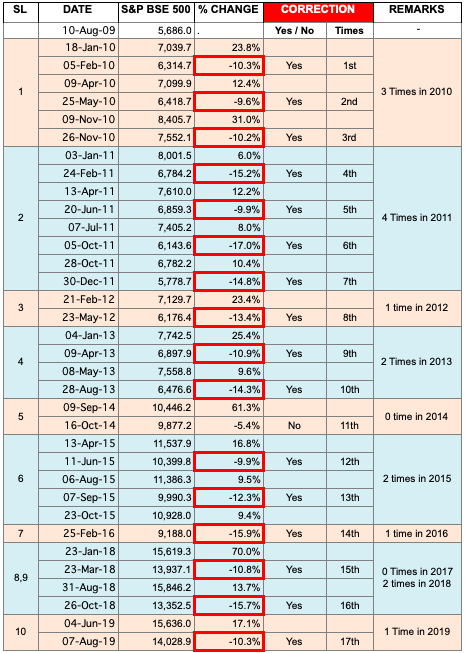
What I’ve highlighted in RED are stock market corrections of -9.6% and below.
This is a 10 year data.
In last 10 years, S&P BSE 500 Index has corrected itself 16 times.
It means, on an average there is a stock market correction every 7-8 months.
This is frequent, right?
Yes, before this number crunching, I was also not expecting this result.
What we can conclude from this data? There are few interest learnings hidden in it.
I’ll share with you some of my more deeper findings. Let’s know more…
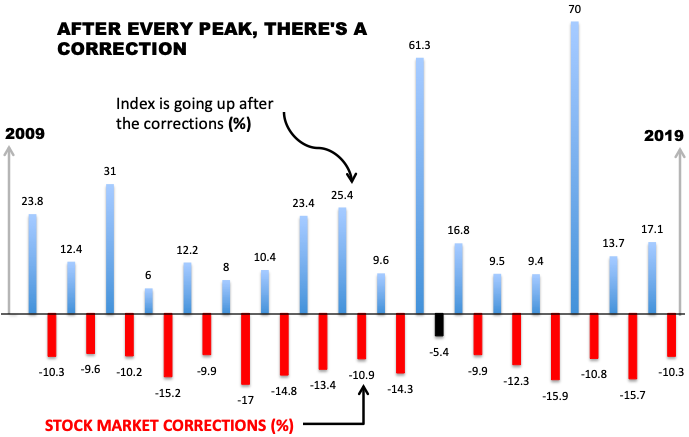
Pattern of Correction After Every Peak
The market corrects itself after every peak.
Check the pattern in last 10 years…
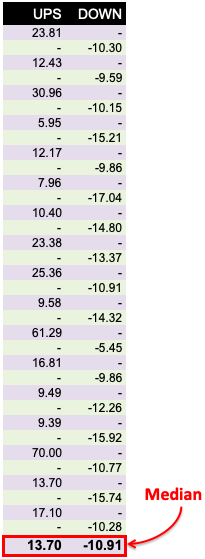
What we can confer from the above data?
I’ve done a median analysis of the above stock data. The finding is this:
Generalisation: Every time the stock market index goes up by 13.7% (& beyond), it corrects itself by at least 10.91%.
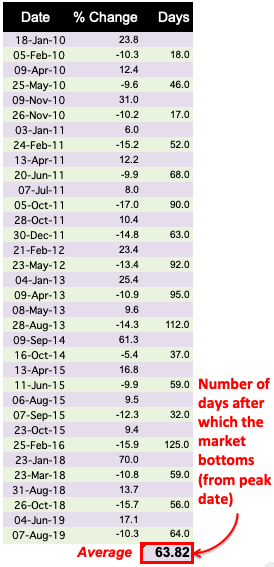
Time Taken For Correction
From the above chart we can understand that, after every peak there will be a correction.
But how much time it take for index to travel from peak to bottom?
On an average it takes 63.82 days (about 2 months).
How this information is useful?
Knowledge about the quantum of drop, and time taken for the drop can help one to time the market.
Though, it is impossible to time it perfectly, but a general idea helps.
Maximum & Minimum Values
One must be aware of the range of value as well. Why?
Because it will help in understanding the market behaviour with more clarity. What it can say?
It can say how much an index can go beyond the average values, and what are the probabilities of happening that.
What are the average values?
- Quantum of Correction: -10.91%.
- Up from bottom of correction: +13.7%.
- Correction Frequency (nos of times in a year): 1.6 Times.
- Time taken to bottom (from peak) during correction: 63.82 days.
These are the general numbers. Let’s see their upper & lower limits.
| SL | Description | Avg / Median | Min | Max |
| 1 | Quantum of Correction | -10.91% | -5.45% | -17.04% |
| 2 | Up from bottom of correction | 13.70% | 5.95% | 70% |
| 3 | Correction Frequency | 1.6 Times | 0 Times | 4 Times |
| 4 | Time taken to bottom (from peak) | 63.82 Days | 17 Days | 125 Days |
Explanation:
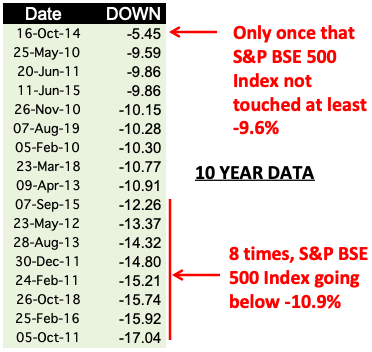
- Quantum of Correction: Every time the index corrects itself, it’ll not be for -10%. The market may fall upto -5.45% and jump back. The market may also continue falling till -17.04% and then decide to move up.
- Probability #1: Index fall less than -9.6% – In last 10 years, there has been 17 instances of stock market corrections. Out of these 17 times, only once BSE 500 Index, fell only by -5.45% and bounced back. In rest of the 16 cases, index fell till at least -9.6%. Hence, the probability of happening this is negligible.
- Probability #2: Index fall beyond -10.9% – Out of 17 instances of stock market corrections, it has happened 8 times that the index has breached -10.9% mark. Hence, the probability of happening this is almost 50:50.
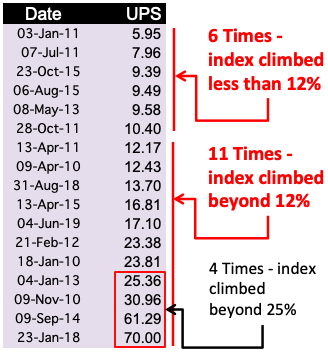
- Up from Bottom: As soon as the index hits bottom, it’ll start travelling up. But how far it will go up? Median analysis says it will go up till 13.70%. But this may not always be true. The index may only rise upto 5.95% before falling again. The index may also continue its ascent till 70%.
- Probability #1: Index rise less than +12% – In last 10 years, out of 17 instances, only 6 times has the index NOT touched the +12% mark. Hence we can say that probability of happening this is only 35%.
- Probability #2: Index rise more than +12% – In last 10 years, out of 17 instances, 11 times has the index crossed +12% mark. The probability of happening this is as high as 65%.
- Probability #3: Index rise more than +25% – In last 10 years, out of 17 instances, only 4 times has the index crossed +25% mark. The probability of happening this is only 23%.
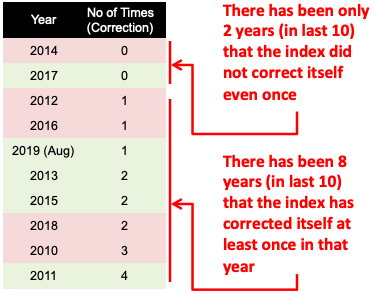
- Correction Frequency: How frequent is the stock market correction? Average data shows that, it happens at least once every year (1.6 times / year). But this is not a fixed rule. There has been instances where there has been no correction in a year (2014 & 2017). There has also been instances, when index corrected 4 times in one year.
- Probability #1: No correction in a Year – In last 10 years only twice has the index not corrected itself in a year even once. Hence, the probability of happening this only 20%.
- Probability #2: At least one correction in a Year – In last 10 years, there has been 8 years where the index has corrected itself at least once (in that year). Hence, the probability of happening this is as high as 80%.
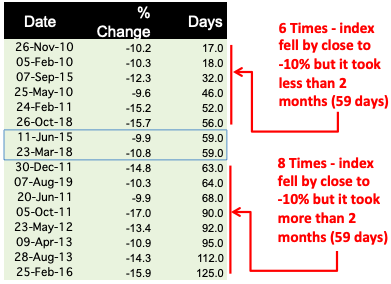
- Time taken to reach bottom (from peak): Every time the index corrects itself, it’ll take 63.8 days to hit bottom. What does it mean? It means that, the correction period will last at least 2 months, before the up-trend starts.
- Probability #1: Correction (below -9.6%) in less than 59 days – Out of 17 instances of index falling below -9.6%, 6 times it took less than 59 days to reach bottom. Hence, the probability of happening this is 35%.
- Probability #2: Correction (below -9.6%) in more than 59 days – Out of 17 instances of index falling below -9.6%, 8 times it took more than 59 days to reach bottom. Hence, the probability of happening this is 47%.
I hope, you’ve found the numbers interesting related to market corrections.
Allow me to state further, how to deal with a “falling stock market”…
What causes stock market correction?
It will not be wrong to assume that market correction are also “enforced”
Why I say so?
Though it is almost impossible to pin-point the real cause of market corrections, but in general, there could be 3 reasons:
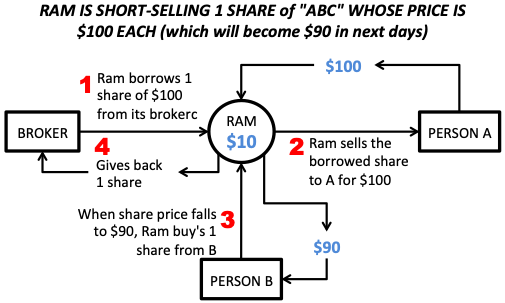
- #1. Short Selling: What is short-selling? Example: Ram borrowed 1 share of ABC ($100) from a broker. Them he sold it to “A” at $100. Ram’s income? $100. When share price fell to $90, Ram bought 1 share from “B”. Ram paid $90 to B, keeps $10. Then, he returns 1 share to his Broker. This way, Ram is making money even when share’s price is falling. This way traders make more money in falling markets. Hence, they often BET for price falls. When more people are betting on falls, it pulls the market down.
- #2. Emotions: Most investors of stock market, are driven more by emotions than logic. Even if the fundamentals are good, they will sell & book profits. Why? Because they are not feeling good about the market. Their actions are also trigged by the actions of their associates. If they are selling, he/she will also sell. Read: About problems faced while investing.
- #3. Economy: Stock market performance is deeply linked with performance of the economy (GDP, inflation etc). Any negative news related to GDP growth, inflation often pulls the market down. Even negative news (like trade war between China and USA), can pull the market down. Read: How economy works?
Let me give some some insights into market corrections of the past…
Major Corrections in Last 20 Years [India]

If we go back 20 years, Indian stock market saw two major corrections (crash):
- Year 2000-03
- Year 2008-09
What we will study about these corrections?
We will check, what were Fundamentals of Sensex at those points, beyond which stock market correction happened.
Which fundamentals we’ll check?
- P/E ratio of Sensex.
- P/B ratio of Sensex.
- Dividend Yield (DY) of Sensex.
What is the objective of doing this exercise?
If one is aware about these fundamentals, future corrections/crash can be foreseen.
#A. Year 2000 to 2003
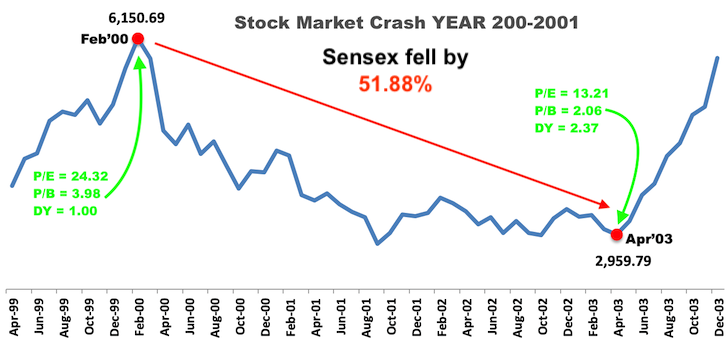
What is visible from the above stock market trend?
- Sensex peaked in Feb’2000. At this point what were the fundamentals of Sensex? P/E = 24.32, P/B = 3.98, DY = 1.00. As the market crashed beyond this point, hence we can say that Sensex was overvalued in Feb’2000.
- Sensex bottomed in Apr’2003. At this point what were the fundamentals of Sensex? P/E = 13.21, P/B = 2.06, DY = 2.37. As the market bounced back beyond this point, hence we can say that Sensex was undervalued in Apr’2003. Read: Weight of stocks in Sensex.
So what we can conclude from this data?
There can be three conclusions:
- Sensex becomes too overvalued at P/E of 24.32, P/B of 3.98 and D/Y of 1.00.
- At these overvalued levels, there is a high chance that Sensex might correct or crash.
- When Sensex’s fundamentals reaches levels like P/E of 13.21, P/B of 2.06 and D/Y of 2.37, it can be said to be undervalued.
What does it mean?
At overvalued price levels, Sensex will crash. This is the point where investors must start taking closer look of the index.
Every time Sensex reaches such overvalued levels, it may correct itself or crash.
Note: This Crash happened when Sensex was at all time high of 6,150 levels.
#B. Year 2008 to 2009
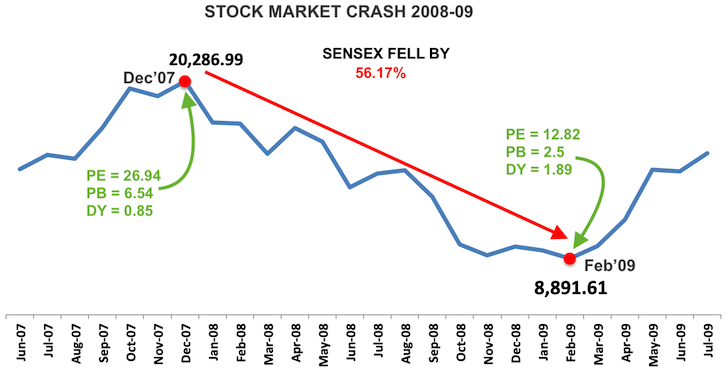
What is visible from the above stock market trend?
- Sensex peaked in Dec’2007. At this point, the fundamentals of Sensex was very similar to that of Feb’00. But 2007 peak was more dreadful. Fundamentals (P/E = 26.94, P/B = 6.54, DY = 0.85). As the market crashed beyond this point, hence we can say that Sensex was overvalued in Dec’2007. Read: About subprime mortgage crisis of 2008.
- Sensex bottomed in Feb’2009. At this point, the fundamentals of Sensex was again very similar to that of Apr’03. But the fall in 2008-09 crisis was more severe. Fundamentals (P/E = 12.82, P/B = 2.5, DY = 1.89). As the market bounced back beyond this point, hence we can say that Sensex was undervalued in Feb’2009. Read: Index funds vs active funds.
So what we can conclude from here? There can be three conclusions:
- Sensex was more bullish in Dec’2007 as compared to Feb’00. Sensex became too overvalued at P/E of 26.94, P/B of 6.54 and D/Y of 0.85.
- At these overvalued levels, there was a high chance that Sensex was going to crash like 2000-01.
- Sensex’s fundamentals reached (in Feb’09) levels like P/E of 12.82, P/B of 2.5 and D/Y of 1.89, which made it undervalued.
In 2008-09 Sensex’s bull-run continued so much that it created a “bubble”.
When this bubble bursted, it carried with itself the Sensex almost 56% down.
Every time Sensex reaches such overvalued levels (like P/E of 26.94), it may correct or crash.
Note: The Crash happened when Sensex was at an all time high of 20,200 levels.
“Sensex-PE” Vs Sensex [Aug’19]
Sensex is overvalued or undervalued in Aug’19?
| Year | P/E | Sensex |
| Aug-19 | 25.9 | 36,472.9 |
| Jul-19 | 27.8 | 37,481.1 |
| Jun-19 | 28.3 | 39,394.6 |
| May-19 | 28.4 | 39,714.2 |
| Apr-19 | 28.1 | 39,031.6 |
| Mar-19 | 27.6 | 38,672.9 |
| Feb-19 | 23.8 | 35,867.4 |
| Jan-19 | 23.6 | 36,256.7 |
| Dec-18 | 23.5 | 36,068.3 |
| Nov-18 | 23.0 | 36,194.3 |
| Oct-18 | 22.2 | 34,442.1 |
| Sep-18 | 24.1 | 36,227.1 |
| Aug-18 | 24.5 | 38,645.1 |
| Jul-18 | 23.1 | 37,606.6 |
| Jun-18 | 22.9 | 35,423.5 |
| May-18 | 23.4 | 35,322.4 |
| Apr-18 | 23.4 | 35,160.4 |
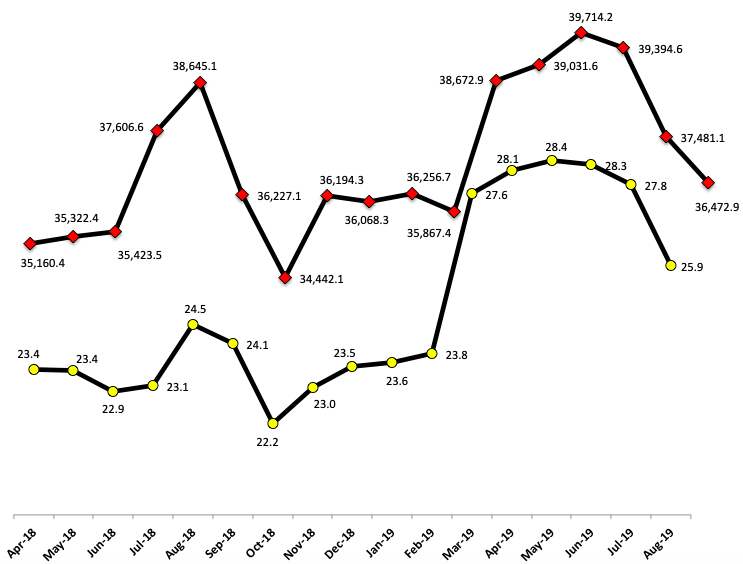
What is shown in the above chart?
Important is to note that, how “Sensex” and “Sensex PE” move w.r.t. to each other.
- Between Apr’18 & Aug’18: PE rose from 23.4 to 24.5 (up by 4.52%). Sensex rose from 35,160 to 38,645 (up by 9.91%). Sensex index grew at a rate faster that PE. What does it mean? It is a sign of index getting overbought (overvalued). Read: About ETF’s.
- Between Aug’18 & Oct’18: PE fell from 24.5 to 22.2 (down by -9.55%). Sensex fell from 36,645 to 34,442 (down by -10.88%). Sensex index & P/E fell almost at same pace. Why index fell? Overvaluation. Why P/E fell? Falling index prices, pulled P/E down (considering they fell at similar rates). Read: Why stock price fluctuate?
- Between Oct’18 & May’19: PE rose from 22.2 to 28.4 (up by 28%). Sensex rose from 34,442 to 39,714 (up by 15.31%). Again, Sensex index underperforming compared to it PE. What does it mean? It is a sign of index getting undervalued. Read: Low NAV is not a sign of good price.
- Between May’19 & Aug’19: PE fell from 28.4 to 25.9 (down by -8.74%). Sensex fell from 39,714 to 36,472 (down by -8.16%). Sensex index & P/E fell almost at same pace. Why index fell? Overvaluation. Why P/E fell? Falling index prices, pulled P/E down (considering they fell at similar rates). Read: Invest risk free to earn high returns.
Why Sensex is falling at all? Let’s double check it’s overvaluation.
- Crash of Y2000: When this happened, Sensex P/E was at 24.32. From here it fell till 13.21 levels. Today (in Aug’19) what is Sensex’s P/E? 25.9. It is higher than Y2000 levels. So, it means that there are chances of Sensex crashing. How much? It depends, I think another 10% decline is possible. So, it will roll down till at least 33,000 levels.
- Crash of Y2008: When this happened, Sensex P/E was at 26.94. From here it fell till 12.82 levels. Today (in Aug’19) what is the P/E of Sensex? 25.9. It is lower than (but close to) Y2008 levels. This again confirms that Sensex is trailing at overvalued levels. Sensex falling till 33,000 is possible. Read: Signals of stock market crash.
Sensex, is falling because it is trading at overvalued levels. A 15% correction from it’s May’19 highs of 40,000 levels is on the cards.
This means, Sensex dragging down till 33,000 is a good possibility.
How to Manage Stock Market Corrections?
Till now, I’ve presented handful data about market corrections.
The purpose of this number crunching was to make market corrects more factual. Why?
Because people often dread stock market corrections. But the presented data will make it more understandable.
Having said that, it does not mean that people should start taking market corrections head-on.
So, how it needs to be managed? What is a better way?
- Never try to time the market: It is true that stock market corrections keep repeating itself. But trying to predict market corrections will be a mistake. Preferably, a common man should invest systematically (for long term) without worrying about the corrections. Read: Systematic Investment Plans (SIPs).
- Do not fear price falls: Generally, panic strikes in people when market corrects. What people do in panic? They sell. But this is not a time to panic. It is time to feel optimistic. It is a time to buy more good shares/units. Read: Investing in bear market.
- Expect Corrections: Out of 4 quarters in a year, expect a price fall (correction) in at least one quarter. This assumption, will help one to tread more carefully in the market. When people are expecting corrections, they become more cautions. This prevents careless investing. Read: Mistakes of poor people.
Following these simple rules can go a long way in managing share market corrections.
How to Minimise Loss During Correction?
When stock market index falls, ones personal portfolio will also be in red.
But the extent of loss can be minimised by using simple rules of equity investing.
Lets see few such rules:
- Understand Risks: Before buying equity, always try to gauge – potential upside and downside (both). Suppose you are buying a stock of $100 each. Try to judge how much the price may fall (in worst case scenario). How to judge? Check last 10 year data of stock. Which data to check? Sales, profits, dividends, EPS, net worth, book value per share, net cash from operations, P/E, P/B, etc. The variations in these numbers will give an idea about its impact on market price. Read: Factors effecting share price.
- Intelligent Asset Allocation: Ones investment portfolio can be distributed in four heads: (a) Equity, (b) Debt, (c) Income Assets, and (d) Cash. Based on ones dependency on investment portfolio, the proportions on above heads can be altered. A person with negligible dependency on portfolio can be equity heavy. Whereas a retired person will be income-asset & cash heavy. Read: Diversification for defensive investor.
- Bad News Means High Returns: In 2018 (Oct), Bank Nifty saw its bottom. Those were moments, when most negative news was spreading about banking sector. Had someone invested in bank nifty then, their returns would’ve been 28% (in Jul’19). Rule is, the bigger is the pessimism, better is the opportunity for investing. [Buy stocks when everyone else is selling]. Read: Guide: How to invest in share market.
Final Words…
Till couple of months back (3rd-June’19), Sensex was at an all time high of 40.000 levels.
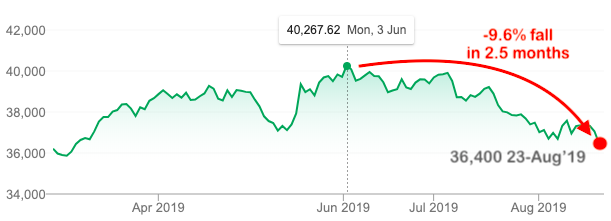
Since then the Sensex has only been falling regularly. Till date, the index has fallen by almost -9.6%.
If you will see S&P BSE 500 index, the fall has been -11.96%.
The trend is clear, in Aug’2019, we can say that we are witnessing a stock market correction.
But is this the market bottom? My guess is, it will go further down till 33,000 levels.
But do not panic. Such correction are inevitable.
These are times to buy some good stocks.
I hope you’ll like the work. In case you have any feedback/views on the subject, please post it in the comment section below. I’ll be more than happy to read your comments and reply.
Have a happy investing.


Hi Mani,
In the section of “Sensex-PE” Vs Sensex” you mentioned that between Between May’19 & Aug’19 the sensex fell due to overvaluation, but in the previous point it says that there was undervaluation of the index Between Oct’18 & May’19. I’m not sure which one is correct? If the index is undervalued in May 19, wouldn’t that mean that the index should now start increasing from June 19 onwards rather than decline?
Hi Mani,
In the very first image that you have, aren’t you selectively picking and choosing dates? I saw that from 23 Oct 2015 to 25 Feb 2016, the market correction was -15.9% which is more than 10%, but what about Nov, Dec, Jan. Wouldn’t it be possible that there was a gradual fall from Oct to Feb? If we were choosing a constant time period, viz. monthly, then it’s possible it wouldn’t be a correction since it wouldn’t be >10% dip, but smaller changes month on month?
The ranges were selected involuntarily. The idea is to convey how the market corrects in the time horizon of say 10 years.
Sir great work………book mark for sure
Informative and helpful information.Thanks for sharing such a nice article.
finance
1000 likes for your hard work
i like to pay INR 100 (I know its very small but take it as my respect to you).
I like to read more article like it
Excellent information. This article deserves a bookmark for sure. Thanks for your time.
Thanks
Very good article … All are valuable informations for us … it’s very easy to get all important things as you made all important things for us…keep it up for us .. thank you once again sir ji
Interesting article exhibiting certainties in a basic way and articulating opportunity remedy presents for speculators.
A good informative article, Thank you
On what basis you say correction will be only 15% from record high & not more thatn 20% considering the overvaluation & time elapsed since last crash of 2008 and not result in a crash like 2000 & 2008 in 2019-20?
You can say, it’s a safe guess 🙂
This is really awesome post and i am very happy to read this, thanks,
Hi, Very nicely written and explained.
Nice and detailed analysis!!!
Thanks
Super information !
Thanks
Excellent data compilation
.
Thanks
Very informative article. It would be further great if you can suggest few stocks that one can buy during present market crash.
Mani, excellent work. I have read a lot of articles in your blog. How could I contact you. Wanted to buy couple of ur books.
Thanks for your feedback.
Regarding e-books you can check this link.
You can contact me by email at: contact@getmoneyrich.com
Great Article and facts.
Thanks
Very interesting article presenting facts in a very simple manner and articulating opportunity correction presents for investors. Happy Investing.
Your feedback is appreciated. Thank you Gaurav.