
The purpose of this blog is to highlight how a user can use The Stock’s Engine to analyze stocks online. One of my acquaintances was using a free portal for stock analysis. Recently, I showed him our Stock Engine. He immediately commented, “these are the answers that I wanted from a stock portal. Though The Stock’s Engine is not free, it’s worth its price.” He motivated me to write an article highlighting the utility of The Stock’s Engine for its users. For quick answers please read the FAQs.
Introduction
The Stock’s Engine is our in-house developed app that can be used to analyze stocks online. It is not just a stock screener or a reporting tool, it actually does stock analysis. How? Two main questions need answering while analyzing stocks. First, is the company in consideration fundamentally strong? Second, what’s the fair price for purchasing a stock? Our offering, The Stock’s Engine, can answer both of these questions and can do more.
The Stock’s Engine is not only about the intrinsic value or overall score. It aims to make the whole process of stock analysis intuitive for its users. How? Check the below infographics.

A Video Guide
The 5-Step Process of Stock Analysis
- Step#1: Access an Online Stock Analysis Tool
- Step#2: Screen Stocks
- Step#3: Compare Stocks
- Step#4: Access The Stock Report (Details)
- Step#5: Analyze Stocks (Comprehension)
Step#1 (Access An Online Stock Analysis Tool)
It starts with the investor’s access to a tool that covers all good and relevant stocks of the Indian stock market. The Stock’s Engine is designed to cover about 1,100+ number stocks in the Indian stock market. The stocks are handpicked and included in the list. There are two limitations: Bank stocks and stocks with less than 10-Years of trading history are excluded. As of date, the algorithm of the Stock’s Engine cannot interpret a banking model. But if you want to know more about how to analyze bank stocks, and stocks with smaller trading histories, check the two links.
Step#2 (Screen Stocks)
All stocks are not worth investing in. How to identify investment-worthy stocks? This is where stock screeners become handy. The Stock’s Engine is equipped with two types of stock screeners.

First, is our Big Screener. Here the users can screen stocks based on their own screening criteria. For example, if one wants to screen stocks with low PE and high ROIC, it can be done using the Big Screener.
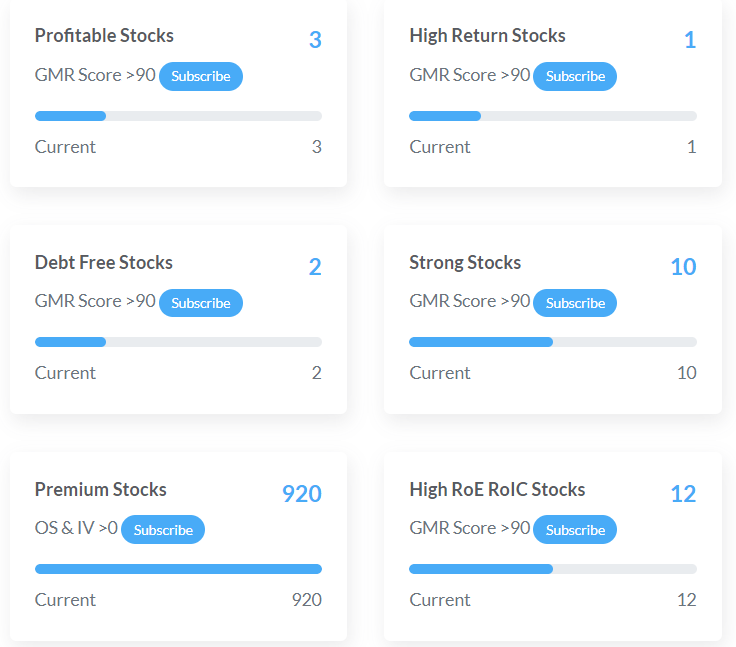
Second, is Screener Themes. Here there are multiple pre-built screeners like growth, high profitability, wide moat, undervaluation, strong fundamentals, etc. Users can access these themes to get a ready list of screened stocks. Each screening theme has its own GMR Score algorithm. The higher the GMR score the better. Generally speaking, stocks with the highest GMR scores in a theme are worth further analysis.
Step#3 (Compare Stocks Data)
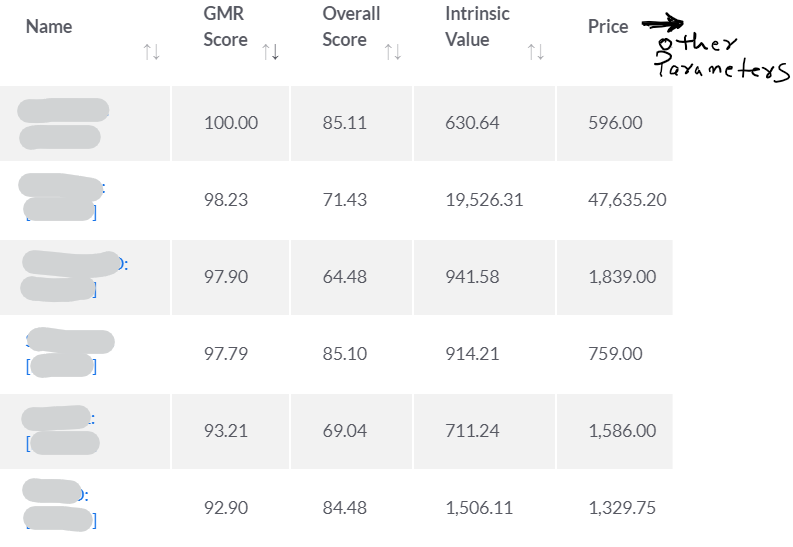
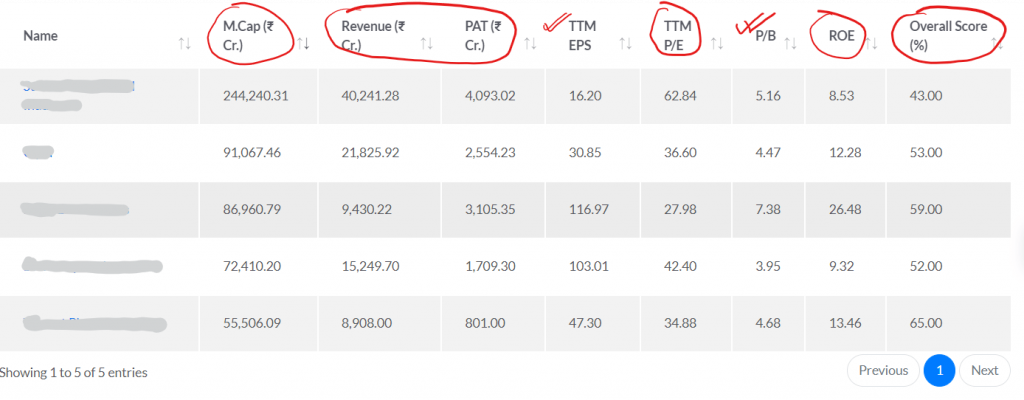
Once a user enters a screening theme, the app will display a list of filtered stocks. The first three columns of the screener will display the GMR Score, Overall Score, and Intrinsic Value. In addition to these numbers, other theme-specific columns will also be visible. A typical filtered screen will look like this:
How a user can interpret the displayed data?
- GMR Score: Please note that the GMR Score is a theme-specific score. A stock may display different GMR scores with the change in the screening theme. For example, a stock may score higher in the “Growth” theme but may score less in the “undervaluation” theme. A general rule is, the higher the GMR score the better. The range of this score is from zero to 100.
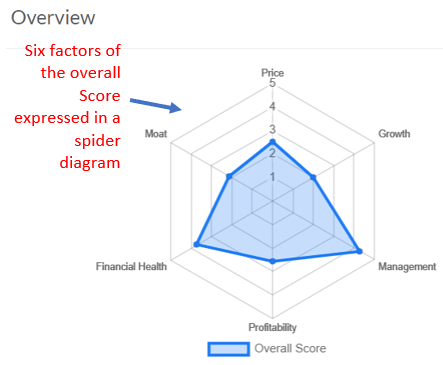
- Overall Score: One of the core algorithms of The Stock’s Engine calculates the overall score for its stocks. What is the overall score? It checks the business fundamentals of a stock. The business fundamentals are checked based on six parameters. Price, growth, management, profitability, financial health, and moat. A general rule is, an overall score of 75% or more makes a stock interesting.
- Intrinsic Value: The Stock’s Engine uses multiple valuations and mathematical models to estimate the intrinsic value of stocks. Then there is a dynamic algorithm that combines the values of each model to project a single intrinsic value. As a general rule, if a stock’s price is lower than the estimated intrinsic value, it is undervalued.
A stock with high GMR and Overall Scores which is also undervalued, becomes worthy of deeper analysis. How deeper analysis is done? By visiting the individual stock page. Please read further to know more.
Step#4 (Access A Stock’s Report)
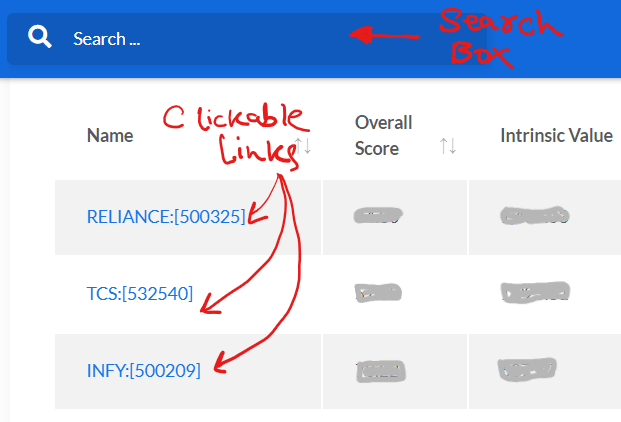
There are two ways of accessing a stock report. First, by the use of the search box. Second, by clicking upon the links provided in the stock screener results.
I once got this question from a user. He asked, “if the screeners already give away the GMR Score, Overall Score, and intrinsic value why the user should worry about the final stock report?“
Considering the genuineness with which the question was asked, I decided to answer it with honesty. This was my short and specific answer. “I feel proud of the algorithm that runs behind The Stock’s Engine. But no matter how much I praise my algorithm, it is not perfect. Hence, all scores and values can best be treated as pointers. They can only give a hint. But what is more reliable are the company’s financial numbers. The ‘final stock report’ makes the numbers more comprehensible for the users.”
How the final stock report does it? Let’s read more about the final report.
Step#5 (Analyze Stocks – Comprehend The Final Report)
Here is the structure of the final report of individual stocks displayed by The Stock Engine.
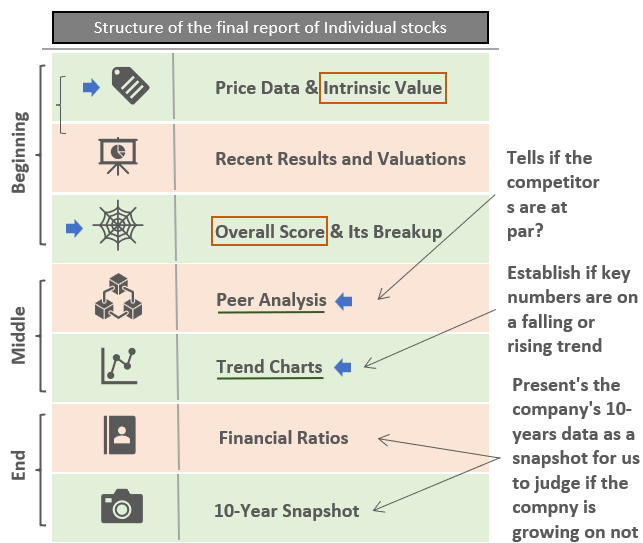
There are three sections of the report.
Beginning: Intrinsic Value To Overall Score
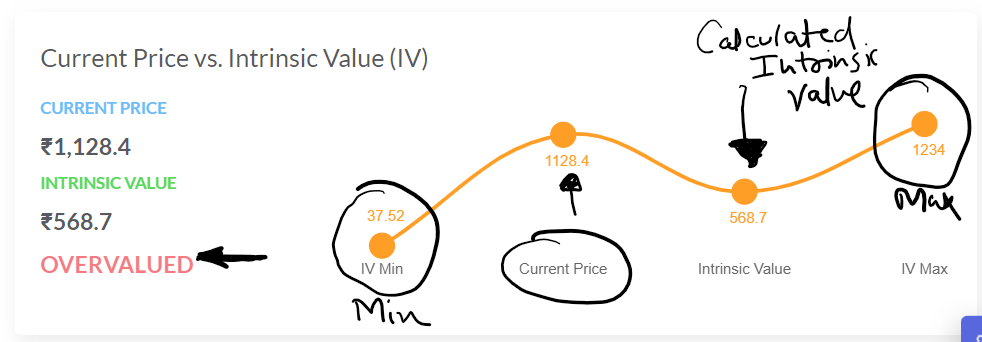
Intrinsic Value: The report starts with a comparison between a company’s stock price and its estimated intrinsic value. Here, the users will get an answer to an important query. What is the stock’s fair price? The Intrinsic value is shown as a range, between minimum and maximum values. The actual value will fall somewhere within this range. The algorithm’s estimated intrinsic value is also indicated. It is then compared with the stock’s current price to show under or overvaluation.
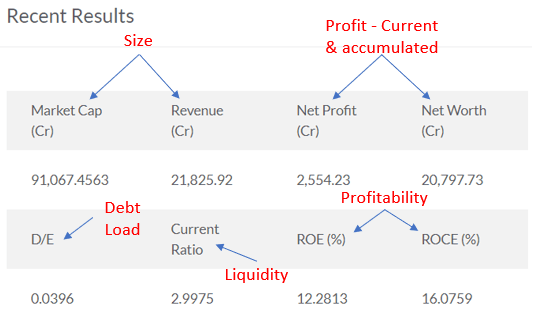
Recent Results & Ratios: Few recent financial data and performance metrics in the form of ratios are indicated. This set of data immediately gives a first impression of the company to the user of The Stock Engine. Though single-year data is not as useful, before going into details, a quick glance helps to build a perspective.
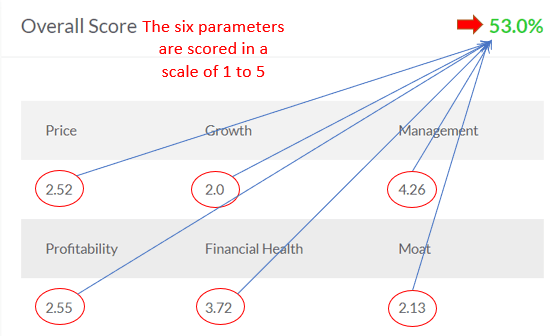
Overall Score and Break-up: It is a very important metric of the Stock’s Engine. It highlights the fundamental strengths of a company. The score is expressed as a range from 0 to 100. An overall score of 75%+ points at a fundamentally strong business. This is an important metric for stock analysis. Six factors are considered to build an overall score – price, profitability, financial health, growth, management, and competitive moat. These six parameters individually contribute to building a score between 0 and 100.
Middle: Peer and Trend Analysis
Peer Analysis: This part of the report is very useful. One can compare the company in consideration with other companies of the same industry. This kind of comparison highlights, if there are other similar companies that are better placed than ours. How to make this judgment? By comparing the parameters like the Overall Score, P/E, Market Cap, Revenue, Profit, etc.
Trend Analysis: This is again a very useful section of the report. It allows users to visualize if some key metrics are on a rising or falling trend. By default, a 5-year trend is displayed unless the label indicates otherwise. As an investor, our margin of safety shall be higher for companies showing falling trends. Allow me to explain it with a few examples.
- Sales Trend: Below is an example of small-cap stocks whose sales numbers were between 60 to 100 crores in the last 5-years. What is interesting about this stock is the CAGR at which its sales have grown in these 5 years (13.24% per annum).

- EPS Trend: It is plotted for the same company that was growing its sales as shown above. It’s EPS trend is even better. The EPS has not only remained positive for the last five years, but it has also grown faster.
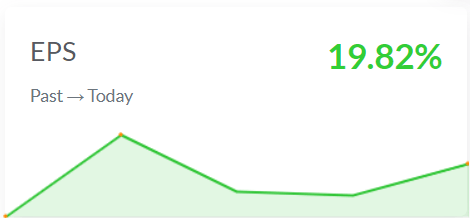
- Price Trend: There are multiple price trend charts available in the Stock’s Engine. One such trend is shown by the 1-Year trend chart. Our example company whose sales and EPS grew at 13.24% and 19.82% respectively, has seen a -19% price decline in the last 1-Year. Just for info, the same stock is trading at a PE multiple of 30.
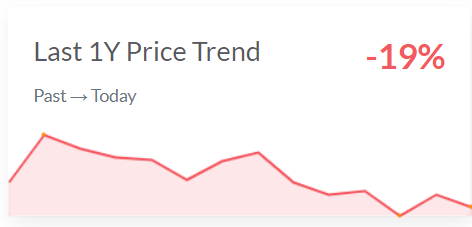
You can see, just by looking at the trend charts, how easy it becomes to make a first impression about the company. The main purpose of the trend analysis is to locate a stock whose fundamentals are on the up but price is showing a downward trend. Such stocks will soon correct their price trend and start following their fundamentals.
End: Ten-Year Snapshot of Financial Ratios & Results
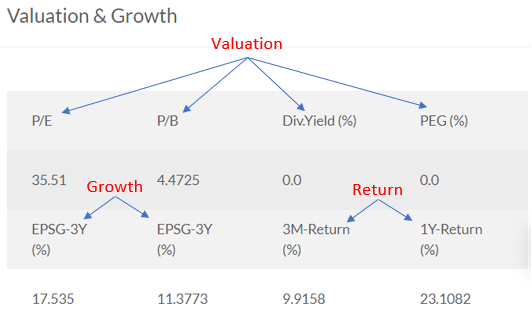
Generally, we look at one-year ratios to conclude if a company is profitable, growing, or undervalued. For Example, a company showing an ROE of 18%, a Sales growth of 12%, and a P/E ratio of 19 will look interesting to you, right?
But suppose, upon looking at its last 10-Year ROE numbers, you found that in the last five years its ROE has fallen consistently from 27% levels to 18% levels. You would not prefer a stock whose ROE is depreciating, right?
This is the advantage of looking at historical data instead of standalone data. The Stock’s Engine will show the following historic numbers as a snapshot:
- Financial Ratios:
- Liquidity Ratios (like current ratio).
- Solvency Ratios (like the D/E ratio).
- Efficiency Ratios (like Margins).
- Valuation Ratios (like PE, PB, PEG, etc).
- Financial Results:
- Quarterly Report.
- Balance Sheet.
- Profit & Loss Account.
- Cash Flow Report.
FAQs
Getmonyrich’s “The Stock Engine” is one of the stock analysis tools available online. But what makes our stock engine unique is the algorithm at the back end. The algorithm churns the last 10-Year price and business data and converts them into Intrinsic Value, Overall Score. Users can use a 5-step process to do the stock analysis. It also has pre-built stock screening themes that filter good stocks from others.
Stocks can be analyzed using two approaches, technical or fundamental. Our Stock Engine’s approach is through fundamental analysis. It helps the users to execute the 5-step process of stock analysis. In this approach, the users will evaluate a company for its fundamentals by knowing its overall score. As the Engine also estimates a stock’s intrinsic value, the user can also do a price valuation check. Peer analysis and trend analysis can also be done.
Getmonyrich’s “Stock Engine” can help users to analyze stocks quickly. Use the pre-built stock screening themes to filter good stocks. Then, check their overall score, intrinsic value, and current price. A stock whose Overall Score is above 75% and whose price is undervalued becomes a good candidate for consideration.
To make it more reliable, all pre-built screeners have their own GMR Scores. What is a GMR score? It is a theme-specific algorithm. Suppose, you’ve selected a Growth Stocks screener theme. This theme has its own algorithm that will rate stocks based on their growth potential alone. A stock that scores high in a growth theme may not score as high in an undervaluation theme. Generally, an undervalued stock with a high overall score will score well in different screening themes (with some exceptions).
The Stock Engine comes with a paid subscription plan. Users can subscribe for a 3-Month, 6-Month, or 12-Month plan. The 1-year plan comes with a maximum discount offer of 45%.
The user can follow the 5-step process for stock analysis indicated above. The process combines stock screening and fundamental analysis to do deeper scrutiny of stocks.
Its ability to estimate intrinsic value and calculate the overall score for its stocks makes it different from other tools. It calculates these two numbers by digging into the 10-Year financial and price data of stocks. Hence, if the intention is to analyze stock online, the overall score and intrinsic value number make it easily comprehensible.
Thanks for reading this article through to the end. If you found it useful please consider sharing it or leaving your comment below.
Have a happy investing.
Suggested Reading:


Can we load existing portfolio into this engine and see whether the stocks are fairly valued or not?
You can check (search) constituents stocks from a portfolio add them to the watchlist. The watchlist will display the stock’s intrinsic value and price
Need help on how to find teh 10 Year Financals [ I already have subsecription for next 1 year].
The Stock Engine new algorithm display’s 5 years data.
The financial algorithm has been coded in a way that five years data churning is as effective as 10 years data.
Sir actually you are very well verse in all about the valued stocks. Hence i want to subscribe your channel. How it will better for me how it will be fruitful for me. how can i converse with you to grow my knowledge.