The Indian stock market has two main indices, Sensex and Nifty-50. Sensex is the index of BSE and Nifty-50 is of NSE. Sensex has 30 number stocks as its constituents and Nifty has 50. In this article, we talk about Sensex 30 companies and their weightage in the Index (see stock weightage here).
In case, you are interested to know how Sensex is calculated, read here. You will find a seven-step description of the calculation.
Topics:
List of Sensex Weightage Stocks 2025
[Updated: January 03, 2025]
| SL | Name | Industry | Price | Mcap Full (Cr.) | M.Cap FF (Cr.) | WEIGHT(%) |
|---|---|---|---|---|---|---|
| 1 | HDFC Bank | Banks | 1749.3 | 1,337,307.97 | 1,323,934.89 | 14.53 |
| 2 | ICICI Bank | Banks | 1265.5 | 894,260.94 | 894,260.94 | 9.82 |
| 3 | RIL | Integrated Oil & Gas | 1251.35 | 1,691,546.61 | 845,773.31 | 9.29 |
| 4 | Infosys | IT Consulting & Software | 1940.1 | 805,581.75 | 700,856.12 | 7.69 |
| 5 | ITC | Cigarettes,Tobacco Products | 482 | 6,05,566.78 | 448,119.42 | 4.92 |
| 6 | L&T | Construction & Engineering | 3660.95 | 502,864.65 | 427,434.95 | 4.69 |
| 7 | Bharti Airtel | Telecom Services | 1594 | 907,915.78 | 426,720.42 | 4.68 |
| 8 | TCS | IT Consulting & Software | 4099.25 | 1,481,968.65 | 414,951.22 | 4.56 |
| 9 | Axis Bank | Banks | 1084.2 | 334,270.58 | 307,528.94 | 3.38 |
| 10 | SBI | Banks | 793.5 | 708,436.34 | 304,627.63 | 3.34 |
| 11 | M&M | Passenger Cars & Utility Vehicles | 3187.25 | 395,193.46 | 280,587.36 | 3.08 |
| 12 | Kotak Mahindra Bank | Banks | 1839.15 | 364,472.00 | 269,709.28 | 2.96 |
| 13 | HUL | Housing Finance | 2405.5 | 564,336.58 | 214,447.90 | 2.35 |
| 14 | HCL Tech | IT Consulting & Software | 1947.25 | 527,048.03 | 205,548.73 | 2.26 |
| 15 | Bajaj Finance | Holding Companies | 7411.5 | 456,262.19 | 205,317.98 | 2.25 |
| 16 | Sun Pharma | Pharmaceuticals | 1848.5 | 443,506.24 | 199,577.81 | 2.19 |
| 17 | Tata Motors | Passenger Cars & Utility Vehicles | 790.4 | 290,956.11 | 165,844.98 | 1.82 |
| 18 | NTPC | Electric Utilities | 339.85 | 329,589.68 | 161,498.94 | 1.77 |
| 19 | Maruti | Passenger Cars & Utility Vehicles | 11910.95 | 374,483.33 | 157,283.00 | 1.73 |
| 20 | Power Grid | Electric Utilities | 316.15 | 293,527.06 | 143,828.26 | 1.58 |
| 21 | Titan Co | Other Apparels & Accessories | 3449.2 | 305,544.92 | 143,606.11 | 1.58 |
| 22 | Ultratech | Cement & Cement Products | 11749.9 | 339,219.68 | 132,295.68 | 1.45 |
| 23 | Tata Steel | Iron & Steel/Interm.Products | 138.3 | 172,770.85 | 114,028.76 | 1.25 |
| 24 | Tech Mahindra | IT Consulting & Software | 1689.1 | 165,326.92 | 107,462.50 | 1.18 |
| 25 | Asian Paints | Furniture,Furnishing,Paints | 2334.25 | 223,776.05 | 105,174.74 | 1.15 |
| 26 | Bajaj Finserv | Finance (including NBFCs) | 1697 | 270,953.56 | 92,124.21 | 1.01 |
| 27 | JSW Steel | Iron & Steel/Interm.Products | 914.55 | 223,074.31 | 86,998.98 | 0.96 |
| 28 | Wipro | IT Consulting & Software | 294.45 | 309,156.50 | 83,472.26 | 0.92 |
| 29 | Nestle | Packaged Foods | 2232.55 | 215,330.04 | 79,672.11 | 0.87 |
| 30 | IndusInd Bank | Banks | 998.1 | 77,593.55 | 65,954.51 | 0.72 |
7 Facts about Sensex 30 Companies
The Sensex 30 companies grouped to become a bellwether index. Why is an index like Sensex required? Tracking the movement of a bellwether index gives an idea of the market’s trend. A carefully selected group of companies can also replicate the trend of the country’s economy. A rising index is symbolic of a growing economy. Though it is not always the case, the trend of a bellwether index mostly replicates the pulse of an economy.
Point #1: What is S&P BSE Sensex?
It is a bellwether index of the Indian economy. There are 30 number stocks included in this index. These 30 companies are the largest and the most traded (liquid) companies in their sectors. The size and trading volumes ensure that they are true representatives of their sector/industry. Moreover, companies from a range of sectors/industries are included in the index. This variety of companies enables an index like Sensex to mimic the trend of its economy.
The base year for S&P BSE Sensex is 1978-79. The launch date of Sensex was 01-Jan’1986
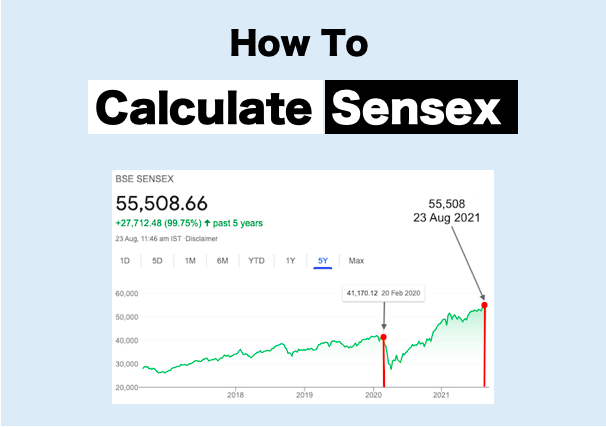
Point #2: What does it mean when we say Sensex is at 55,000 points?
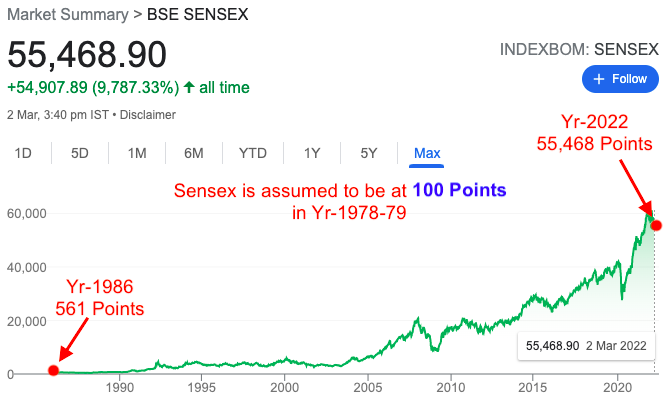
The base year for S&P BSE Sensex is 1978-79. In this year, it is hypothetically assumed that Sensex was trading at 100 points.
The launch date of Sensex was 01-Jan’1986. On this date, the Sensex traded at 561 points (see the above chart). What do 561 points mean? As compared to the Years 1978-79, the index went up 5.61 times till 1986, in 7 Years.
Similarly, when we say that Sensex is at 55,000 points in the year 2022, this is a comparative number concerning the years 1978-79 (100 points).
Between the years 1979 and 2022, Sensex has appreciated from 100 to 55,000 points. This is a growth rate of about 15.8% p.a. in 43 years.
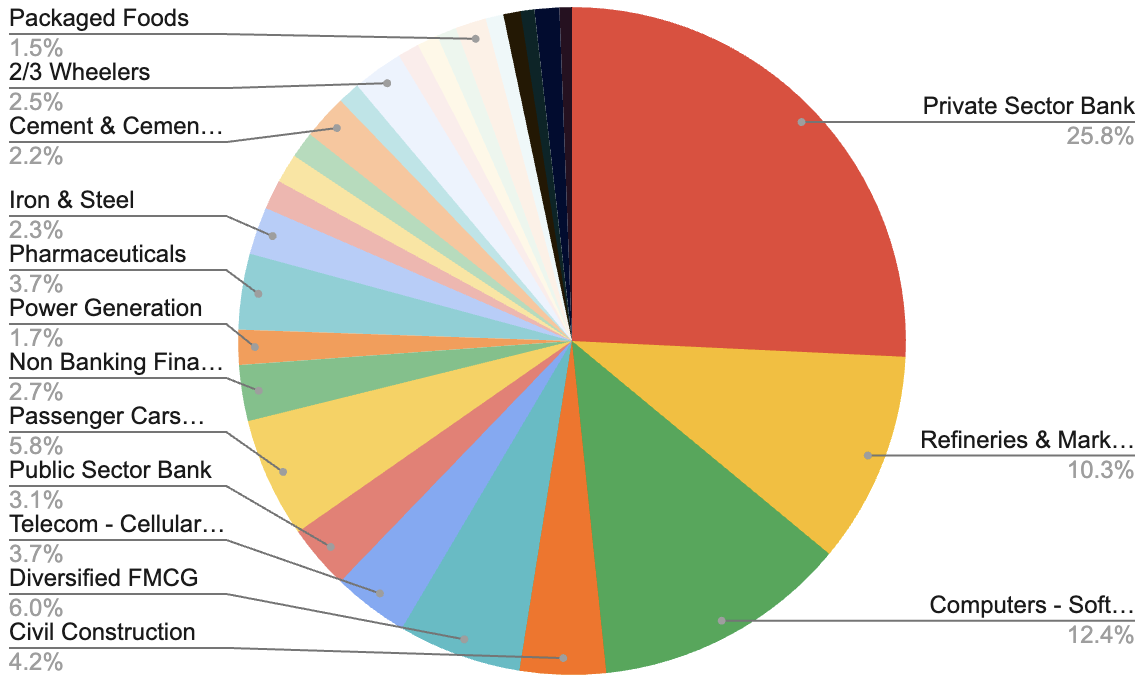
Point #3: Sector/Industry Weightage in Sensex
Presently, the Sensex 30 companies cover 18 sectors (industries). The list of sectors covered by this bellwether index is listed below. The weight of each sector is also indicated.
The weight of the banking sector is most dominant in the index, followed by IT, and Oil & Gas.
| Industry | Weight |
| Private Sector Bank | 25.75 |
| Refineries & Marketing | 10.25 |
| Computers – Software & Consulting | 12.35 |
| Civil Construction | 4.16 |
| Diversified FMCG | 5.99 |
| Telecom – Cellular & Fixed line services | 3.69 |
| Public Sector Bank | 3.12 |
| Passenger Cars & Utility Vehicles | 5.83 |
| Non Banking Financial Company (NBFC) | 2.71 |
| Power Generation | 1.69 |
| Pharmaceuticals | 3.67 |
| Iron & Steel | 2.31 |
| Gems, Jewellery And Watches | 1.43 |
| Power – Transmission | 1.42 |
| Paints | 1.27 |
| Cement & Cement Products | 2.17 |
| Coal | 1.07 |
| 2/3 Wheelers | 2.45 |
| Oil Exploration & Production | 1.04 |
| Port & Port services | 1.02 |
| Aluminium | 0.96 |
| Packaged Foods | 1.49 |
| Trading – Minerals | 0.86 |
| Holding Company | 0.84 |
| Tea & Coffee | 0.67 |
| Life Insurance | 1.20 |
| Hospital | 0.60 |
(Updated: 19-June-2024)
Point #4: What is Free Float vs Full Market Capitalization?
Visit the BSE India website and search for stock. On the stock page, you will find two market capitalizations mentioned for each stock. The first will be Full Market Capitalisation, and the second will be Free Float Market Cap.
What is the difference?
- Free Float Market Cap: represents those shares of the company which is readily available for trading. Out of the total number of stocks issued by the company, only a part of it is actively traded in the market. These active stocks build free-float market capitalization.
- Full Market Cap: represents all shares issued by the company. Needless to say, that free float market cap will always be less than or equal to the full market cap.
Free Float Market </= Full Market Cap
Calculation of Free Float Market Cap
If you check a stock’s shareholding in moneycontrol, you will find them categorized into the following two types:
The stocks held by promoters are not used in the calculation of free-float market capitalization. Only public shareholdings are considered for free float calculation.
But there are more filters (within public shareholdings as well). Like “Public Locked-in Shares” are not considered to calculate free-float market cap. Check this example for free-float market cap calculation:
Stocks that are not included in the free-float market cap are listed below:
- Promoters held stocks.
- Anyone holding stocks who has an interest in controlling the company.
- The government of India held stocks
- Stocks held by the agency through the Foreign Holding Route.
- Anyone holding stocks with a strategic focus.
- Group companies held stocks.
- Employee Welfare Trusts held stocks.
Point #5: How is the weight of stocks calculated in Sensex?
First, we list down all 30 stocks of Sensex. Then note down the Free Float Market Cap against each of the 30 stocks. You will get the values from bseindia.com (stock page). Once this is done, add the market cap of all 30 stocks.
The individual weight of stocks can then be calculated as shown below:
The higher is the market cap (free float) of a company, the higher will be its weightage in Sensex. A simplistic representation of how weightage is calculated is shown below:

Point #6: Which companies are selected for Sensex?
There is no partiality in the selection of Sensex companies. All companies which are listed on the Bombay Stock Exchange (BSE) can be included in Sensex. As of date, about 4500+ companies are listed in BSE.
The stock exchange follows screening criteria to shortlist stocks for Sensex. The companies listed in BSE are categorized into 4 groups.
- A Group,
- B Group,
- T Group &
- Z Group.
#1. Preconditions
- Z-Group companies are excluded: These are companies which has not complied with BSE regulations.
- IPOs: cannot be included in Sensex. To be eligible for Sensex, companies must be listed in BSE for a minimum of 3 months.
- Daily Trading: In its past 3-month cycle, the company’s stock must have been traded daily.
- 4Q Reporting: The company must have reported its sales turnover (total income) for the last 4 quarters.
#2. Screening
Once the above preconditions are satisfied, the company is allowed to go through the following screening process:
- Screening 1 (Free Float): The shortlisted companies are listed in order of their “average three-month float market capitalization.” Only the top 75 ranked companies are considered for further screening.
- Screening 2 (Full Market Cap): All companies are ranked based on their full market capitalization (3 months average). Again, the top 75 ranked companies are selected.
- The companies shortlisted in 1 & 2 above (75+75) are combined to form one list.
- Screening 3 (Trading Volume): The list of combined companies is then ranked once again based on their average traded volume (of the last 3 months). Companies whose cumulated value traded is <98% are excluded from the list.
- Screening 4 (Weigh): Balance companies are again ranked based on float-market capitalization. Companies that had calculated weight of less than 0.5% are again excluded.
The balance that remains (Top 30) – gives the final list of the Sensex 30 companies.
Point #7: Why Know Sensex Stocks Weightage?
Why should we worry about a stock’s weightage in Sensex as an investor? Frankly speaking, we should not care about it.
Our target should be “to locate any stock which is fundamentally strong and is also undervalued”.
But how to identify fundamentally strong stocks? This is where the stock included in bellwether indices like Sensex and Nifty can help.
Ideally, the identification of fundamentally strong stocks which is also undervalued is done through fundamental analysis and price valuation. For some, the task of this analysis might look like too much effort. Such a person can look towards Sensex 30 companies.
This list is a shortcut to finding fundamentally strong stocks. Stocks with high weightage in Sensex are necessarily ones with the strongest business fundamentals.
Tracking these stocks is a good way to start the process of stock investing. Read: About Google Finance portfolio tracker.
Conclusion
It is good to invest in strong stocks. How to find them? We can look for stocks included in the bellwether indices like Sensex and Nifty. These companies are the top blue-chip stocks available in the country. In Sensex, we have 30 number such stocks.
We can either invest in these stocks directly or indirectly. Indirect investing can be done through index funds or Exchange-traded funds (ETFs). These funds which track BSE SENSEX are can be bought online. Both mutual funds and ETFs can be bought using online trading accounts.
Both index funds and index ETFs, whose theme is Sensex, hold only those stocks that are constituents of Sensex’s portfolio.
Frequently Asked Questions
The Sensex is a benchmark index of the Bombay Stock Exchange (BSE) comprising 30 actively traded stocks. The constituent stocks include HDFC Bank, Reliance, Infosys, TCS, HUL, ICICI Bank, Kotak Mahindra Bank, L&T, Axis Bank, SBI, M&M, Asian Paints, Bajaj Finance, Maruti, Nestle, Bharti Airtel, and Sun Pharma.
HDFC Bank (13%) and Reliance (11%) are the two heaviest stocks in Sensex. ICICI Bank (9%) and Infosys (6%) are next two stocks in the weight list. L&T, ITC, TCS, and Airtel have each about 4% weight in the Sensex index.
The BSE Sensex is an index that tracks the performance of 30 number large, well-established and financially sound companies listed on BSE. These companies are selected based on market capitalization, liquidity, trading volume, and sector representation. They are picked to provide a broad view of the Indian equity market’s performance.
The Banking sector have the highest weight in Sensex (29%). The private sector banks wight about 26% and public sector banks have 3% share by weight. The IT Sector (Computers – Software & Consulting) have about 12.5% wight in the Sensex. Refineries & Oil Marketing companies have about 10% weight. Automobile sector have 8.5% weight.
HDFC Bank (after the merger of HDFC Bank and HDFC Ltd) has the highest weight in the Sensex. Their combined weight has increased to 13.72% as of June 2024.
Want to dive deeper in to Sensex? Check out these articles:
Can you provide this for Nifty too as per 31st march 2023.. Thank you
You can Find it on NSE website. Click on factsheet of NIFTY 50. you will be able to do top 10 stocks by weight. For weights of all 50 stocks, you need to do some digging on nse website though its available there.
How do you calculate SENSEX value? Please explain by picking 2-3 stocks which are listed in SENSEX30.
Index Divisor means what exactly?
100%
Hello Sir, you rightly mentioned about Sensex. Will you please also add the same content article for Nifty 50 index? Because we will get to know which companies are common in Sensex & Nifty, the proportion of it, weighted, etc Thank you
Pl. confirm if The Base value of Market Cap is Market cap of same 30 Sensex companies which are in sensex today. In case any company was not existed at 1978-79 then how its value get considered?
BSE keeps altering the constituents of the indices (like Sensex). Few old companies goes out and new ones comes in. Idea is to include only those companies which can represent their whole sector.
Example: Calculation of Sensex is a different mathematics. If suppose, todays Free Float M.Cap of 30 key stocks is 3060511 and base value year 1978-79) is 100. All assume that the Market Cap of base index (1978-79) was say 8800. In this case the Sensex value will be equal to 3060511×100/8800 = 34,700.
Hi Mani,
I happened to stumble upon your blog through my cousin.
Fantastic blog in simple terms for every one to understand.
Great work Mani. Please continue.
Nirmal
How i self calculate closing sensex number in 3.30 pm
Can u tell me sensex..31642.70 has come friday i shell be highly obliegd for ur kindness
Nice. But sector weightage is not matching with the sum of individual weightages for each sector as U have written above. For example, RIL will be in Oil & Gas sector so if 12.37% is its weight, then it alone surpasses housing finance, whereas in diagram of sector weightage U have written that oil & gas sector weight is less than housing finance. Can U plz explain?!
Infographic related to the sector (Sector Weightage in Sensex) is old.
Sir,
I want to invest in the top funds of NIFTY50 or BSE index fund. Please let me know to start a regular investment in these funds.
Regards,
Neeloy
To reduce risk one should investment in first 7 sensex weight age holding companies repeatedly when it available 15%less price from 52 weeks maximum price and one will get 5% profit with in short period and this type 5 times receiving profit per year will lead to make principal ammount 1.25 times every year.