This article provides real-world examples and applications of the WACC. It is a critical concept used by companies in investment decision-making. As an investor, you will gain valuable insights on how to use WACC to evaluate investment opportunities and make informed decisions.
The Weighted Average Cost of Capital (WACC) is a financial concept. It highlights the minimum acceptable return that a company must earn on its investment projects to meet its investors and lenders expectations. WACC represents the average cost of finance for a company. The source of funds can include both debt and equity.
Let’s start with the basics of WACC and then gradually we’ll go into the details:
How to calculate WACC
WACC is calculated by taking the weighted average of the cost of equity and the cost of debt, with each cost being weighted by its respective proportion in the company’s overall capital structure. The formula for WACC is:
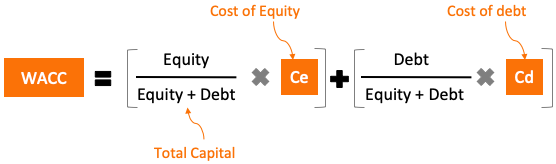
- Equity = market value of the company’s equity
- Debt = market value of the company’s debt
- Equity + Debt = total market value of the company’s debt
- Ce = cost of equity
- Cd = cost of debt
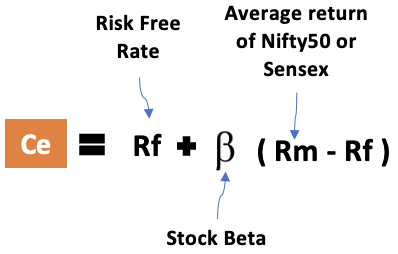
The cost of equity (Ce) is typically calculated using the Capital Asset Pricing Model (CAPM), which takes into account the risk-free rate, the expected market return, and the company’s beta.
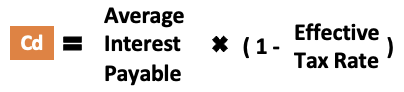
The cost of debt (Cd) is calculated using the yield to maturity on the company’s debt, adjusted for taxes. The overall cost of debt is also adjusted for any financing costs associated with the debt.
The calculation of WACC is complex. But it is a crucial financial metric that is used to determine the minimum rate of return required on investment projects. This information is crucial, both for the company and also for the analysts and investors.
With this understanding of the formula, one is better equipped to apply WACC in real-world scenarios and make informed financial decisions. So let’s look at a few WACC examples to get a better hold of the topic.
Examples of WACC of Different Companies
In this section, we’ll calculate the WACC of a few Indian companies. These examples will demonstrate how WACC can be calculated and used to evaluate the financial viability of potential investments. Stock analysts can also use the WACC values as a discount rate number.
WACC is the average cost of capital of a company. It can also be understood as a minimum acceptable return the company earns to satisfy its investors and lenders. This information tells the company about how to allocate capital and ensure that a sufficient ROI is yielding.
Let’s delve into the details of WACC examples with calculations.
Example #1: Dr. Lal PathLabs
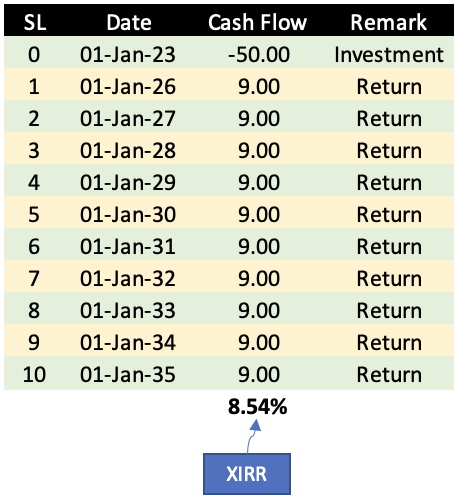
Suppose, Dr. Lal PathLabs is considering investing in a new diagnostic center. The cost of the project is estimated to be Rs. 50 crore (in 01-Jan-2023). The expected return of Rs.9 crore is expected from 01-Jan-2026. This cash-in flow will continue for the next 10 years till the year 01-Jan-2035 (see below table). Using these numbers as our basis, the expected return on investment (ROI per annum) for the company is about 8.54% per annum.
The company wants to evaluate whether to go ahead with this investment (project) or not. To get the answer, the company must compare its WACC with the project’s ROI. So, let’s calculate the WACC of Dr. lal PathLabs.
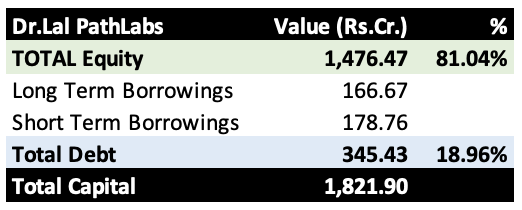
Capital Structure
The company’s current capital structure as of March 2022 is 81% equity and 19% debt.
Cost of Equity (Ce)
Let’s estimate the cost of equity (Ce) of the company. Following will be our assumptions:
- Risk-Free Rate (Rf) = 7.1% per annum.
- Stock Beta = 0.54
- Average Return on the market = 12% per annum.
Using these numbers let’s calculate the cost of equity (Ce) for the Dr. Lal PathLabs.
Ce = Rf + Beta x (Rm – Rf)
Ce = 7.1 + 0.54 x (12 – 7.1) = 9.75%
Cost of Debt (Cd)
Let’s estimate the cost of debt (Cd) of the company. Following will be our assumptions:
- Average interest payable: 10% per annum.
- Effective Tax Rate: 35%
Using these numbers let’s calculate the cost of debt (Cd) for the Dr. Lal PathLabs.
Cd = Average Interest Rate x (1 – Eff. tax rate)
Cd = 10 x (1 – 35%) = 6.5%
WACC
To determine whether this project is financially viable, the company needs to calculate its WACC.
Using the above numbers of Dr. Lal PathLabs, let’s calculate the WACC of the company:
WACC = Equity% x Ce + Debt% x Cd
WACC = 81% x 9.75 + 19% x 6.5 = 9.13% per annum.
The WACC of 9.13% is the minimum acceptable return that the company must earn on the project to satisfy its investors and lenders.
Inference: As the expected return on investment (8.54%) is less than the company’s WACC – the cost of capital (9.13%), the project is not financially viable.
Example #2: Hindustan Zinc vs Balaji Amines
Suppose an investor wants to invest in companies having a high ROCE. He did his research and found that Hindustan Zinc and Balaji Amines are two companies with high ROCE numbers of about 50%. Now he should pick either of the two for investing.
On what basis he should pick his stock? He can calculate the WACC of both companies. For the same ROCE, the company with a lower WACC becomes a preferable choice.
So, let’s calculate the WACC of both companies:
Cost of Equity (Ce)
We’ll start with the cost of equity. I’m assuming the risk-free rate of 7.1% per annum. It is the value taken from the yield of a 10-year government bond. I’m also assuming the average market return of 12% per annum taking a clue from the historical growth of Nifty50 (read this report).
| Description | Hindustan Zinc | Balaji Amines |
| Risk-Free Rate (Rf) p.a. | 7.10% | 7.10% |
| Stock Beta | 0.64 | 0.93 |
| Average Market Return (p.a.) | 12% | 12% |
| Cost of Equity (Ce) | 10.24% | 11.66% |
Out of the two stocks, as Hindustan Zinc’s beta is lower, its cost of equity is also lower at 10.24%. Balaji Amines cost of eqity is 11.66% as per CAPM model.
Cost of Debt (Cd)
Now we’ll take up the cost of debt. I’m assuming that, as Hindustan Zinc is a much bigger corporation than Balaji Amines, its interest cost will be lower at 9% per annum. I’ve assumed Balaji Amines’ interest cost of 10% per annum.
| Description | Hindustan Zinc | Balaji Amines |
| Average Cost of Debt | 9.00% | 10.00% |
| – Tax Expense Rs.Cr. – A | 4,777.00 | 115.20 |
| – Profit Before Tax Rs.Cr. – B | 15,297.00 | 423.14 |
| Effective Tax Rate (=A/B) | 31.23% | 27.23% |
| Cost of Debt (Cd) | 6.19% | 7.28% |
After considering the effect of the effective tax rate, the cost of debt (Cd) of Hindustan Zinc is 6.19% and that of Balaji Amines is 7.28%.
WACC
Finally, we’ll estimate the WACC for both companies. But to do it, we must know about their capital structure.
| Description | Hindustan Zinc | Balaji Amines |
| Shareholders’ Equity Rs.Cr. | 12,942.00 | 1,192.39 |
| – Short-Term Borrowing Rs.Cr. (A) | 10,362.00 | 0.00 |
| – Long-Term Borrowing Rs.Cr. (B) | 1,519.00 | 0.00 |
| Total Debt Rs.Cr. (A+B) | 11881.00 | 0.00 |
| Total Capital | 24823.00 | 1192.39 |
| Equity (%) | 52.14% | 100.00% |
| Debt (%) | 47.86% | 0.00% |
Now that we have the capital structure of both companies, we calculate their WACC (cost of capital) using the WACC formula:
| Description | Hindustan Zinc | Balaji Amines |
| Equity % | 52.14% | 100.00% |
| Cost of Equity (Ce) | 10.24% | 11.66% |
| Debt % | 47.86% | 0.00% |
| Cost of Debt (Cd) | 6.19% | 7.28% |
| WACC | 8.30% | 11.66% |
Inference
For the sake of simplicity, I’m just assuming all other factors are equal for both companies. However, it is important to consider other factors such as management quality, competitive advantages, industry trends, and valuation before making an investment decision.
The investor can conclude that Hindustan Zinc is a better investment option as compared to Balaji Amines. This is because both companies have the same ROCE, which indicates that they are generating the same amount of return on their employed capital.
However, Hindustan Zinc has a lower WACC, which means that the cost of capital for the company is lower. Hence, it can generate more ROE for its shareholders.
On the other hand, Balaji Amines has a higher WACC, which means that it is incurring higher costs to finance its operations and growth. It may not be able to generate as much ROE for its shareholders.
Limitations of Using WACC
While WACC is a commonly used metric for evaluating investment opportunities, it is not without its limitations and challenges.
- Almost All Values Are Assumed: An analyst can assume a lot of future values for a company while calculating the WACC. The assumptions can be like risk-free rate, stock beta, average market returns, effective tax rate, the average interest paid on debt, etc. Changes to these assumptions can significantly impact the calculated WACC. Hence, as analysts change, the WACC of a company will also change. It makes WACC a less reliable metric for decision-making.
- Inappropriate Risk Analysis: Cost of equity (Ce) is the theoretical return a company shall pay to its shareholders for the risk they are taking by investing in the stock. What is the measure of the risk? It is stock beta. But the potential risk of loss for an investor cannot be quantified only by the stock beta.
These above assumptions can impact the final WACC number and the decision-making. The actual cost of capital of the company may be low, but an analyst’s flawed assumptions make inflate it. The inflated cost means a higher risk of loss for the investors. So many people may end up not investing in the company for the sake of high WACC which is not the case. An inverse of this logic is also true.
Scenarios and WACC
In a bullish market, the analyst may assume a higher average market return. As a result, the calculated cost of equity (Ce) of the company will be higher. Assuming that there are no changes in the company’s fundamentals, assuming a higher WACC for a company sounds unfair, right?
Similarly, in a rising interest rate scenario, the analyst may assume a higher interest rate paid on borrowed money. As a result, the calculated cost of debt (Cd) of the company will be higher. In a falling interest rate scenario, the cost of debt will come out as lower. Though in reality, there might not be any change in the cost of debt for the company.
Despite these challenges, WACC remains a widely used metric for estimating the cost of capital of companies. As far as I know, there are no other financial models that can do the work more efficiently than WACC.
Conclusion
WACC is a critical tool for investors and companies looking to make informed investment decisions. Through the calculation of the weighted average cost of capital (WACC), investors can use the WACC metric to compare the return potential of a company. Two companies are expected to yield the same returns in the future, but the one with a lower WACC would attract more investors.
This article has provided an overview of how to calculate WACC. We have also seen WACC examples of a few real-world companies. The examples were posed as queries that better explain the utility of WACC for companies and for investors.
The article also highlighted the limitations and challenges of using WACC. In the calculation of WACC, there are far too many assumptions that make WACC a less reliable metric. But for informed and experienced analysts, WACC works pretty fine.
Have a happy investing.