
To do fundamental analysis of companies, it is important to look inside financial statements. There are three types of financial statements: The balance sheet, profit & loss accounts, and cash flow statement.
These three documents has loads of numbers inside them. What a beginner should look for inside these reports? We will know about it in this article.
People who are not accustomed to reading these three reports may find it overwhelming. Why? Firstly because the report is full of financial jargons. Secondly, there are some really deep numbers which will not make sense to newbies.
Have you ever faced such a difficulty in stock analysis -Yes? Do not worry. This article is meant for people like you who are doing stock analysis for the first time.
Numbers To Look Inside Financial Statements
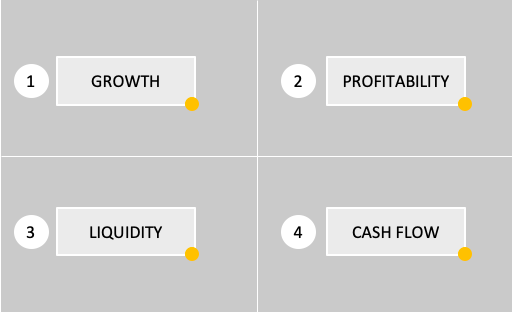
These are four basic but unavoidable business attributes of a company: growth, profitability, liquidity and cash flow. Stocks of companies will not be attractive for investors unless they display positive financial metrics in each of these four attributes.
How to analyze these attributes? This is what we will see in this article. I’ll share the screenshots of reports like balance sheets etc of an example company (Cummins India). This will help in visualising the process of stock analysis. I’ve taken screenshots of reports as available in moneycontrol.
These screenshots will help you when you will take the task of stock analysis on your own. I hope you will enjoy this article. I’ll try to explain the concept without use of any jargons or confusing words, phrases etc. So let’s begin….
Type of Company

No matter how big is a company, it is only useful for investors till it is growing. But not all companies can grow as fast. Growth rate of Blue chip companies are slow but certain. Stocks of growing companies will show faster growth rates, but their market reach may not be as wide as blue chips.
So as an investor, it is essential to first become clear that you would like to buy stocks of blue-chips or fast-growing companies. Once this clarity is in place, prepare a list of your 4-5 numbers favourite stocks. Check my watchlist
The next steps after preparation of this list is to evaluate each of these stocks based on the following four attributes (parameters).
1. Growth

Open the profit & loss accounts. The financial metric that we will look inside this report is growth of its “total income” and of its “reported net profit (PAT)“.
Total income numbers can be found in one of the top lines of profit & loss accounts. Net Profit (PAT) can be found among the bottom lines of the same report.
To analyze the growth rates, one must look across the five year data. This will give an idea of how the income and PAT has grown within this time span.
The first thing that we would like to see is a parallel line between income and PAT. This shows that the company is not only growing, it is also maintaining its profitability. A parallel line is an indicator of a wide Moat (Warren Buffett likes such companies).
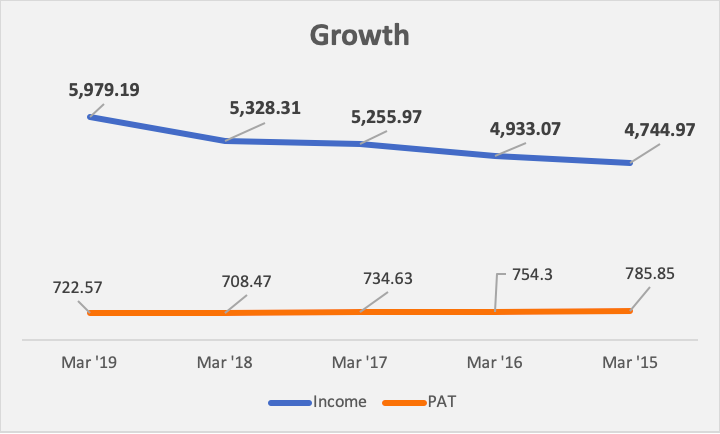
In case of Cummins India, the total income has grown from Rs.4,744 Crore to Rs.5,979 Crore (@4.7% p.a). But its PAT has shrunk from Rs.786 Crore to Rs.723 Crore (@-1.7% p.a.). [Check detailed report of Cummins India here.]
Hence the gap between the two lines (income vs PAT) has been widening. This is symbolic of increasing competition. To maintain its market share, the company is probably compromising on its profitability. Read: Analysis of profit margins.
In a short span of time, sluggish growth rate is understandable. But if the gap is like ever-increasing, it is a big red flag.
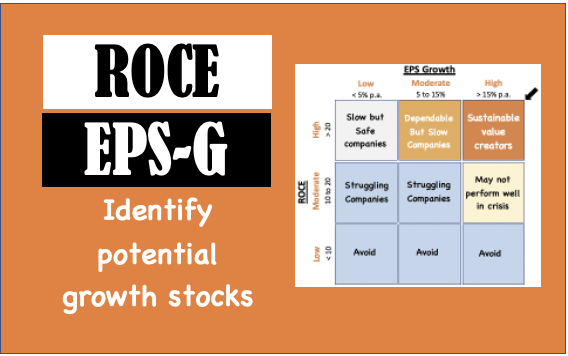
2. Profitability
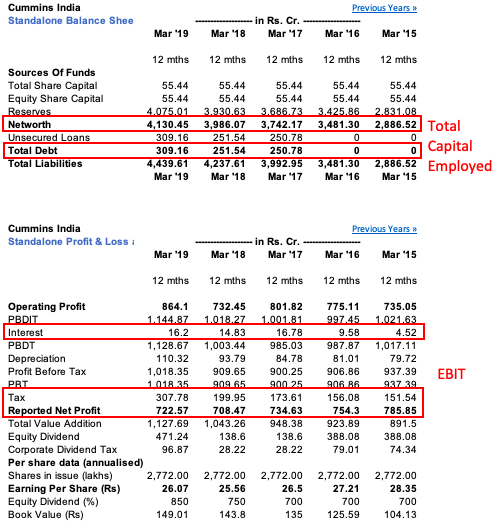
For me, the best measure of company’s profitability is RoCE (Return on Capital Employed). To calculate RoCE, data must be fetched from two financial reports.
- EBIT: (= PAT + Tax + Interest) must be pulled from profit & loss accounts.
- Capital Employed: (=Equity Capital + Reserves + Total Debt) must be pulled from the balance sheets.
RoCE is a ratio of EBIT and Capital Employed. What RoCE basically highlights is the profit that the company is able to generate relative to the total money it is using to do business.
As an investor, we would like to see a straight or an upward-moving line for RoCE. This is a sign of improving profitability (more profit per unit cost). This can be used as an interpretation of strong business fundamentals.

In case of Cummins India, what we can see is a downward-moving line. The profitability (RoCE) has reduced from 32.6% to 23.6% in last 5 years. But in last financial year ending Mar’19, a sign of RoCE revival is also evident.
A company which is generating a high EBIT for per-unit capital employed automatically becomes a preferred choice of investors. But to get a better meaning of RoCE, it must be compared between two similar companies (of same sector).
3. Liquidity
It is one of the most important metric to look inside financial statements of any company.
A company which can remain sufficiently liquid will continue to survive even at low growth rates and low profitability. Conversely, even a highly profitable and growing company might cease to exist if it lacks the liquidity.
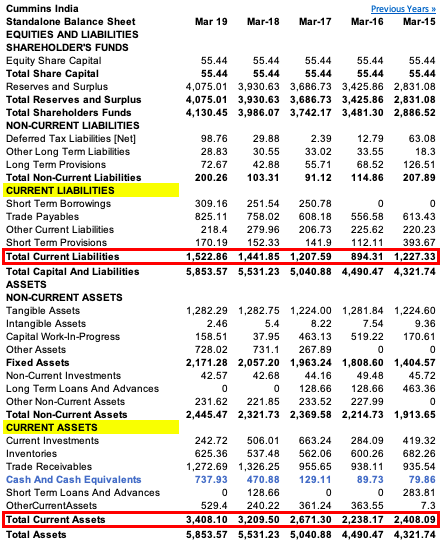
To ascertain if the company has enough liquidity, one must compare between the current assets and current liability.
Current assets represents the amount of cash the company has, or is going to generate in next 1 year. Current liability represents the cash-demand that the company will have to meet in next one year.
A company which is not able to meet the demand of its current liability, for an extended time period, will cease to exist. In case of Cummins India, the position of liquidity can be seen by the two horizontal lines (see the below chart).
How to analyze liquidity?
- Use Charts: Generally current ratio or quick ratio is used to to check the liquidity. But I prefer to start analysis with a line chart. How to use a chart? First, the current asset line must remain consistently above the current liability line. Second, the gap between the two line should remain constant or increasing with time. This is one of the best displays of strong fundamentals. Observe the two lines for Cummins India (gap is increasing).
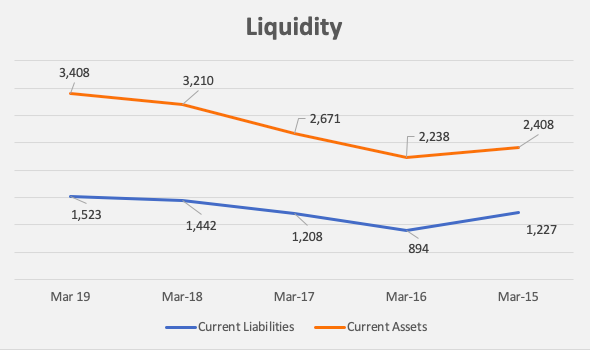
- Use Ratios: When we see parallel lines in the above chart, it is a symbolic of a strong management. You can see that the ratio between current asset and current liability (Current Ratio) is maintained consistently at 2:1 levels. Current ratio of 2:1 is a safe level. For companies whose cash flows are faster, even lower ratio (below 2) can be said to be healthy. But generally speaking, current ratio of 2 is safe.
4. Cash Flow
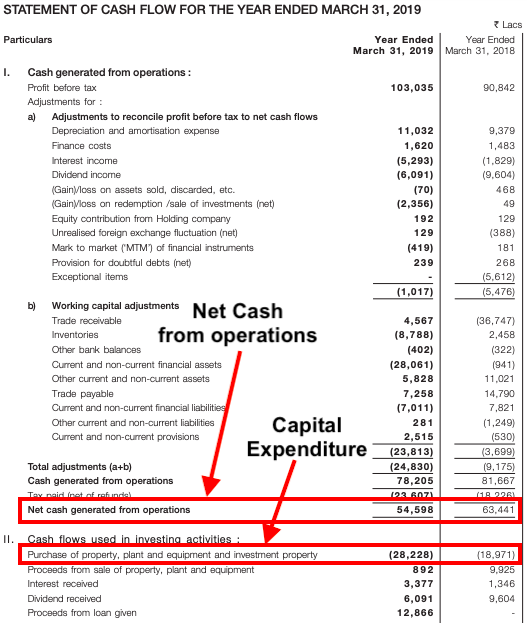
The screenshot of cash flow statement shown above is taken right from the annual report of Cummins India. This report is very detailed. The cash flow report of moneycontrol does not carry all the information (like details of Capex etc).
To study cash flows of a company, the first number that must be pulled from the report is “net cash from operations.
“Net cash generated from operations” is not same as “net profit”. Net cash generated from operations represents the net cash which has been collected from the customers after making the due payments.
But it is not sufficient for companies to generate enough cash only to make vendor payments, pay salaries, pay bills etc. It must generate a bit extra. Read: How company’s use retained earnings?
The generated cash flow must be enough to take care of capital expenditure (Capex) as well. The balance money which remains after incurring Capex is the real net profit of the company’s shareolder’s (owners). In Warren Buffett’s language it is called “Owner’s Earnings” or Free Cash Flow.
Free Cash Flow
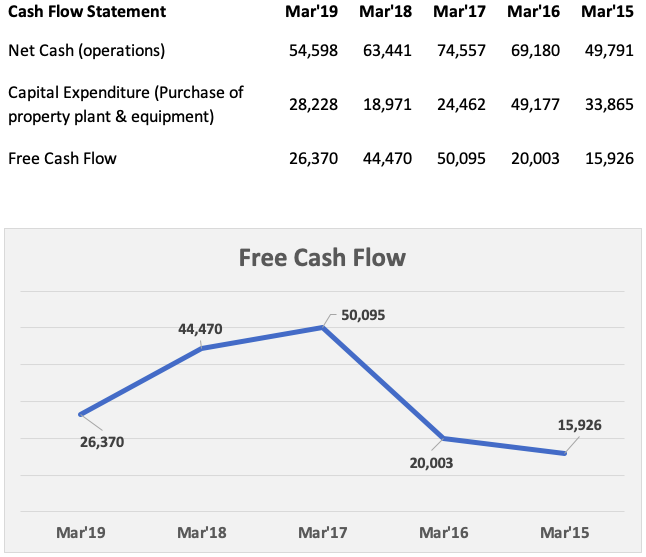
Cummins India has consistently maintained positive free cash flow in last five years.
Why free cash flow is important? Free cash flow is that money which is shareholder’s (owner’s) real profit. If majority shareholders decide, this money can be paid back to the shareholders as dividends.
But point is not about dividend payment. Free cash flow is symbolic of owner’s “real profits”. This profit is accounted with respect to the “real cash” received in the hands of the company.
A company which is posting high “Net Profit (PAT)” numbers in profit and loss a/c but is not collecting enough cash, will show negative free cash flow. Such PAT is of no use to the shareholders of the company.
Conclusion
If one wants to invest in stocks with an objective of long term holding, looking into the financial statements of the underlying company is essential. In this article we have seen what to look inside financial statements.
What to look in the financial statements? Quick check can be done about the past growth rates, profitability, liquidity position and free cash flows.
If all these parameters are showing positive signals, then one can consider the stock as a potential investment, “No“. Why? Because no matter how good are a company’s fundamentals, one cannot buy its stocks at an overvalued price levels.
What shall be done next? It is important to do price valuation of the stock. But there is an easier alternative. I’ve a developed an excel based tool using which one can evaluate a company’s fundamentals, and can also check its price valuation.
Cummins India
- Check fundamental analysis of Cummins India done using my stock analysis worksheet. To know more about the worksheet check it here.
Have a happy investing.


Hi Mani
Loved reading your write-up about investing, how to read balance sheet and more. Can we connect for investment advise/consulting?
Thanks for nice article . This is one of the best article of your website , great efforts Mani . one query I have bought your stock analysis worksheet and that too works wonderfully , and simple tool . I was able to arrive at intrinsic value of many stock , this VALUE is valid for one quarter or one year , means how frequently I need to re enter data in to it .
thanks
regards
Price changes daily, and reports are updated quarterly. If the user wants, the updation can be done with every price change. But I prefer to do it once in 6/12 months (unless there are sudden price rise or falls – as happening these days). Thanks for your feedback.
Great insights, Mani. You simplify finance and financials to a good extent. One suggestion on charts – can you make the charts to show the latest year on the right? For Financial Reports the latest year is always on the Left for ease of reading but for charts it should be on the right. For example, the charts in this article should have Mar’15 as first entry, Mar’16 as second…..Mar’19 as the last. It is easy to interpret data when displayed like this as we are used to read from left to right. Plotting chart data from left to right in a chronological order is a standard practice world over. Please have a rethink. Thanks again for a lucid article. Regards,
Thanks for the feedback.