
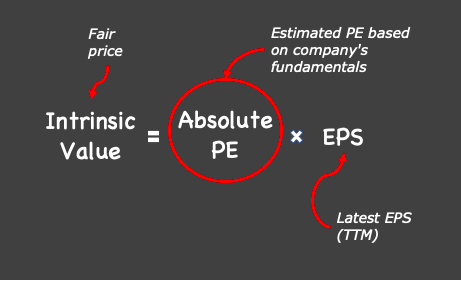
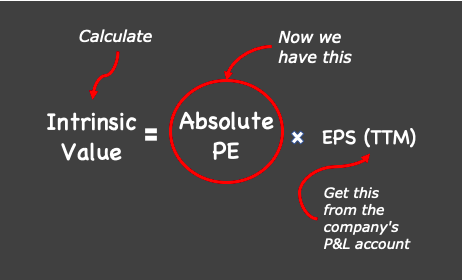
In this method, we first estimate the ‘absolute PE’ of a stock. Then multiply the calculated PE with EPS. This will give us the fair price or intrinsic value of the stock. We will read about this in more detail.
What is the PE formula? Conventional PE = Market Price / EPS. The same formula we can use to estimate intrinsic value using the absolute PE method. How? Check this formula: Intrinsic Value (IV) = Absolute PE x EPS.
Though this formula may look simple, the trick lies in how to calculate the “Absolute PE” of stock in consideration. This is what we will read in this article.
For people who do not have time to do the detailed PE calculations themselves, my stock analysis worksheet can do the calculations automatically upon the click of a few buttons.
Vitaliy Katsenelson & Absolute PE
THE absolute PE Method is a mathematical model invented by Vitaliy N. Katsenelson. He is a CFA and works as a CEO & Chief Investment Officer at a US-based company called IMA.
Katsenelson shared his idea of Absolute PE in his first book called Active Value Investing. He also manages his own blog as a hobby.
The reliability of the absolute PE method is high. Why? First, because the person who has developed it is dependable. Second, the way absolute PE is estimated gives it its reliability.
I’ve used the concept of Vitaliy and applied it in my own way (within my limitations) in my stock analysis worksheet. I’ve tuned it in a way that it works best with my tool. Though the core principle of Katsenelson remains the same.
The way ‘Absolute PE’ is estimated
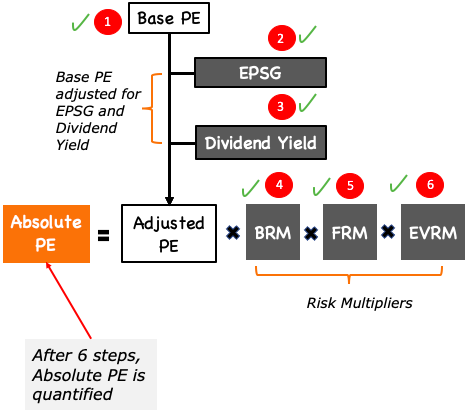
The user has to follow six steps. Following these six steps, what we get at the end is “Absolute PE” of a stock. Here are the 6 steps and the way it’s been used in my stock analysis worksheet:
Adjusted PE
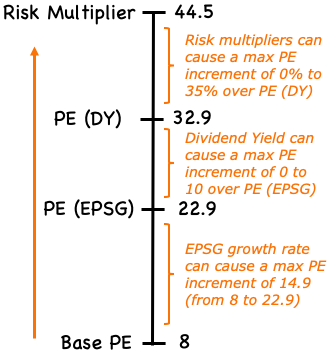
- #1 Step: Base PE – In this step, it is assumed that the stock in consideration has zero future EPS growth probability. For all stocks with zero EPS growth potential, their fair PE is assumed as eight. Let’s call it our base PE (PE8). Read more.
- #2 Step: PE (EPSG) – The past EPS trend of the stock is studied. Based on this, future EPS growth number is arrived at using an algorithm. This growth rate number is then used to adjust the base PE (PE8). Higher EPS growth will make PE8 jump to a higher number than eight. Read more.
- #3 Step: PE (DY) – Like EPS growth rate, dividend-yielding (DY) power of stock is also used to adjust PE. A higher dividend yield will make PE jump to a higher number than estimated in step #2. Read more.
Risk Multipliers
- #4 Step: Business Risk – In this step, the underlying business of a stock is studied. Here we try to judge and quantify the potential business risk associated with a company. The higher business risk will give a smaller ‘multiplying factor’ (BRM). Read more.
- #5 Step: Financial Risk – Like in the above step we try to judge and quantify the potential financial risk associated with a company. The higher financial risk will give a smaller ‘multiplying factor’ (FRM). Read more.
- #6 Step: Earning Visibility Risk – A business whose future earning is less predictable can be said to be risky. The ‘multiplying factor’ (EVRM) of such a business will be smaller. Read more.
Schematic representation of the Absolute PE formula is this:
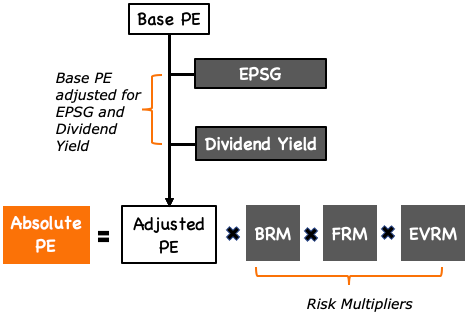
What does this mean? It means each of these six (6) individual factors mentioned above has an influence on the stock’s base PE (PE8). Each of these six factors is evaluated, and accordingly, a justified PE ratio is estimated. What to do with this PE? Read it here in the conclusion.
We will read more about these six factors now.
#1. Base PE (PE8). It’s Zero Growth PE
What is the logic of giving PE of 8 to zero growth companies? Why PE was not 1 or higher than 8? I’m not sure what was in the mind of Vitaliy Katsenelson. But I’ll try to decipher it anyway.
The inverse of PE (=1/PE) is called earning yield. In terms of formula, earning yield = EPS / Price. For zero growth companies assumed PE is 8. The inverse of 8 is 0.125 or 12.5%.
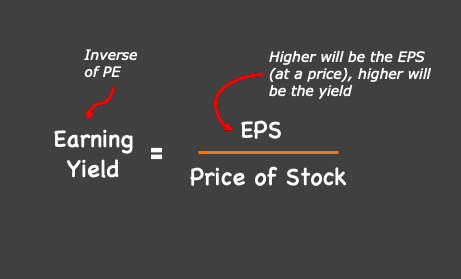
How to read earning yield of 12.5%? It is symbolic of how much return (profit sharing) a stock is capable of yielding for its shareholders. Earning a yield of 12.5% means, for every Rs.100 invested in a stock, the company is capable of generating Rs.12.5 shareable profit (EPS=Net Profit/shares) each year. Higher will be the EPS, the higher will be the earning yield.
[Please Note: Shareholders can claim the full EPS. But they may decide to take only a part of it as dividends. The balance that is left is reinvested back into the business. This reinvested money is displayed in the balance sheet under shareholder’s funds as “reserves”.]
In India, under normal times, a bank FD can yield about 7-8% p.a. interest. If one invests in equity (stocks), the risk of loss is higher. Hence yield expectation is also higher. Historically, the average return from the equity in India (and also around the world) is about 12% per annum.
This can be a sort of minor justification of why Vitaliy Katsenelson picked the number 8 for the base PE.
#2 Premium for EPS Growth
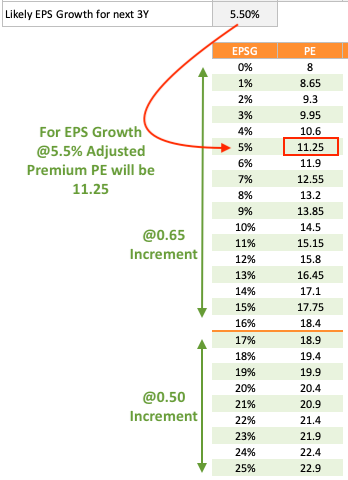
The EPS Growth (EPSG) table indicates how much premium a stock can earn due to its EPS growth potential. As per this table, a stock with an EPS growth potential of 0% can earn a maximum PE of 8. This is what we call base PE.
If a stock has an EPS growth potential of 5.5%, as per Katsenelson’s table, it’s PE will be 11.25. Please note that allotted PE is 11.25 and not 11.9 (see screenshot shown above).
Katsenelson has given an incremental increase of PE by 0.65 points for every 1% increase in the EPS Growth rate (EPSG). Increment of 0.65 is applicable till EPSG is less than 17% p.a. For EPSG of 17% & above, PE increment is 0.5.
Future EPS Growth Estimation
How to know the future EPS growth potential of a stock? The easiest way is to see the EPS trend of the last 7-10 years. Based on the past trend, future EPS Growth (EPSG) potential can be estimated. My stock analysis worksheet uses an algorithm which allots future EPSG to its stocks.
How dependable is future EPS growth estimation? In real-world, EPSG is dependent on several factors like:
- Reserves growth
- Sales growth
- EBITDA growth
- Net Profit growth etc
The interdependence between EPS growth and other factors can be very deep-rooted and intertwined.
#3 Premium for Dividend Yield
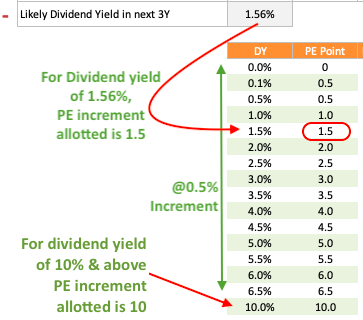
The dividend yield table indicates how much PE points a stock earns due to its potential to yield dividends for its investors.
As per this table, a stock with a dividend yield of 0.3% will earn a PE increment of 0.5.
Example:
Suppose a stock (“ABC“) which has a future EPS Growth of 8.9% p.a. and dividend yield of 0.87% per annum. The stock ABC, allot a premium to its base PE.
- Base PE = 8
- EPS Growth (EPSG) = 8.9% p.a.
- Adjusted PE (after EPSG effect): 13.2
- Dividend Yield (DY) = 0.87%
- PE Increment (after DY consideration): 0.5
- PE (after EPSG & DY) = 13.7 (=13.2+0.5)
#4 Business Risk Multiplier (BRM)
To calculate business risk multiplier, we must first learn to quantify the ‘business risk’ associated with a company. It is a whole subject in itself. But I wanted to implement it for my stock analysis worksheet.
What I had in my hand was a company’s last ten-year financial reports. Hence, I started thinking which numbers, within the reports, will give me a hint about an increasing business risk for a company?
Immediate answer was sales, operating profit, and RoCE. How?
- Sales Growth: Negative sales growth can be the first indicator of business risk. Falling sales is an indicator of ‘loss of market share’. India is a growing economy. For a decent company, a fall in sales will only happen when customers have found a better alternative.
- Negative Operating Profit: No business can survive if its operations are not profitable. When it will happen? When the operating expense is more than its sales revenue. Such a business will eventually close down.
- Negative RoCE: Another way to look at the company’s profitability is to see how it is utilizing its capital to generate profit. Low RoCE is a clear sign of potential risk.
Example:
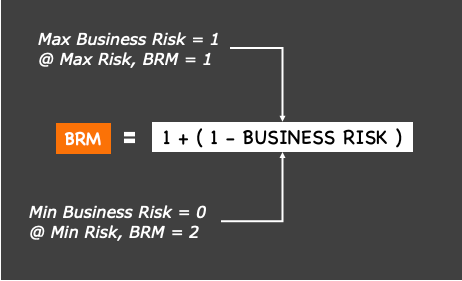
Suppose, our stock “ABC” earns a Business Risk Factor of say 0.78. In this case, it’s Business Risk Multiplier (BRM) will be 1.22
BRM = [1 + (1-Business Risk)] = [1 + (1-0.78)] = 1.22
[P.Note: The higher will be the business risk, lower will be the Business Risk Multiplier]
#5 Financial Risk Multiplier (FRM)
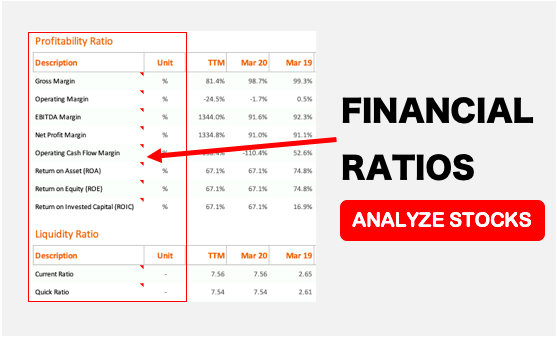
Quantifying the financial risk of a company is comparatively easier than judging a company’s business risk. There are several liquidity ratios available that can be used to judge the financial risk of a company. I’ve used the following in my stock analysis worksheet.
- Quick Ratio: This ratio is a measure of how many current assets (cash, receivables, etc) the company has to meet the demand of its current liabilities. A ratio lower than 1.2 is a sign of risk. Read: about the quick ratio.
- Interest Coverage Ratio (ICR): For companies who rely a lot on debt to meet its capital demand, ICR is a great risk checker. ICR below 3 is a sign of risk. Read: about ICR.
- Net Cash From Oprn: No company can afford to have a negative cash flow from operations. Negative cash flow may happen due to bad financial planning. One quick example can be buying on cash but selling on credit. This will surely lead to negative cash flow no matter how profitable is the business model. It is a big risk. Read: about cash flow from operating activity.
Example:
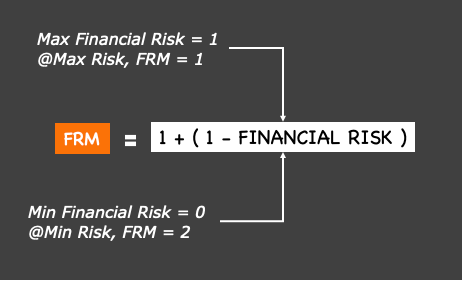
Suppose our stock “ABC” earns a Financial Risk Factor of say 0.65. In this case, its Financial Risk Multiplier (FRM) will be 1.35
FRM = [1 + (1-Financial Risk)] = [1 + (1-0.65)] = 1.35
[P. Note: The higher will be the financial risk, lower will be the Financial Risk Multiplier (FRM)]
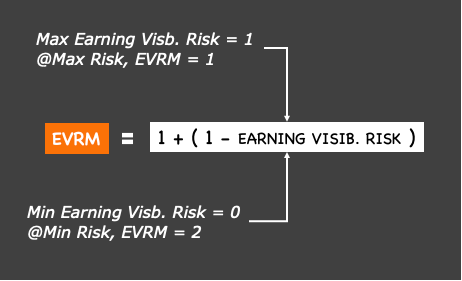
#6. Earning Visibility Risk Multiplier (EVRM)
There could be several ways of quantifying ‘earning visibility risk’. I’ve used the financial metric called Earning Per Share (EPS). How? In two ways:
- Negative EPS: Every time a company posts a negative EPS (or PAT), it falls into a risk zone. But just one year of loss does not make it risky. My stock analysis worksheet checks, in the last 10 years, in how many years it reported a negative EPS. Accordingly, a risk rating is allotted.
- Slow EPS Growth: Companies need to make its EPS grow at least at a minimum pace. The negative EPS growth rate is even more undesirable. My worksheet uses an algorithm for predicting the future EPS growth rate (next 3Y) by studying the last 10 years’ EPS trend. Accordingly, a risk rating is allotted.
Example:
Suppose our stock “ABC” earns an Earning Visibility Risk factor of say 0.8. In this case, its Earning Visibility Risk Multiplier (EVRM) will be 1.2
EVRM = [1 + (1-Earning Visibl. Risk)] = [1 + (1-0.80)] = 1.2
[P. Note: The higher will be the earning visibility risk, lower will be the EVRM.]
The Upper Limit of Risk Multipliers
In our example stock ABC, we’ve arrived at a following Risk Multipliers:
- Business Risk Multiplier (BRM): 1.22
- Financial Risk Multiplier (FRM): 1.35
- Earning Visibility Risk Multiplier (EVRM): 1.2
Total effect of all the three risks will be 1.9764 (=1.22 x 1.35 x 1.2).
But according to Katsenelson’s rule, the impact total risk multiplier shall not be more than 1.35 (35% above the ‘adjusted PE’ – check here). Hence in this case we must readjust the risk multiplier for the stock “ABC” to 1.35 (instead of 1.9764).
Conclusion
What we have done until now? We have followed the six steps which gave us the Absolute PE for our stock. What we can conclude from it? To arrive at a more meaningful conclusion we must take one more step.
What is the next step? Calculation of intrinsic value based on the estimated Absolute PE. Before that, we will also need trailing twelve months (TTM) EPS of the stock. Multiply EPS (TTM) with the estimated Absolute PE. This will give the intrinsic value of the stock.
If the estimated intrinsic value is higher than the current price of the stocks, it is undervalued. If the intrinsic value is lower than the current price, it is overvalued. This is the conclusion. Read more about: The Basics of undervalued Stocks.
Recommended Reading:


Excellent Mr. Mani(sh). Very detailed explanations. Keep up the good work. God Bless
Thanks for reading