
I have already written an article on Systematic Investment Plan (SIP). So why a separate post on SIP return calculator?
Writing a separate post was necessary to explain a very important point about returns from SIP.
To explain the concept of returns from SIP, it was also obvious to code a SIP return calculator.
You can use this online SIP return calculator to get a feel of what I will explain in this blog post.
How this SIP return calculator was born?
One day I received a comment from my reader. The reader asked a very simple question.
“How much return can be generated from SIP in mutual fund?“.
All investors who invest in mutual funds through SIP route have asked this question, right?
From where do we get our answers?
Majority of us use moneycontrol to get the answer.
But there is a big fallacy in the way moneycontrol, or any other financial website represent this figure.
What they display as a result is not wrong, but it can mislead us.
In this article we will unearth this fallacy, and use a SIP return calculator which will help to eliminate our wrong interpretation.
Online SIP Return Calculator
| Data Input | |
|---|---|
| Monthly Contribution (Rs.) | |
| Expected Return p.a. (%) | |
| Time (in years) |
| Report | |||||||
|---|---|---|---|---|---|---|---|
|
[Note: In case of problem in charting, kindly refresh the page calculation]
How websites show the SIP returns?
There is a very nice SIP calculator of moneycontrol. Valueresearchonline also has a similar SIP calculator.
Lets use the SIP calculators of moneycontrol and Valueresearchonline to see what results they show.
Lets do this analysis for HDFC Top 200 Fund (G).
Result of Moneycontrol…
I have assumed the following for the analysis:
- Monthly SIP: Rs.1,000 per month
- Investment Time : 10 Years
Lets see what results are shown by moneycontrol
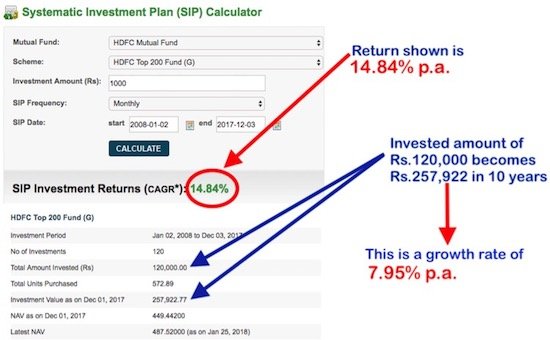
The SIP return calculator shows that by investing Rs.1,000/month for 10 years, HDFC Top 200 Fund (G) has generated 14.84% in last 10 years.
For common men what does it mean?
Their invested money, Rs.120,000 (Rs.1000/month x 10 years), will grow at rate of 14.84% for 10 years.
Do you agree with my above statement?
I am sure, majority will agree.
But here is the fallacy.
When Rs.120,000 grows @14.84% for next 10 years, it will become Rs.478,755 in 10 years.
But you can see yourself that, in reality, the invested money has appreciated from Rs.120,000 to only Rs.257,922 in 10 years.
This is a return (CAGR) of 7.95% per annum (and not 14.84%).
I have checked the same in valueresearchonline and they also display a similar SIP return as moneycontrol.
What is the problem with this SIP return?
The annualised return shown by these SIP return calculators have posed problems for me in the past.
I used to do some of my personal finance management calculations based on the return numbers displayed by these websites.
In this process, my return expectation from SIP was wrong and unreasonable.
As the actual net effective return from my SIP’s were much lesser, my personal financial calculations were going for a toss.
Though the websites were showing that, my mutual fund is giving the desired returns, but the actual value appreciation of my holding units (as shown in investment portfolio) was much smaller.
This prompted me to do some more in depth study on SIP returns.
The result is the development of this SIP return calculator.
This calculator tones down investors inflated expectation from their SIP’s.
What is the correct return of SIP?

The return shown by moneycontrol and other websites are not wrong.
But ones investment can yield those percentage points only if investment is done in lumpsum.
If investment is spread out in phases (like systematic monthly investments – SIP), the yield gets substantially reduced.
Lets understand this with an example:
Lumpsum:
- Invested money: Rs.1,20,000
- Investment Horizon: 10 Years
- Return: 14.84%per annum
- Appreciated value: Rs.478,755
SIP:
- Monthly Investment: Rs.1,000/month
- Total Investment: Rs.1,20,000
- Investment Horizon: 10 Years
- Return (Lumpsum): 14.84% per annum
- Appreciated value: Rs.2,75,925
- Net Effective return of SIP: 8.69%
What moneycontrol and other websites displays are only the return when investment is done in lumpsum.
Though it is not wrong, but it is liable to wrong interpretation by SIP investors.
So, how we can interpret the returns of moneycontrol etc websites:
Example:
- Time horizon: 10 Years
- Return (lump sum): 15%
A mutual fund whose return, when invested in lumpsum is 15%, will generate a SIP return of only 8.79% in 10 years.
You can also use the SIP return calculator provided in this blog to know the actual return of SIP.
How to use this calculator…
The SIP calculator of moneycontrol, valueresearchonline etc are great.
They can highlight “fund specific” returns.
If one is investing in HDFC Top 200 Fund (G), their calculator can highlight SIP return for this specific fund.
I personally like the calculator of moneycontrol as it divulges more details about SIP.
But even these great calculators has a small limitation (misleading return).
Their results are liable for wrong interpretation by common men like me and you.
Hence I decided to code a simple SIP return calculator which will highlight this limitation and give a more realistic result.
A combination of moneycontrol and getmoneyrich’s SIP return calculator will be the best.
The user can first use the calculator of moneycontrol. Note the “Return (CAGR)” which is being displayed there.
The second step will be to use the getmoneyrich’s SIP return calculator to get a more realistic picture of possible capital appreciation over time.
Example – utility of getmoneyrich’s SIP calculator:
Suppose one wants to invest in “HDFC Prudence Fund (G)” through SIP route. The objective of this person is to accumulate Rs.20,00,000 in next 10 years.
Before investing, the person wants to know how much SIP return this mutual fund has given in the past 10 years.
To know this, one goes to moneycontrol and calculates the past return. Result is like this:
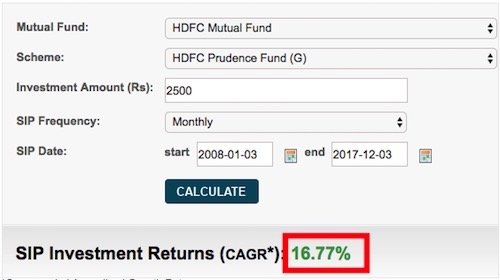
Moneycontrol is showing that, HDFC Prudence Fund (G) has generated an annualized return of 16.77% in last 10 years.
So the person opens his excel sheet and does a small calculation.
Idea is to know how much monthly contribution he should put in SIP to build a corpus of Rs.20,00,000 in next 10 years.
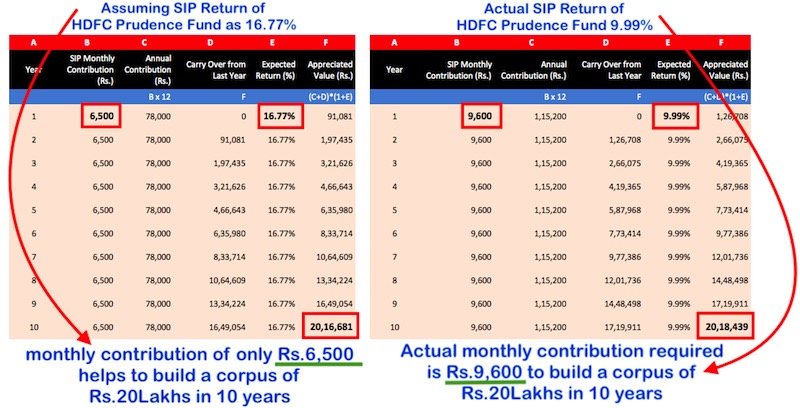
Assuming 16.77% return, his calculation says he will need to invest Rs.6,500/month in SIP to build a corpus of Rs.20 lakhs in 10 years.
But this is a wrong assumption (..fallacy).
He then uses the SIP return calculator of getmoneyrich to obtain a realistic return figure.
HDFC Prudence Fund, whose return when invested in lumpsum is 16.77%, will generate a SIP return of only 9.99% in 10 years.
The result is shown below.
Please note the marked difference and correct yourself if you too were doing the same mistake.
The revised calculation says, he will need to invest Rs.9,600/month in SIP to build a corpus of Rs.20 lakhs in 10 years.
 CLICK HERE TO ENLARGE
Conclusion
Net effective return of mutual fund, when invested through SIP route, is far lesser than when investment is made in lumpsum.
What most of the website display, is the return when investment is made in lumpsum.
Hence, it is important for SIP investors to correct their expectation before starting a mutual fund SIP.
I hope you like this article and its SIP calculator.
Please do put in your reactions in the comment section below…
Have a happy investing.


Makes you think more about consistency and time in the market instead of trying to time it.
The SIP calculator that you have shared has really given me a lot of insight, and this really helped me to target my goal.
Thanks a lot for this lovely article
Hi Sir
For the first time Google has reffered me something best. You are just awesome. Read all possible article. Clear and precise.
Thanks a lot 🙏
Thanks
Oh, then XIRR is also providing incorrect results. We have been considering XIRR as the correct method to assess our returns for SIP investments. Could you please clarify if XIRR is indeed the correct approach?
Additionally, I’m currently 22 years old and investing approximately 16K in index and mid-cap SIPs, along with 5K in a bank RD. Is it advisable to invest 100% in equity at my age for better growth? How can I diversify my investments for better growth?
To know more about XIRR and CAGR, you can please check this article
http://ourwealthinsights.com/roi-formulas-cagr-xirr-meaning/
better to reduce EMI and start SIP with same
that how you can make some saving . isn’t it Mani?
Good idea. It is one way of using the savings arriving out of EMI reduction.
Hi Mani,
Thanks a lot I read your article today and get little bit idea about investment .I am very new and don’t know about investment idea and all. But your article is really very much helpful to me I want to talk to you and need your help .
All SIP calculators on the web are some thumb rule . They take SIP returns to half of the lumpsome.
Actual returns can be higher than lumpsome if the markets corrected in the period and then rebound.
And actual returns can be much lower if the markets rose and fell several times in the period. Therefore actual sip returns depend on the price movements in the period.
None of the sip calcualtors on the web are correct. Only moneycontrol website provides a sip calculator that calculates what would have happened in history if you had invested the planned amount monthly.
Invested 6500 in mutual fund sip for 8 years.
Hi Mani,
Thanks for the article. You are missing the inherent thing i.e. time-gaps among each instalment from beginning to end….& here lump-sum money is not invested …..Internal rate of return is almost correct on moneycontrol & VRO…even excel gives nearby returns compared to them
The values published by websites are not wrong. But how a lay SIP investor interprets that number might lead to wrong results. Hence this article and the calculator.
Hi Mani,
SIP Rs.1000/month after 10 yrs become 2,75,925/-. Check how the effective rate is 14.84% as below excel workout arrived to 2,75,925/- (In this case investor gets the interest compounded monthly…)
Thanks
Date of SIP Op.Bal SIP Int.% Int.Amt Cl.Bal
01-01-2019 0 1000 14.84% 12.37 1012
01-02-2019 1012 1000 14.84% 24.89 2037
01-03-2019 2037 1000 14.84% 37.56 3075
01-04-2019 3075 1000 14.84% 50.39 4125
01-05-2019 4125 1000 14.84% 63.38 5189
01-06-2019 5189 1000 14.84% 76.53 6265
01-07-2019 6265 1000 14.84% 89.85 7355
01-08-2019 7355 1000 14.84% 103.32 8458
01-09-2019 8458 1000 14.84% 116.97 9575
01-10-2019 9575 1000 14.84% 130.78 10706
01-11-2019 10706 1000 14.84% 144.76 11851
01-12-2019 11851 1000 14.84% 158.92 13010
01-01-2020 13010 1000 14.84% 173.25 14183
01-02-2020 14183 1000 14.84% 187.76 15371
01-03-2020 15371 1000 14.84% 202.45 16573
01-04-2020 16573 1000 14.84% 217.32 17791
01-05-2020 17791 1000 14.84% 232.38 19023
01-06-2020 19023 1000 14.84% 247.62 20271
01-07-2020 20271 1000 14.84% 263.05 21534
01-08-2020 21534 1000 14.84% 278.66 22812
01-09-2020 22812 1000 14.84% 294.48 24107
01-10-2020 24107 1000 14.84% 310.49 25417
01-11-2020 25417 1000 14.84% 326.69 26744
01-12-2020 26744 1000 14.84% 343.10 28087
01-01-2021 28087 1000 14.84% 359.71 29447
01-02-2021 29447 1000 14.84% 376.52 30823
01-03-2021 30823 1000 14.84% 393.55 32217
01-04-2021 32217 1000 14.84% 410.78 33628
01-05-2021 33628 1000 14.84% 428.23 35056
01-06-2021 35056 1000 14.84% 445.89 36502
01-07-2021 36502 1000 14.84% 463.77 37965
01-08-2021 37965 1000 14.84% 481.87 39447
01-09-2021 39447 1000 14.84% 500.20 40947
01-10-2021 40947 1000 14.84% 518.75 42466
01-11-2021 42466 1000 14.84% 537.53 44004
01-12-2021 44004 1000 14.84% 556.55 45560
01-01-2022 45560 1000 14.84% 575.80 47136
01-02-2022 47136 1000 14.84% 595.28 48731
01-03-2022 48731 1000 14.84% 615.01 50346
01-04-2022 50346 1000 14.84% 634.98 51981
01-05-2022 51981 1000 14.84% 655.20 53637
01-06-2022 53637 1000 14.84% 675.67 55312
01-07-2022 55312 1000 14.84% 696.40 57009
01-08-2022 57009 1000 14.84% 717.37 58726
01-09-2022 58726 1000 14.84% 738.61 60465
01-10-2022 60465 1000 14.84% 760.11 62225
01-11-2022 62225 1000 14.84% 781.88 64007
01-12-2022 64007 1000 14.84% 803.92 65811
01-01-2023 65811 1000 14.84% 826.22 67637
01-02-2023 67637 1000 14.84% 848.81 69486
01-03-2023 69486 1000 14.84% 871.67 71357
01-04-2023 71357 1000 14.84% 894.82 73252
01-05-2023 73252 1000 14.84% 918.25 75170
01-06-2023 75170 1000 14.84% 941.97 77112
01-07-2023 77112 1000 14.84% 965.99 79078
01-08-2023 79078 1000 14.84% 990.30 81069
01-09-2023 81069 1000 14.84% 1014.91 83084
01-10-2023 83084 1000 14.84% 1039.83 85123
01-11-2023 85123 1000 14.84% 1065.06 87188
01-12-2023 87188 1000 14.84% 1090.60 89279
01-01-2024 89279 1000 14.84% 1116.45 91395
01-02-2024 91395 1000 14.84% 1142.62 93538
01-03-2024 93538 1000 14.84% 1169.12 95707
01-04-2024 95707 1000 14.84% 1195.95 97903
01-05-2024 97903 1000 14.84% 1223.10 100126
01-06-2024 100126 1000 14.84% 1250.59 102377
01-07-2024 102377 1000 14.84% 1278.43 104655
01-08-2024 104655 1000 14.84% 1306.60 106962
01-09-2024 106962 1000 14.84% 1335.13 109297
01-10-2024 109297 1000 14.84% 1364.01 111661
01-11-2024 111661 1000 14.84% 1393.24 114054
01-12-2024 114054 1000 14.84% 1422.84 116477
01-01-2025 116477 1000 14.84% 1452.80 118930
01-02-2025 118930 1000 14.84% 1483.13 121413
01-03-2025 121413 1000 14.84% 1513.84 123927
01-04-2025 123927 1000 14.84% 1544.93 126472
01-05-2025 126472 1000 14.84% 1576.40 129048
01-06-2025 129048 1000 14.84% 1608.26 131656
01-07-2025 131656 1000 14.84% 1640.52 134297
01-08-2025 134297 1000 14.84% 1673.17 136970
01-09-2025 136970 1000 14.84% 1706.23 139676
01-10-2025 139676 1000 14.84% 1739.70 142416
01-11-2025 142416 1000 14.84% 1773.58 145190
01-12-2025 145190 1000 14.84% 1807.88 147998
01-01-2026 147998 1000 14.84% 1842.60 150840
01-02-2026 150840 1000 14.84% 1877.76 153718
01-03-2026 153718 1000 14.84% 1913.34 156631
01-04-2026 156631 1000 14.84% 1949.37 159581
01-05-2026 159581 1000 14.84% 1985.85 162566
01-06-2026 162566 1000 14.84% 2022.77 165589
01-07-2026 165589 1000 14.84% 2060.15 168649
01-08-2026 168649 1000 14.84% 2098.00 171747
01-09-2026 171747 1000 14.84% 2136.31 174884
01-10-2026 174884 1000 14.84% 2175.09 178059
01-11-2026 178059 1000 14.84% 2214.36 181273
01-12-2026 181273 1000 14.84% 2254.11 184527
01-01-2027 184527 1000 14.84% 2294.35 187822
01-02-2027 187822 1000 14.84% 2335.09 191157
01-03-2027 191157 1000 14.84% 2376.34 194533
01-04-2027 194533 1000 14.84% 2418.09 197951
01-05-2027 197951 1000 14.84% 2460.36 201411
01-06-2027 201411 1000 14.84% 2503.16 204915
01-07-2027 204915 1000 14.84% 2546.48 208461
01-08-2027 208461 1000 14.84% 2590.34 212051
01-09-2027 212051 1000 14.84% 2634.74 215686
01-10-2027 215686 1000 14.84% 2679.69 219366
01-11-2027 219366 1000 14.84% 2725.19 223091
01-12-2027 223091 1000 14.84% 2771.26 226862
01-01-2028 226862 1000 14.84% 2817.90 230680
01-02-2028 230680 1000 14.84% 2865.11 234545
01-03-2028 234545 1000 14.84% 2912.91 238458
01-04-2028 238458 1000 14.84% 2961.30 242420
01-05-2028 242420 1000 14.84% 3010.29 246430
01-06-2028 246430 1000 14.84% 3059.88 250490
01-07-2028 250490 1000 14.84% 3110.09 254600
01-08-2028 254600 1000 14.84% 3160.92 258761
01-09-2028 258761 1000 14.84% 3212.37 262973
01-10-2028 262973 1000 14.84% 3264.47 267238
01-11-2028 267238 1000 14.84% 3317.20 271555
01-12-2028 271555 1000 14.84% 3370.59 275925
Hi,
– Rs.1,20,000 invested in lump-sum @14.85% for 10 years will become Rs.4.8 Lakhs.
– But when same Rs.1,20,000 is invested as Rs.1,000 per month @14.85% for 10 years will become Rs.2.76 Lakhs
– Effective Rate on total invested is 8.68%.
[Note: The values published by websites are not wrong. How a lay SIP investor interprets that number might lead to wrong results. Hence this article and the calculator.]
Hi Mani,
First of all a big thanks for the information. I have a doubt regarding the calculation
Now assuming that HDFC Prudence Fund will give 16.77% CAGR (leave about 9.99% for now) for next 10 years, I still need to invest only 6500 pm now to get 20L corpus after 10 years, when I used your calculator, here are numbers entered
Monthly investment : 6500
Expected % : 16.77
time : 10 years
I get 2022166 as appreciated SIP amount. Am I missing something? Please clarify.
If we invest Rs.4,00,000 in lump-sum in HDFC Prudent plan which generates return @16.77%, in 10 years we will have Rs.20 Lakhs.
If we invest Rs.6,500 per month in SIP (Rs.7.80,000 in 10 years) in the same HDFC Prudent plan, in 10 years we will have Rs.20 Lakhs. This is same as having an yield of 9.99% p.a.
Hi Mani,
Your articles are extremely helping even a beginner to understand.Thanks a lot.
Thanks for your feedback.
Thanks for sharing this knowledge. Very useful blog.
Please is mine. Thanks.
Hello Mani,
I am new to investing. I don’t have much idea regarding investments. I went through your articles and I liked them. I want to invest 15000/- per month for 15 years and how can i diversify my portfolio. how many mutual fund i can add in my portfolio for the best return. is it worth to add too many funds in the portfolio?
Kindly help!
Hi, if you are new to investing, better will be to start with “SIP” in “hybrid mutual funds”. Go with those funds which has an equity exposure of not more than 70%.
Extremely helpful article I have ever read regarding MF.Thank you for sharing this.
Thanks for liking.
So then FD would be a better and safe option if the SIP CAGR calculation are all wrong. XIRR calculation gives us the same result?
Hi,
Thanks for your comment.
The value posted by them is not wrong, but yes – the way we interpret that number (return) is wrong. This is what is highlighted in this blog post.
[XIRR is different from what I’ve explained.]
Thanks Mani, hope my kid can be good at this kind of finance education even if not so in academics!
Hello Mani,
I am new to investing as I do not belong to commercial profession I don’t have idea regarding investments. I went through your articles and I liked them. I got the basic idea but still am not able to make out which SIP to select and how to make decision! I want to start investing in SIPs. Could you recommend some good SIPs to invest in if I want to have returns of 10 lacs after 10 years? Is it enough if I invest 1k to 1.5K/month for this?
Kindly help!
Hey Nikesh,
Thanks for asking.
If your investment time horizon is like 10 years, you can go for small cap funds. You can read this article to know more about the type of mutual funds and their potential returns.
Regarding accumulation of Rs.10 lakhs in 10 years, use my SIP calculator to know more. But before using it, try to read the article I’ve suggested. It will help you to estimate the potential returns.
By the way, @14% returns, investing Rs.1,500 per month will build a corpus of Rs.3,93,000 in 10 years.
Hi Mani,
If I decide to start investing a sum of Rs 10000/month in SIP. How many years do I need to keep invested before I can expect a standard monthly income (say Rs 10000) that could be generated from these compounded MF investments?
It will take approximately 8 years. Let’s see an example.
Stage-1
– Investing Rs.10K/month in a MF which yields 14% p.a. returns
– Keep contributing for 8 years.
– Amount generated at end of 8th year = Rs.17.7 Lakhs.
– Redeeming mutual fund units at the end of 8th year.
Stage-2
– Buying a Bank Deposit with Rs.17.7 lakhs.
– Bank Deposit yields 6.8% p.a. interest.
– Monthly income will be approx Rs.10,000 per month.
Indeed a nice post to have come across, I must admit that you have done a sip return calculator
Thank you for the post. I was having the same doubt regarding SIPs this post has cleared all my doubts..
Superb. Thanks for posting your comment.
It’s really nice article..
Will start reading all your articles to get upgraded myself.
Thanks a lot.
Thank you Girish for liking the work.
Nice information I myself maintaining my portfolio account in money control from last 6.5 years.