
Value investors keep looking at the signs of a market crash. Why? Because they make more money during a crash than in normal times. It will not be an overstatement that they crave for the index to crash. Why? Because it is the time to buy the best shares.
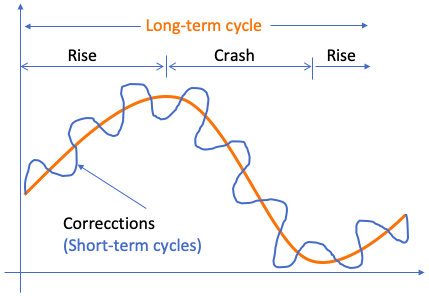
The indices move in cycles. There are short-term and long-term cycles. First, it will climb and then it’ll descend. It is a fact that is carved in stone. Even if one is not aware of the signs of a market crash, its cyclical behavior is proven.
As a rule of thumb, the market crash happens every 10-Years. In between, there can be several corrections. The short-term cycles cause corrections and the long-term cycles cause crashes. Though it is an oversimplification of a complex matter, for a normal person, this understanding will work.
If the market is bullish, it will crash. What remains uncertain is the timing of the crash. Generally, the market crash is triggered by an incident. The 2008 crash was triggered by the fall of Lehman Brothers. The 2020 crash was triggered by COVID-19.
Topics
- Introduction
- #1.Volatile Surge of Index.
- #2.PE Trend.
- #3.Government Bond Yield.
- #4.Trend of Broader Indices.
- Conclusion.
Introduction – Signs of A Market Crash
Why do the markets crash? Either it is reactionary, or it happens when the market becomes too overvalued. News like a declaration of war, pandemic outbreak, stubborn inflation, etc can cause a reactionary crash. But such events are rare. Right? So, more often than not crash succeeds an overvalued market.
As we know, a crash brings a buying opportunity. So, we must keep a watch on the indicators of overvaluation.
How to check if the market is overvalued or not? It is not such a difficult process. There are a few parameters that gives an obvious hint.
Having said that, it is also true that these hints will only suggest if the market is overvalued or not. How soon will the market react to this overvaluation, remains a mystery.
Four Signs
- Volatile Surge in Index: Our stock market work in cycles. In one instance it will go up and then it will fall. A controlled rise-and-fall is a normal behaviour of the stock market. But when index starts to grow amid large volatility, it raises concern. This is the time when market is showing signs of overvaluation. Read more about it.
- PE Trend: We are talking about the P/E ratio of a major stock index (like Nifty and Sensex). We will look at the P/E trend of the past several years (like 10 years). By gauging the trend we will know if P/E is rising or falling. A rising P/E ratio, trading at all time high levels is an indicator of marking becoming overvalued. Read more about it.
- Government Bond Yield: When the gap between the yield of long term bonds and short term bonds is not much, it is a signal of potential trouble. It is a time when investors are not taking risks. It is a signal that the market is overvalued, and it is expecting a crash. Read more about it.
- Trend of A Broader Index: A broader index like S&P BSE 500 is better for this analysis. We can compare the last 12-months trend of S&P BSE 500 index with Sensex. If Sensex shows a higher growth rate than BSE 500, it means that the money is not getting uniformly invested in the market. This is a sign of few top stocks becoming overvalued. Remeber, these top stocks carry the Nifty and Sensex up. Read more about it.
What is suggested above are four featured indicators. We can use them to check if the stock market is currently overvalued or not. If the stock market is overvalued, it is a sign of a market crash happening in near future.
How soon the Market will crash will depend on the degree of overvaluation. Let me elaborate more on the above points. It will also help us to gauge the degree of overvaluation of the market.
1. Volatile Surge in Index
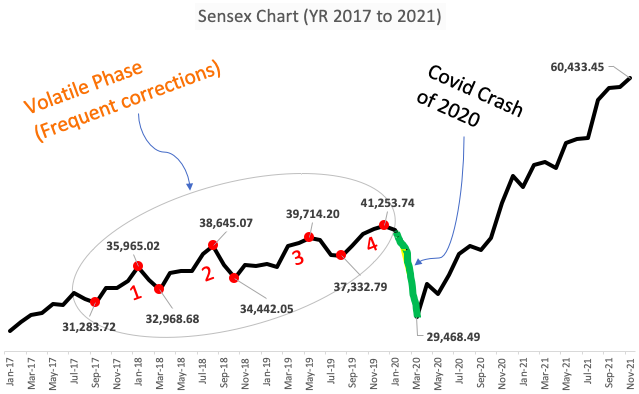
Between the period Sep-2017 and Jan-2020, Sensex growth was marred with volatility. In this period, the Sensex grew from 31,282 to 41,253 points. This is a CAGR growth rate of 13.07% per annum. But within this time frame, there were three (3) frequent corrections. Ultimately in the fourth (4th) instance, the index crashed.
- #1. Sep’17, Jan’18, Mar’18 –: In Sep’17 the index was at 31,283 levels. From that level, it rose to 35,965 levels by Jan’18 (Up by 15%). At that time it was the Sensex’s all time high levels. After Jan’18 the Sensex started to correct for the next Two months. By Mar’18 it corrects to 32,968 (down by 8.3%). It was the first sign that probably the present levels are not sustainable.
- #2. Mar’18, Aug’18, Oct’18 –: From the lows of Mar’18, the Sensex rose to 38,645 levels by Aug’18 (Up by 17.2%). Again, it was the Sensex’s all time high. After Aug’18 the Sensex saw the second correction. By Oct’18 it corrects to 34,442 (down by 10.8%). It was another instance when the index was trying to shed its weight.
- #3. Oct’18, May’19, Aug’19 –: From the lows of Oct’18, the Sensex started to rise again. It rose to 39,714 levels by May’18 (Up by 15%). From from this point, the Sensex saw its third correction. By Aug’19 fell to 37,332 levels (down by 6%).
- #4. Aug’19, Dec’19, Mar’20 –: Aug’19 onwards, the Sesex behaved even more stubbornly. It touched its all time high of 40K+ levels (41,253) by Dec’19. But during that time the news of COVID was first heard in China. The Sensex was silently slipping. Finally in Mar’20 it crashed and touched its bottom of 29,468 by ofApr’20 (down by 28.5%).
Inference from the observations:
The volatility of the index is proof of its hesitation to move up. The hesitant move is derived from the investor’s interpretation of the index’s valuation. Today the Sensex is trading at 60,400 levels. Does it look like it is crashing any time sooner?
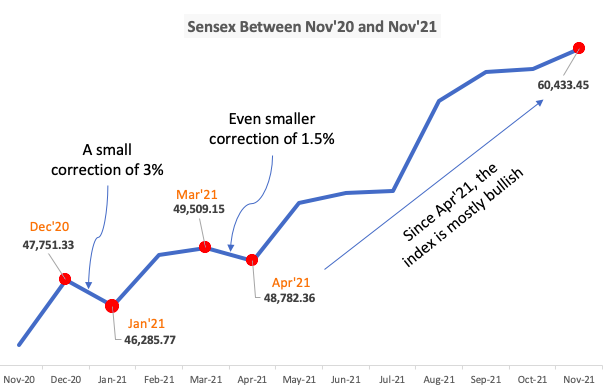
Following the logic we’ve just learned just now, the crash is preceded by multiple major-correction of at least 6%. Check the above chart between Nov’20 and Nov’21. During this time period, the Sensex has corrected itself only twice: Dec-Jan’21 (3%) and Mar-Apr’21 (1.5%).
After April-2021, the index is predominantly bullish. It is not crashing any time soon. But yes, at least a 6% correction is anticipated. When? Well have to wait for it.
2. PE Trend of Sensex
A more apt confirmation of the index’s valuation can be gauged by plotting its PE trend. Let’s understand the behavior of the index from these numbers. What is the idea behind this analysis? We will try to gauze the PE-peak and PE-bottom of the Sensex. At the PE-peak levels, the index is more likely to correct/crash.
Before The COVID Crash
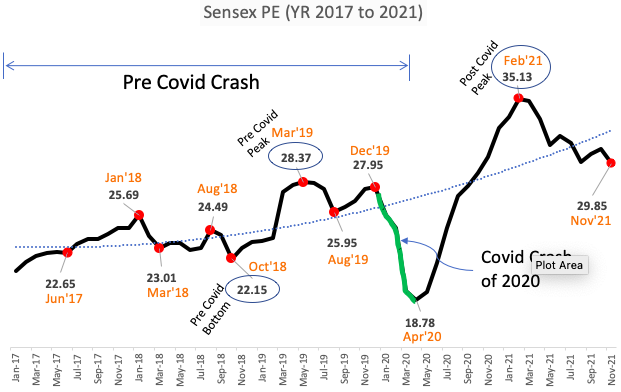
- #Cycle-1 (Jun’17, Jan’18, Mar’18): These dates represent the rise and fall of Sensex. In Jun’17 it was at the bottom (22.65). Henceforth it moved up and peaked on Jan’18 (25.69). Then it was followed by a correction. The PE fell to 23.01 (Mat’18). So, we can say that in those times, the peak of Sensex’ PE was 25.69.
- #Cycle-2 (Oct’18, Mar’19, Aug’19): On Oct’18 the Sensex was at was at the bottom (22.15). It moved up Mar’19 to reach 28.37 levels. This was a peak, followed by a correction, taking Sensex to 25.95 levels.
After the two major corrections highlighted above, the Sensex again rose to 27.95 levels (Dec’19). After that Covid happened and the index crashed. The crash took the Sensex to 18.78 levels. It was the rock-bottom of the period.
Now, compare the pre-covid PE-bottoms of Sensex (22,23, & 25) with 18.78 levels. The index looked undervalued, right? Hence it was followed by a massive upswing between Apr’20 and Feb’21. The Sensex PE peaked on Feb’21 with 35.13 levels.
Peculiar Behavior of Sensex PE
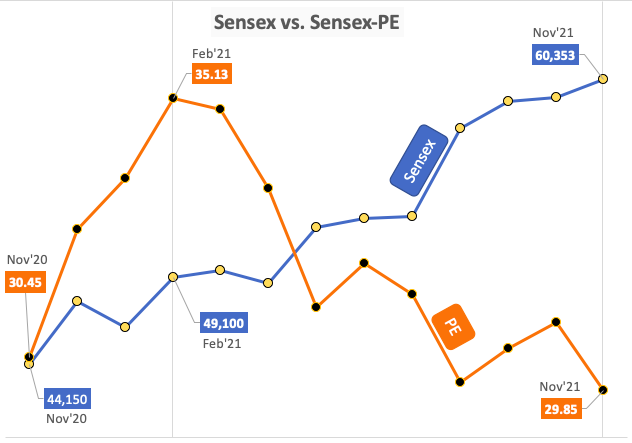
The Sensex PE was at its peak on Feb’21 at 35.13 levels. After that, the PE started falling (Fe’21 to Nov’21). Generally, PE falls as a result of a fall in the index. But in this case, the Sensex continued to rise, but its PE kept falling.
On Nov’21, Sensex is at its all-time high of 60,000+ levels following a rising trend. But the PE trend is falling. What does it mean, though the index is rising, its PE trend is showing that the index is getting more undervalued.
Hence, it is unlikely that the index will crash any time soon. With such a PE trend, even a correction is not possible.
Watching the PE trend is one of the strong signs confirming if the index is tending towards overvaluation or not.
The higher is the PE Ratio, the more overvalued is the stock market.
Check the Sensex PE levels observed on the following important milestone periods:
- 2001 (Before Dot Com Bubble): 23.89.
- 2008 (Before Debt Crisis of USA): 22.61
- 2011 (After the 2008 Crash): 21.60
- 2020 (Before Covid Crash): 27.95
As per these numbers, it looks like the present Sensex (PE 29.85) is overvalued. But if we see the PE trend, it is falling. In such a condition, a market crash is unlikely.
3. Government Bond Yield
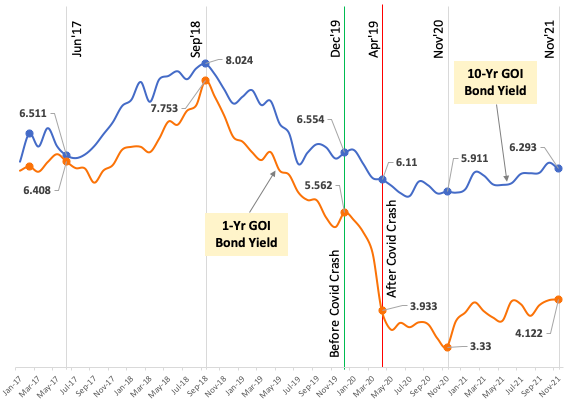
Two conditions happening in tandem make the stock market sensitive to a crash. The first condition is high-interest rates, and the second is the narrow gap between the interest rates of 1-Yr GOI bond and 10-Yr GOI bond.
To understand the logic, we must introduce ourselves to the world of inflation and interest rates. At the moment, we must know that changes in the interest rates will alter the bond yields.
Interest Rates, Inflation, and Demand Situation
Inflation is High
The RBI, India’s Central Bank, monitors, and controls inflation. How do they do it? By increasing or lowering the lending rates (interest rate). When inflation is high, RBI will increase the lending rates. It makes loans costly. As a result, the citizens borrow less money from banks. Less borrowing leads to less spending, hence inflation starts to fall.
Demand is Low
Similarly, when RBI wants to boost the demand, it lowers the lending rates. As loans become dearer, citizens take loans and then spend. This boosts the demand, helping the GDP, at the cost of inflation.
So, our takeaway from this discussion is the volatility of the interest rates. Depending upon the priority of the RBI, demand vs inflation, they will keep altering the interest rates.
Interest Rates Vs Investments
We have seen that why interest rates change. Now we will know how it affects the stock market.
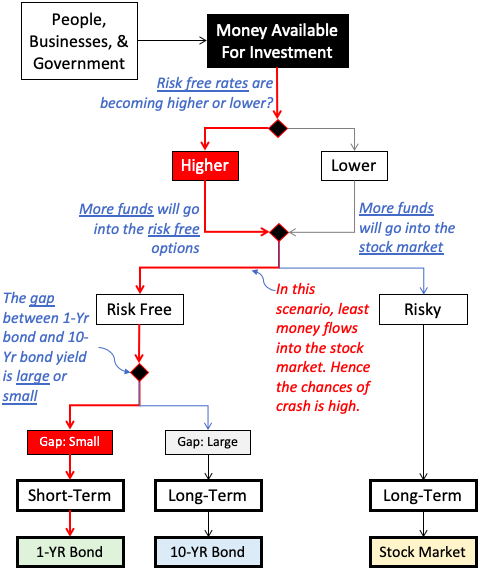
Three types of entities invest money in the stock market: people, businesses, and governments. For a better understanding, let’s keep the variables low. We’ll assume that there are only three investment options available in India. The 1-YR bond and 10-Yr bond, represent risk-free investment options. The third alternative is the stock market, which is risky. It is shown in the above flow chart.
People are inherently risk-averse, hence their natural preference is for risk-free options. When interests rates are on the rise, more people start to opt for bonds, deposits, etc. So, in a rising interest rate scenario, the preference for risk-free option increase further. Henceforth, less money flows into the stock market than before. So in this situation, the index begins to correct. It is not a crash.
Risk Free Options
There is always a big gap between the yields of a short-term bond and a long-term bond. The yield of a long-term bond is higher. But in a highly inflationary market, the yield gap of the two bonds starts to close.
A condition comes when the gap becomes insignificant for the investors. If short and long-term bonds start yielding similar returns, investors would prefer the former. The majority of money starts getting diverted from long-term bonds and the stock market into short-term bonds.
The low gap condition as explained above is a clear sign of a market crash about to happen any time soon. The market just needs a trigger. Check the below chart for an example of the 2008 crash. See the gap between 1-Yr and 10-Yr GOI bonds.
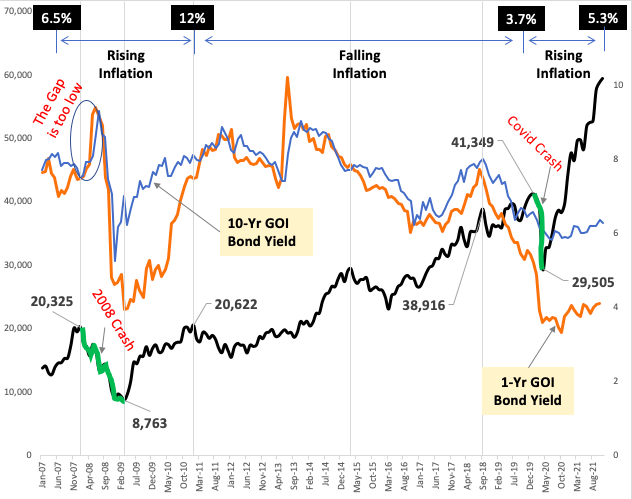
In the above chart, you can see how far apart are the yields of the two bonds today (Nov-2021). Seeing the gap, it is very unlikely that the market will crash at the current levels. Though a correction of 6% or more is possible.
4. Trend of A Broader Indices
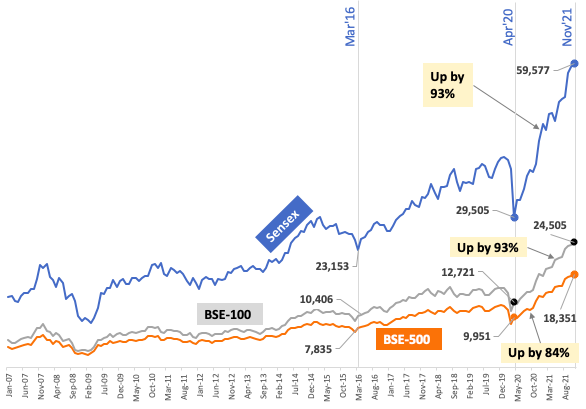
This is among the easier ways to look for the signs of a market crash. Compare the growth of a broader index like BSE-100 and BSE-500 Index with Sensex.
Sensex consists of only 30 stocks, but BSE-100 and BSE-500 have 100 and 500 stocks respectively. When Sensex growth is higher than that of BSE-100 and BSE-500, it is a sign of money accumulation in only a few stocks. Such behavior leads to overvaluation. This might lead to a market crash in times to come.
Between Apr’20 and Nov’21 (19 Months)
| Description | Sensex | BSE-100 | BSE-500 |
| Nov’21 | 59,577 | 24,505 | 18,351 |
| Apr’20 | 29,505 | 12,721 | 9,951 |
| Growth | 30,072 | 11,784 | 8,400 |
| Growth (%) | 102% | 93% | 84% |
In the period between Apr’20 and Nov’21, Sensex has shown an absolute growth of 102%. Compare it with the growth of BSE-100 (93%) and BSE-500 (84%). It is evident that Sensex looks overvalued.
- Between BSE-100 and Sensex: Growth difference is 9%.
- Between BSE-500 and Sensex: Growth difference is 18%.
Note: Even BSE-100 (93%) looks overvalued compared to BSE-500 (84%). It means that majority of investment funds are being invested in top 100 stocks. In the the below two examples, you’ll see that BSE-100 and BSE-500 index generally grows at the same pace.
Between Mar’16 and Nov’21 (5-Yr, 8-Months)
| Description | Sensex | BSE-100 | BSE-500 |
| Nov’21 | 59,577 | 24,505 | 18,351 |
| Mar’16 | 23,153 | 10,406 | 7,835 |
| Growth | 36,424 | 14,099 | 10,516 |
| Growth (%) | 157% | 135% | 134% |
In the period between Apr’20 and Mar’16, Sensex has shown an absolute growth of 157%. Compare it with the growth of BSE-100 (135%) and BSE-500 (134%). BSE-100 and BSE-500 have grown in almost equal percentage points. But Sensex’s growth is 22% higher than theirs.
Between Apr’07 and Jan’08 (9 Months)
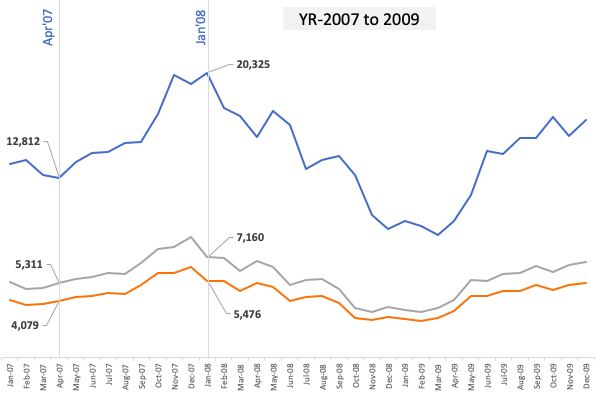
| Description | Sensex | BSE-100 | BSE-500 |
| Jan’08 | 20,325 | 7,160 | 5,476 |
| Apr’07 | 12,812 | 5,311 | 4,079 |
| Growth | 7,513 | 1,849 | 1,397 |
| Growth (%) | 59% | 35% | 34% |
In the period between Apr’07 and Jan’08, Sensex has shown an absolute growth of 59%. Compare it with the growth of BSE-100 (35%) and BSE-500 (34%). BSE-100 and BSE-500 have grown in almost equal percentage points. But Sensex’s growth is 24% higher than theirs. It is a sign of Sensex being overvalued. Hence, in 2008-09 we saw a massive crash.
Conclusion
The stock market always knows when it is trading at overvalued or undervalued levels. But it has its own coded transcript with which it communicates with its investors.
Investors who are able to read the coded transcript get an advantage. What is the advantage? It helps them to time the market more accurately.
Reading the market code is difficult? Not so much. We can estimate if the crash is due by looking at the four signs discussed above.
Have a happy investing.

The market almost increased 30% in the last year. It seems this is rare. Is it a sign that a crash is imminent?
This is kind of foam at the top of a cup of irrational exhuberance.
What do you think?
Just came across your blog today. Insightful and at the same time crisp. Hoping to use it more and look forward to interacting more. Thanks a lot! Great service!
Incidentally, based on the current position of the four signs, what is your view of the market now?
Your content is great sir. Thank you sir for sharing this article.
Excellent!! Very Informative and helpful blog thanks for sharing it. Really helps for users who want to start stock & share market.
Several measures have been put in place to prevent stock market crashes. Examples of these measures include circuit breakers and trading curbs to lessen the effect of an abrupt drop in prices.
Very Informative blog thanks for sharing with us it really helps who begin to understand stock & share market.
Very informative article Mani.
So your point is that we are heading towards a crash, right? I wish you are wrong 🙂
I think we need a correction from the current levels, but there seems no reason for a crash. What do you say?
You are right, market crash is not a welcome move. But it is also a necessary thing in the economic cycle.
As far as reason of crash is concerned, there are many. But they market has remained stubbornly bullish.
I have been going through your blogs recently. Very insightful. Keep going. My question – Which months may see the most correction or crash in 2019 if we need to start SIP or monthly stock buying? I know timing cannot be accurate but what are the probable months ?
good post sir seems crash has started will stay cautious thank you
If Nifty goes below 10000,will it take many years to again make a new high?
Generally the down cycle does not take more than a year to reverse.
How do current investors safeguard themselves from this impending crash. Lets say some one has already invested a substantial amount in direct equity or equity mutual funds and also has a long term horizon
Good question. It depends on the type of investor.