
Stock Price Prediction Tool
Use the above Stock Price Prediction Tool. It can help to forecast stock movements based on key financial indicators. Try answering a few questions related to P/E ratio, revenue trends, and institutional investor stakes, etc, and you can gain a rough insight into a stock’s potential performance.
Introduction
Ask common men, they will say that – a stock’s price goes down more than it goes up. 🙂 Why do we think like this? Because we don’t know how to predict if a stock will go up or down.
This is not only our problem, even experts of the stock market face a similar dilemma. Read: Why does stock price fluctuate?
In the short term, a span of 2-3 months, stock price movement is mostly speculative. If there are more buyers, the price goes up. If there are more sellers, the price falls.
What triggers buying or selling? Quarterly or annual reports published by the company. If the results are positive, the stock’s price will go up. If the results are negative, it might trigger a fall.
But in the real world, factors affecting share price are far more complex. It not only depends on the fundamentals of the company it represents but also on a host of other factors. It is a complex puzzle, and for common men like us, it is a hard nut to crack.
Topics
#1. Influence of FPI, FII & DII on Stock Price (Index)

Sorry for the jargon, but these are the types of investors who invest in the Indian Financial System. FPI: Foreign Portfolio Investors. FII: Foreign Institutional Investors. DII: Domestic Institutional Investors. Apart from the above three types of investors, other investors are classified as Retail Investors. “We” are the retail investors.
Stock market investments are dominated by three players, FPI, FII, and DII. If they are buying in the stock market, the index will move up. If they are selling, the index will fall. FPIs and FIIs pump in and pull out the most amount of money. Hence, their trading activity is most visible on the index. When FPI/FIIs are selling, the index falls, and vice versa.
Compared to FII/FPI/DII, the trading volume of individual retail investors is negligible. Hence, the index is little impacted by their activity.
Let me show you a graphical representation of how the Index moves when FPI/FIIs are investing.
FPI/FII Net Investment (buy vs sell trades) and Nifty50 Index
The Nifty-50 fell from 5137 points to 2,763 points between Jan’08 and Feb’09 because FIIs and DIIs were selling their holdings. Remember, this was the time of the market crash of 2008-09 due to the sub-prime mortgage crisis.
| Date | Net Purchase (Rs.Cr.) | Nifty 50 |
| Jan-08 | -13,032.82 | 5,137.45 |
| Feb-08 | -42.78 | 5,223.50 |
| Mar-08 | -816.29 | 4,734.50 |
| Apr-08 | 864.10 | 5,165.90 |
| May-08 | 1,582.44 | 4,870.10 |
| Jun-08 | -4,039.19 | 4,040.55 |
| Jul-08 | -3,076.81 | 4,332.95 |
| Aug-08 | -2,483.74 | 4,360.00 |
| Sep-08 | -3,289.78 | 3,921.20 |
| Oct-08 | -4,857.20 | 2,885.60 |
| Nov-08 | -2,584.81 | 2,755.10 |
| Dec-08 | 2,941.09 | 2,959.15 |
| Jan-09 | -1,454.68 | 2,874.80 |
| Feb-09 | -58.87 | 2,763.65 |
Net Purchase means the sum of gross purchase and gross sales of equity. When net purchase goes in negative, it means that the FIIs, FPIs and DIIs are in a selling mode. For example, see the numbers for Jan’08. The FIIs, FPIs and DIIs net selling was in the tune of Rs.13,032 Crore.
Let’s check the purchase/sale trend of FIIs, FPIs, and DIIs between Jan’08 and Feb’09 as a chart. A blue bars below the zero line indicates net selling. Between this period, the FIIs, FPIs, and DIIs have mainly been selling. Hence, the Nifty-50 fell from 5137 to 2763 points (market crashed by -46%).

The Nifty-50 index is almost imitating the buy-sell trend of FPI/FII’s.
Hence, tracking net investment of FPI/FII happening in NSE/BSE can help us predict if a stock will go up or down. From where to get the data FPI/FII/DII investments? It is published on NSE’s website on daily basis.
The majority money of FIIs and DIIs goes into large cap stocks. Stocks included in indices like Sensex, Nifty 50, Nifty Next 50, etc attracts most attention of these players. So, what we small investors can do is to track if FII’s. FPI’s and DIIs are selling or buying. If they are selling, we can buy constituent stocks of indices like Sensex, Nifty 50, Nifty Next 50, etc.
#2. Influence of Price Valuations on Stock’s Price
We cannot buy stocks based on FPI/FII/DII data alone. Why? Because we will eventually end up making losses. If we are luckly, we will make only mediocre gains. It is also important to analyze a company, check its business fundamentals and do price valuations, before buying its stocks.
We must always remember that stock is a speculative asset. What is a speculative asset? It an asset type whose market price has a tendency to become overpriced. When stocks become overpriced it has a tendency to go down. It is called a correction. For some stocks it happens immediately, for some it can take some time.
How to know if an asset is overpriced? Asset is said to be overpriced when its current price is higher than its “fair price‘. This is where the need of stock analysis comes into play. How a layman can do stock analysis? We’ve built a stock screener. It has two main data for its users.
Overall Score: An overall score of over 75% means that the stock is fundamentally strong. Intrinsic Value: When price of a stock is below its intrinsic value it means it is undervalued.
A combination of fundamental analysis and FPI/FII/DII data, can give a fair idea about a stock’s future price trend – whether it will go up or down.
2.1 About Fundamental Analysis
Why to do fundamental analysis? This way we can ‘estimate fair price‘ of stocks. Once fair price of a stock is known, it can be compared with its market price to understand if the stock is ‘overpriced‘ or not.
But there is a problem. The problem lies in estimating fair price of stock. What is the problem?
To estimate fair price of stocks, one must know how to read and comprehend ‘financial statements’ (like balance sheet, P&L a/c, & cash flow statement). How to read it? This is what we will see in this article
Idea is to “understand the correlation between the company’s financial results, it’s fundamentals, and it’s fair price (also called intrinsic value).”
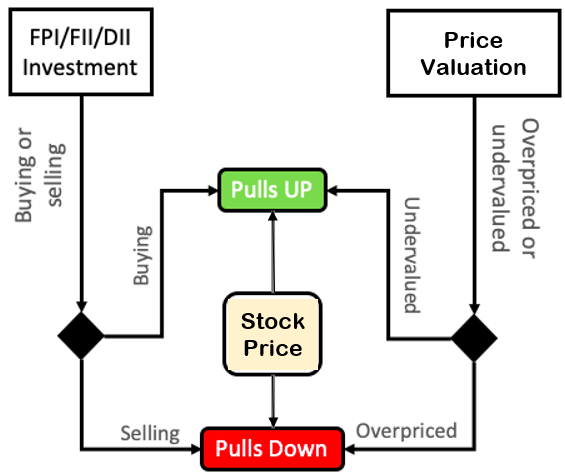
Knowledge of fair price gives an idea about how to predict if a stock will go up or down. Undervaluation will pull price up, overvaluation will bring the prices down (see this flow chart)
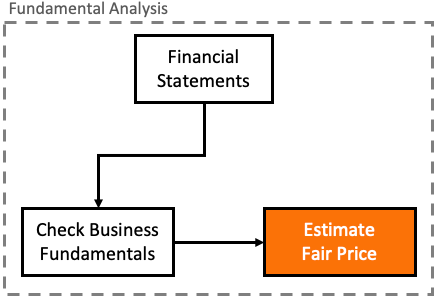
2.2 Correlation Between Financial Reports, Business Fundamentals & Fair Price
This is the crux of fundamental analysis of stocks. If we can learn to establish a correlation between financial statements, its business fundamentals, and its fair price – it all about it.
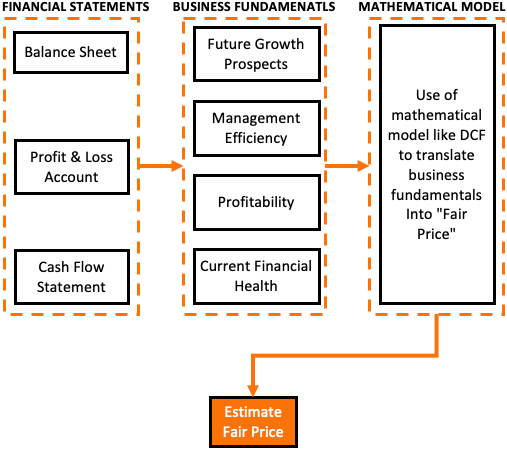
How this can be done? It can be done by the three step process shown in the above flow chart. The end goal of these three steps is to identify a fair price. Allow me to explain each of the three steps in only few words:
- Financial Statements: Learning how to read financial statements is key. When I say reading, I also mean understanding. One must not only read the financial reports, but after reading, should be able to frame a bigger picture about the company. Why bigger picture? Because it helps in comprehending its business fundamentals. Read more about reading a balance sheet.
- Business Fundamentals: What factors dictate business fundamentals of a company? Future growth prospects, management’s efficiency, profitability, current financial health etc. While reading a financial report, one must also simultaneously comprehend the fundamentals. Read more about fundamentally strong stocks.
- Mathematical Model: In the above two steps what we have done is mostly “study” of the company. In this step we will convert the our study into a hard fact number. In value investing this number is called fair price or intrinsic value. But how to convert the numbers into fair price? To do this one must also master a mathematical model (like discounted cash flow model).
Why we are doing so much work? We want to know if, from the current price levels, a stock will go up or down. The best indicator of this is stock’s fair price. When fair price of a stock is below its current price, the stock has good possibility to go up in times to come.
How soon it will go up? It depends on the degree of undervaluation. As a rule of thumb, a popular stock which is trading at a discount to its fair price (say at 2/3rd levels), can go up within next few months.
If one does not want to go into the complexity of fair price calculations, using mathematical models, then I’ll suggest an easier alternative in this article. I call it Future PE-EPS method (check here). Though it is a crude method of gauging stock’s future price trend, but it works for beginners.
2.3 Two Methods to Predict Stock Price
There are two ways one can predict stock price. One is by evaluation of the stock’s intrinsic value. Second is by trying to guess stock’s future PE and EPS.
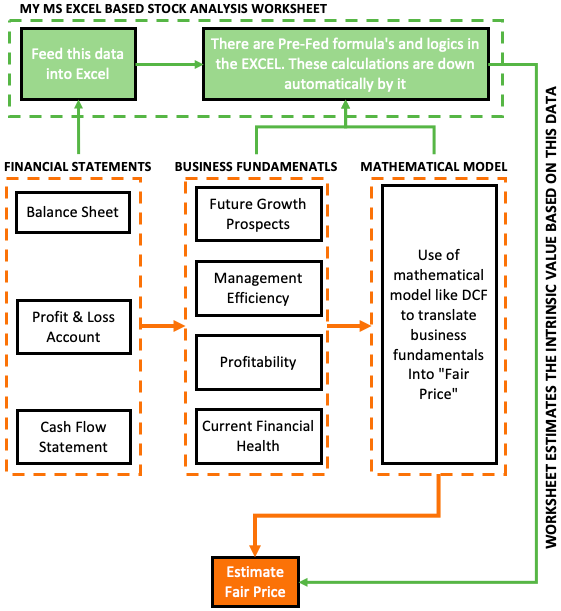
Method #1: Intrinsic value estimation of a stock is a skill. Only people like Warren Buffett, and Peter Lynch can say for sure that their estimated intrinsic value is accurate. Balance all of us can only make a random guess. I’ve developed an MS EXCEL based tool which can estimate intrinsic value of stocks. Check the below infographics to know how it works.
Method #2: This is a second method which a beginner can use to predict if a stock will go up or down. This is a crude way to guessing a stock price. But the logic’s that will be used to implement the process is sound. I’ve personally used it to guess price trends during my earlier days. I’ll share the procedure in detail for only academic knowledge of my readers.
2.4 Future PE-EPS Method
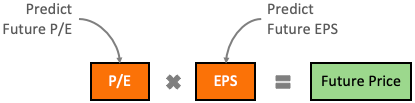
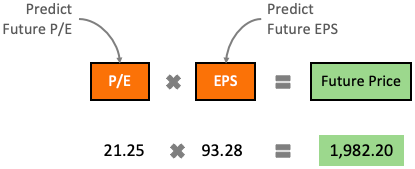
This method of predicting future price of a stock is based on a basic formula. The formula is shown above (P/E x EPS = Price).
According to this formula, if we can accurately predict a stock’s future P/E and EPS, we will know its accurate future price.
We use this formula day-in day-out to compute financial ratios of stocks. But instead of future price, we use it for current price. Here the P/E and EPS data that we use is based on trailing four quarters.
We will use the same formula and try to predict future price. How to do it? Please check the 3 step process shown below. We can also use this method to crudely quantify if the current stock is undervalued or not (check the conclusion).
But before that, let’s know how to predict future price of stocks.
Step #1
Estimate P/E of Future (P/E after 3 years from today)
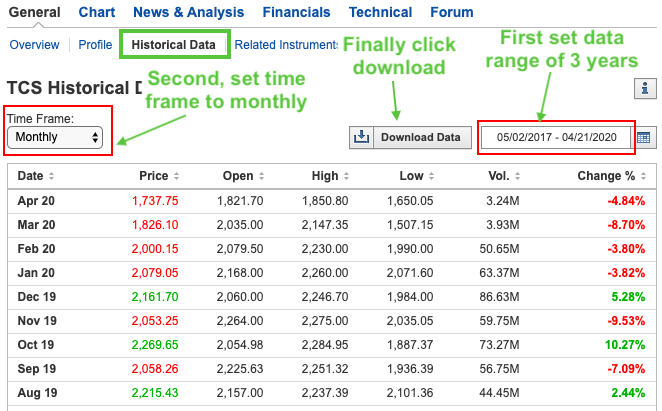
- #1A. Historical Price: First note down monthly price of stock posted in last 3 years. You can get the price history from investing dot com. This website allows you to download the historical price in csv format. You can follow this path: Go to your Stock Page > Historical Data > Time Frame (monthly). Download the last 3 years price (36 months) for your stock. Check this video guide where price downloading is shown.
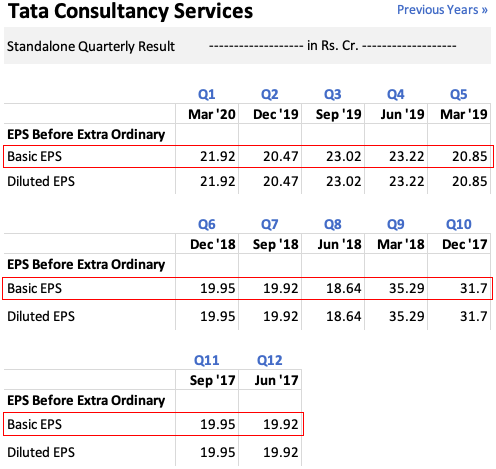
- #1B. Quarterly EPS (EPS Q): After price, we will need the stock’s historical EPS data. This data we can get from the stock’s page in moneycontrol. You can follow this path: Go to your Stock Page > Financial > Quarterly Results. Note down the quarterly EPS for last 3 years (12 quarters). Read about high EPS companies.
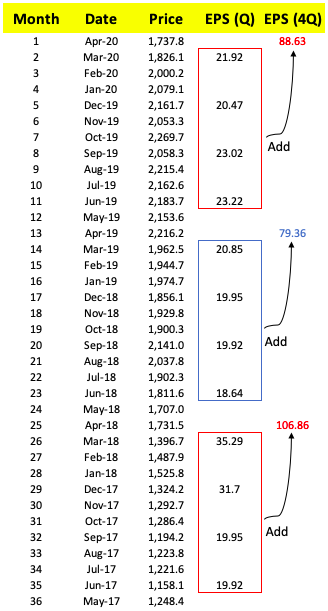
- #1C. Calculate Last 4 quarter EPS (EPS-4Q): Calculation of last 4 quarter EPS is easy. First prepare a table of all 12 quarter EPS you have collected from moneycontrol. To calculate last 4 quarter EPS, just add the EPS of last 4 quarters. Please see the below table prepared for an example stock.
- #1D Calculate Last 3Y P/E: From the above prepared table, P/E calculation of stock in each of the last 3 years is easy. PE can be calculated by dividing Price (P) by last 4 quarter EPS (EPS-4Q). The same is represented in the calculation table shown below:
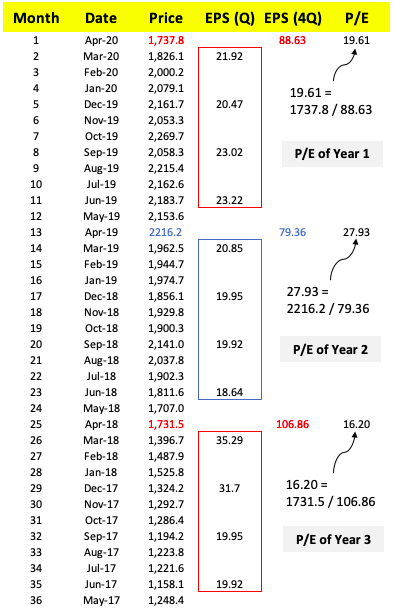
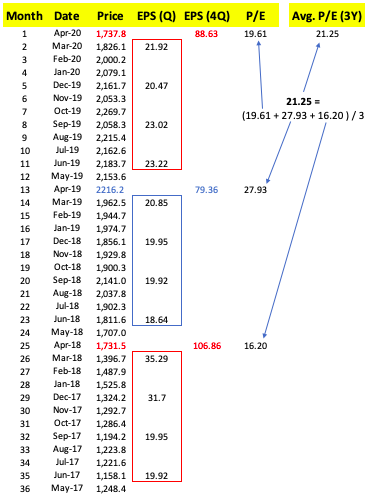
- #1E Estimate P/E of Future: Before estimation we will make an assumption that the stock is going to at least replicate in past 3 years performance (if not improve it). What we will do? We will calculate the Average P/E of last 3 years. Now we will assume that the stock will have this P/E after 3 years from today (calculated value is 21.25). Our assumption: After 3 years from today, the stock will have a PE of 21.25. Read more about P/E ratio.
Step #2
Estimate EPS of Future (EPS after 3 years from today)
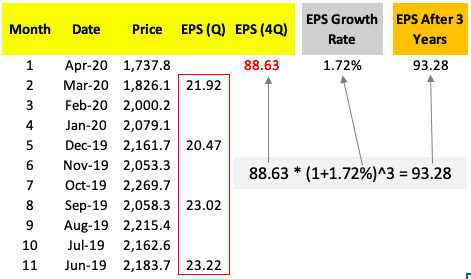
- #2A EPS Growth Rate: In this step we will estimate the growth rate at which the EPS of our stock will grow in next 3 years. How to do it? We will have to fetch some data from moneycontrol. After the data is fetched, we must calculate the growth rates of the fetch data. Based on this calculation will be estimate future growth rate of EPS. See the sample calculation shown below. Here the estimated EPS growth rate is 1.72% p.a.

- #2B Estimate EPS of Future: We have two numbers to this estimation. We know last 4 quarter EPS. We have also estimated the EPS growth rate for the next 3 years time horizon. We will use these two numbers to estimate EPS of the stock after 3 years from today. Check the formula used for future EPS calculation. Read about profitable stocks.
Step #3
Predict Future Price of Stock
We will use the PE-EPS formula to predict future price of stock. What we have done in step #1 and Step #2 above is estimation of Future P/E (21.25) and Future EPS (93.28). With two numbers in hand, we are now ready to apply them to our formula.
What can we conclude from the above numbers?
- What will be the future price? The expected future price (after 3 years) of our example stock is Rs.1,982.2 We have arrived at this by using the P/E formula (PE x EPS = Price).
- What is the current price? The current price of the stock is Rs.1,737.8 (see snapshots used in PE calculation above).
- At what rate will the price grow? The current price of stock is Rs.1,737.8. The expected future price is Rs.1,982.3 (after 3 years from today). It means the stock is expected to grow at a rate of 4.48% per annum. Use this formula for growth rate calculation: [(future price/current price)^(1/ years) – 1].
Conclusion
Access the price data, and financial report of your stock as suggested in the above article. You can use these numbers to predict what will be the future price of stock – after 3 years from today (Check the 3 steps).
One can also use these numbers to interpret if the current price of your stock is undervalued or overvalued. This understanding can also give a hint that at current price levels, the stock shall be purchased or not. How to make this decision? Read about companies with a high moat.
Suppose your expected ROI is 12% p.a. from a stock. Hence you did its price trend analysis as shown above. You discovered that the analyzed stock can yield a return of 4.48% p.a. in the next 3 years. As the stock’s yield is below your expectations, hence for you, this stock is overvalued.
Suggested Reading:


I have purchased 5 shares thru emargin.
Would like to know whether its good way of investment?
How long should I hold ? What should be roi?
Just remember that investing with margin involves risks, and it’s essential to understand the terms and fees.
Are you new to equity?
Hi,
For the record surely the reverse of your statement is true;
“We want to know if, from the current price levels, a stock will go up or down. The best indicator of this is stock’s fair price. When fair price of a stock is below its current price, the stock has good possibility to go up in times to come.”
Mani:
Is all the info needed to come up with a calculation of the future price of an index such as the NDX [Nasdaq 100) or the DJIA (Dow Jones Industrial Average) available?
All companies in the NDX are required to issue quarterly earnings reports. In addition to each companies quarterly earnings, one would need to know each companies quarterly price.
Have you or anyone else applied your method of forecasting future price using an index fund?
This would involve coming up with a modified market cap weighted EPS for all 100 of the tickers in the NDX, no small calculation!
It perhaps would be easier to use the DJIA, which is price weighted and only has 30 stocks.
Don
Step 2 – please help to get details calculation. Growth rate calculation based on balance sheet and profit & loss account..
This was a very good article of writing. Real nice a simple for a beginner or novice. Thankfully I graduated with a finance degree in 1984 and keep myself informed and up to date. This was informative. Thank you
Hi Mani.
I jave a question:
How you did calculate the weightage in step #2?
Dear Mani, I am a retired army person. I read your valuable article that how to predict future price of a STOCK for this calculation you use three years historical data of TCS (17 May 2017 to 20 April 2020)PE and EPS. As per calculation.
Current Price of TCS Share as on 20 Apr 2020 =1737.80
PE =21.25
EPS =93
Future Price of share in coming 3yrs PE*EPS (21.25*93) = 1982.20
But dear Sir this formula is not matched with present price of TCS there is big difference between future price and present price of TCS share. Present price of share is your future price. To day 26 Apr 2022 price of TCS share is 3546.30 closing rate.
his talking for an average calculation..so it is great current price is greater than you expected.
can someone please explain why it is overvalued at the end. Surely if its going up in value then its undervalued?
Hi
Could you please explain how to compute 10.52% in #2A EPS Growth Rate:
I am sasanka from sri Lanka.
Thanks
Sasanka
I have similar question. I also would like to know how this number is generated as well.
how we get 10.52% growth rate and weightage 20%.
please help reply if you see our questions, Mani.
Sir I need help I want to write article about stock market prediction using fuzzy what can I do sir
Really nice blog there for all the beginners in the market for investments. Ideas shared for analysis are the best.
Dear Mani thank you for ur valuable information … Pls guide for Step 2# what is the formula
It’s the CAGR formula
I am a 14 years old kid. After analyzing this article. do you think I can now go and be involve in stock? i’ve always wanted to be involve in stock market.
First try predicting the future stock price trends. If you successfully predict the trend 3-4 times you are good to dive in the world of stock market. I will recommend investing a small amount of money at the beginning.
No. Have a clear aim of your life. Proceed towards it by choosing appropriate carrier. Finish your study and then enter after securing your comfortable maintenance. This is as I feel
Pls suggest EPS & PE calculations for months forcasting
just a great article to know what could be the actual price of a stock in simple language and to remove noise created by news channels and so called analysts
Hi Mani,
Thanks very much for the information. This info is very useful to me.
Unfortunately, I lost at step #2A. Can you please share the formula for Growth rate per quarter (eg: 10.52%) and Weightage (eg:20%) per quarter for P&L, BS, and CF statement?
Thanks in advance.
How can we estimate the 3-year future PE? As per my knowledge, we cannot even consider the average of PE because it is recorded on a daily basis of price fluctuation.
You are right. No one can never predict future movements.
But idea is to make an educated guess. All valuation models are based on this theory.
What has been explained above is what I’ve used during my initial days of investing (and it worked for me reasonably well). At least I was not investing blindly.
Hi Mr.Mani,
Thanks for sharing knowledge and info with us.much appreciated.
I was simulating the above process for Ashok Leyland but results are not agreeable.could you let me know the reason for such anamoly.
Thanks & Regards,
Paul
I bought your worksheet. That’s splendid effort. Hope you would have spent quiet a time to build this. Superb.
Is there a way that we unlock few sheets to know what was behind for research purpose.
If yes, do you charge for it? How much? Can you please update me.
Thanks for your feedback.
Sorry but the worksheet should remain protected.
I have bought your Share Analysis spread sheet and have been studying it for the last 2 weeks. THANK YOU very much for building such a wonderful tool.
When I worked on 10 odd shares I find that current price of all the shares are 1.5 to 2.2 times their Intrinsic Value” This is despite a 30% fall in the market. By that logic none of the shares of Credible companies can be bought.
When I received your mail today I tried to build an excel spreadsheet to calculate the Projected Price after 3 years.
I tried to mirror your example of TCS. All the figures are matching except Current Asset and Total Assets. Please check
My analysis of TCS is dated. Your’s is based on recent data.
Just because prices has fallen by 30% don’t mean that the shares are trading below its intrinsic value. This is the utility of using the worksheet like this. It gives you a visibility (which is not evident otherwise)
Sir , at this time L&T stock r low p/e ratios and low valuation ?
Is it real time for investment this stocks as a biginers ….!
If I can hold for 2 years then what kind of results I expect…
Kindly explain….
You can do this analysis using the ideas shared in this article.
This is a great article… thanks for providing such a valuable and useful information….
Hi Your blog is amazing this is like online classes for stock investing.
1 query, should we take standalone data or consolidated data for analyzing the company/stock?
I prefer analysing the core business using standalone data. Thanks.
Hello, Will Mar’19 EPS not be for Jan ,Feb and Mar 19? But in your calculations you have taken Mar’19 EPS for Mar,April and May. Please explain?
Companies report EPS every quarter (like Dec, Mar, Jun, and Sep). So, if EPS is declared in Mar, the same EPS has been considered for the next two months (Apr and May).