
Compare Sharpe Ratio of Your Type of Mutual Fund
| Fund Type | Expected Return (%) | Standard Deviation (%) | Sharpe Ratio |
|---|
Introduction
Sharpe ratio is a measure of risk-adjusted returns generated by mutual funds. Looking at 'returns' through the filter of 'risk' is advisable for investors.
What we need as an investor? High returns but at low risks, right.? Sharpe ratio is a tool which helps us to identify such mutual funds - which generates high returns but takes lesser risks.
Hence, looking only at past-returns gives us only half the picture. We also need to see the risk-side of it. Start by asking yourself, how much 'risk' the invested amount was exposed-to while it stayed invested?
What we mean by risk? The risk which is inherent with equity due to its price volatility.
Need of Sharpe Ratio
How we generally pick mutual fund?
We check the historical returns and then make the judgement. High return yielding mutual fund becomes our pick, right? But what about the risk? We often completely ignore the risk part.
Ideally, a mutual fund which generates high returns, without exposing our money to high risks of loss, should be our choice. Let's understand this with examples.
- Return 3.5%: Suppose your target is to earn 3.5% p.a. returns in next 3 years. Which investment vehicle you'll select? You will not select an equity mutual fund. Why? Because this much return can be generated by our savings account itself. Why to take the risk. Savings account will yield an assured 3.5% returns. See, by thinking like this you are actually unknowingly computing the sharpe ratio (return generated per unit risk).
- Return 8.5%: Suppose your target is to generate 8.5% p.a. return in next 3 years. Which investment option you will select? Here again you will not go for equity. The said return can be generated through a debt based fund itself. What is the characteristic of a debt based fund? Their price volatility (risk of loss) is much lower than equity. Again, you are doing a subconscious calculation of Sharpe Ratio.
- Return 11%: Even when return requirement is 11% p.a we need not go all out for equity. In India, a hybrid fund (25% Debt + 75% Equity) can yield those returns. As equity percentage is less, the associated risk with hybrid funds is also less. See, again, how we are analysing the risk-return balance.
Suggested Reading: Check few facts about mutual fund return calculator.
When we use Sharpe Ratio we do a similar analysis like we did in the above three example. The only difference is, Sharpe Ratio has a formula, which can mathematically quantify the risk-return balance.
P.Note: The higher is ones return requirement, the stronger becomes the need to have a more precise sharpe ratio. Rough estimations may not work.
What is Sharpe Ratio?
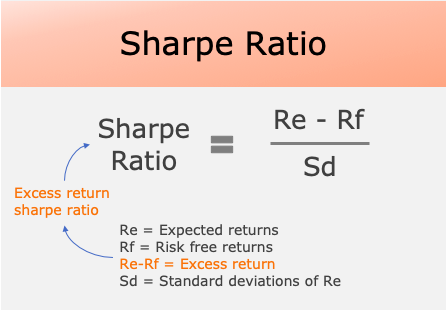
Sharpe Ratio = (Re – Rf) / Sd
It is a financial ratio which measures returns of a volatile asset (like stocks, mutual funds etc) relative to the risk taken to generate those returns.
The formula for sharpe ratio is shown above. From the formula we can see how it emulates the need of investors. When return goes up (Re-Rf), sharpe ratio goes up. Similarly, when risk/volatility goes down, sharpe ratio again goes up. [Note: We require is high returns at low risk.]
The higher is the Sharpe Ratio the better is the composition of investment portfolio. If one is comparing two mutual funds, yielding same returns, then the fund which has higher sharpe ratio will be a better choice.
Suggested Reading: About exchange traded funds (ETF's).
We will try to calculate Sharpe Ratio of a mutual fund to get a better clarity (here). But before that, lets understand the meaning of the following terms used in the formula:
- Standard Deviation (Sd): Suppose a mutual fund yield's an average return of 12% p.a. over last 10 years. The standard deviation of its returns in the same period was say 10%. It means, the returns of this mutual fund will fluctuate by 10% over and below the average return.
- Expected Return (Re): Suppose a mutual fund yielded returns of 15%, -7%, 13% & 5% respectively in last four months. The average return of this mutual fund will be 6.5%. Hence, we can assume that, the expected return of this mutual fund can be 6.5% in next four months.
- Risk Free Return (Rf): It is a return which we can generate without investing in a risky asset like equity. Example: By keeping our money in a fixed deposit, we can generate 7% returns with negligible risk. For sake of calculation, we will consider "yield of 10 years government bond" as our risk free rate (check here).
Thumb Rule & Numbers
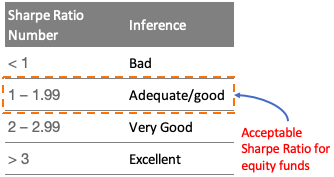
Till now what we know about sharpe ratio is that, the higher is this number the better. But how much does good mutual funds actually score in sharpe ratio? This is what we will see now. But before that, a rule of thumb:
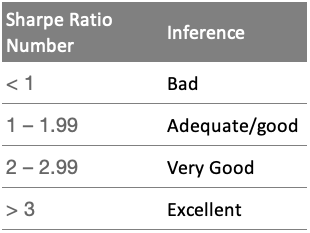
But for me this rule does not always work. Why? Let's read more to get an inside perspective of the above numbers.
- Debt Funds: I prepared a list of top 50 debt funds in India, in terms of their net asset size (Rs.Crore). Average Sharpe Ratio of all these 50 funds was 3.25, and standard deviation of 0.62%. Among these 50 funds, the best fund had sharpe ratio of 5.31, and the worst had 0.51.
- Hybrid Funds: From the list of top 30 hybrid funds, in terms of net asset size, their average sharpe ratio was 0.56 and standard deviation was 6.1%. Among these 30 funds, the best fund had sharpe ratio of 1.51, and the worst had 0.02.
- Equity Funds: From the list of top 50 equity funds, in terms of net asset size, their average sharpe ratio was 0.581 and standard deviation was 13.52%. Among these 50 funds, the best fund had sharpe ratio of 1.3, and the worst had 0.07.
So you can see, except for debt funds, all other funds are finding it hard to get a sharpe ratio number of more than 1.5. Does this mean that only debt funds are good, and rest is bad? No. Hence, I use Sharpe Ratio to compare between similar funds, like equity-equity, debt-debt.
[Note: Data of mutual fund taken as on end of Jan'20. Why old data (article was written on 29-Apr'20)? Because from Feb'20 onwards, the market started to slip, after sensing the COVID-19 crisis. Till end Jan'20, the market was behaving normally]
Sharpe Ratio Formula & Portfolio Composition
This will be an interesting study which will further clear our understanding about Sharpe Ratio.
We will try to correlate how portfolio composition of a mutual fund impacts the various constituents of the Sharpe Ratio formula. This way we will be able to visualise why Sharpe Ratio of one type of mutual fund is different from others.
Equity Mutual Fund
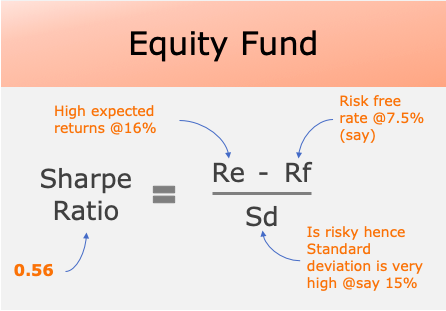
Equity mutual fund is risky, why? Because its NAV remains very volatile. Hence, the chances of returns going negative is also high. What is the effect of this "risky characteristic" of equity? It has following effects:
- High Expected Returns: As equity is risky, hence people who are investing in equity expects high returns (Re). Why? Because if equity will not promise higher returns, why people will leave safer debt or hybrid funds to invest in equity. High expected returns also means investors expects Sharpe Ratio to be high.
- High Standard Deviation: People who invest in equity mutual funds know that its price is very volatile. In other words, they also expect its standard deviation to be higher than other type of mutual funds. High standard deviation (Sd) also means that, investors expect a lower sharpe ratio for equity funds.
So you can see, high expected returns and high standard deviation has opposite effect on Sharpe Ratio of equity fund. It means, we as an investors, should be satisfied with only moderate Sharpe Ratio for equity funds. Using our rule of thumb, a moderate ratio for equity fund will be close to 2.
Debt Mutual Fund
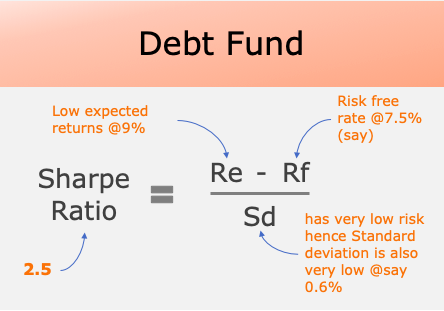
Debt based mutual funds has a stable NAV. They are not as volatile as equity funds. Moreover, in long term, the trajectory of NAV is also consistently upwards. This is what makes debt funds almost risk free. What is the effect of this "risk-free characteristic" of debt funds? It has following effects:
- Low Expected Returns: Investors do not demand high returns from debt funds. They have agreed for this bargain - "they tone down their expected returns for low price volatility". Hence, low expected return also translates into lower sharpe ratio.
- Low Standard Deviation: As NAV of debt funds are very stable, hence its standard deviation is also "very" low. Considering a "very" low factor in the denominator of the formula, makes the sharpe ratio of debt based funds too high.
Hence a good debt funds is always characterised by very high Sharpe Ratio. But this does not mean that debt funds are generating higher returns that equity. It is more symbolic of very low price volatility (standard deviation).
Using our rule of thumb, a high sharpe ratio for debt fund will be in the range of 2.5 or above. .

Calculation of Sharpe Ratio
Here we will take real life example of a mutual fund and try to calculate its sharpe ratios. Generally sharpe ratio of mutual funds are freely available on internet. But self calculation of this ratio can give more clarity about the effectiveness of this ratio in mutual fund selection.
Example: Axis Blue Chip Fund
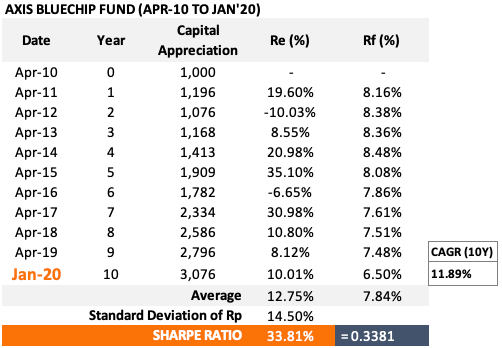
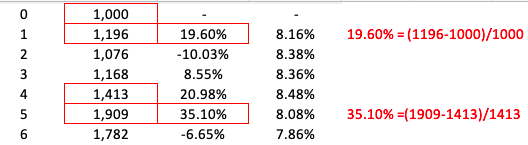
To calculate sharpe ratio of any mutual fund, you will first need to prepare a table as shown above. Let me help you to understand the various constituents of the table.
- Date & Year: Prepare a column for dates and year. Start date will represent the date on which the investor bought the units of the mutual fund. In our example, the units were bought in April'10. The investor bought the units and remain invested till Jan'20 (10 years). Adjacent the date column, is the year column. The number indicated in this column represent the cumulative holding time as on date.
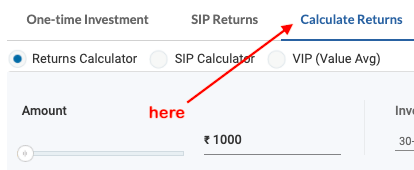
- Capital Appreciation: To prepare this column you will need to visit the mutual fund's page of moneycontrol. In that page, look for a 'calculator' which will help you to calculate the return on lump-sum investment. In my table I've shown, how the invested value of Rs.1,000 grows/declines over its invested time horizon of 10 years.
- Re (%) - Expected Returns: The number in this column is calculated from the values in "Capital Appreciation" column. The formula for the expected return is shown below:
- Rf (%) - Risk Free Rate: You can consider the interest rate offered by SBI's fixed deposit as risk free rate. But I've considered an even more conservative number - 'Yield of 10 year government bond'. You can get the historical yield of 10y government bonds from this link.
Once the columns are ready, calculate Re (Average). This can be calculated using this formula in excel = AVERAGE (D4:D13). You'll also need to calculate Rf (Average) using this formula = AVERAGE (E4:E13) - check the below screenshot.
Once average values of Re and Rf is calculated, now calculate Sd (Standard Deviation of Rp). This can be done using this formula in excel = =STDEV(D4:D13).
Now we are ready to calculate the Sharpe Ratio as shown in the below screenshot.

Conclusion
Let's conclude the concept of Sharpe Ratio with use of a simple example. Suppose there is a mutual fund X and Y. An investor wants to invest in these funds. His expected return (net of inflation) is 8%.
- Fund X: yields an excess return of 8%, and has a standard deviation of 10%.
- Fund Y: yields an excess return of 9%, and has a standard deviation of 12%.
According to our formula, the Sharpe Ratio of the two funds will be like this, X (8/10, or 0.8), and that of Y (9/12, or 0.75).
According to this ratio, fund X looks like a better fund than Y. But had the investor considered only the returns, Y looked more lucrative.
Let's see a similar example from a different perspective.
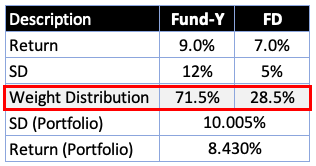
Suppose there is an investor who wants to invest in a mutual fund which is not so risky. His acceptable standard deviation is 10%. This investor has two ways to invest his money.
- He can either invest fully in Fund X and earn a return of 8%.
- Alternatively he can invest 71.5% in Fund-Y, and balance (28.5%) in a fixed deposit. This way the return of his portfolio will be 8.43%, and standard deviation is also within 10%.
The latter option is certainly a better alternative. Not only it is able to limit the standard deviation to 10% but is also yielding better returns (8.43% vs 8%).
Sharpe Ratio of Top Funds
| Fund Name | Type | Exp. Return (%) | Risk-Free (%) | Std. Dev. (%) | Sharpe Ratio |
|---|
Suggested Reading:


Hi Mani,
I am regular visitor to your blogs and they are informative. I make sure that I learn 1 topic every week. Thanks a lot for putting it together.
I am really interested to know more about mutual funds, when to sell, how much to sell, when to reenter. What are the indicators to take mentioned actions?
And how can I leave large chuck of wealth to next generation using mutual funds, especially Index and blue chip funds.
Please advise.
Thanks,
Seema