
Why I got interested in the concept of Net Asset Value (NAV)? Because it helped me to see my portfolio-building from the eyes of a mutual fund manager.
Generally, I build my savings under several heads (like saving#1, saving#2 etc). Overtime, savings keeps accumulating under each head. When it becomes sufficiently large, I use a part of it and lock them in investments.
So the money that flows into my investment portfolio, is in a staggered way. If the first instalment comes in January, then the next may come in March and so on.
But such staggered in-flow of money into my portfolio gave rise to a unique problem. The problem was, “how to assign the gains/losses to the new influx of money“. I’ll explain it more later. Before that let me tell you how NAV caught my attention.
The Concept of NAV catching my attention…

The problem I was facing led me towards mutual funds. I wanted to know how and why mutual fund schemes use the Net Asset value (NAV) to allot units to investors.
As represented in the above infographics, mutual fund schemes receive funds from investors at different times (shown as savings #1, #2 etc). As mutual fund’s performance is dynamic, it keeps changing with time. There will be some investors who will enter the fund when performance is bearish. Some will enter when bull is strong. How mutual funds takes care of this factor?
When I was thinking over this, I also began to realised the utility of NAV. It not only works as a live price (indicator), but it also justifies ones early and late entry-points into a scheme.
Since then I’ve used the concept of Net Asset Value (NAV) to allot units to myself – to handle my personal portfolio. I try to build my portfolio like a fund manager does for his/her scheme.
It is quite a fun. Moreover, it completely solved my problem of gain/loss assigning (solution is here). But first, let’s learn about my problem.
The Problem
I’ll explain it using a hypothetical example.
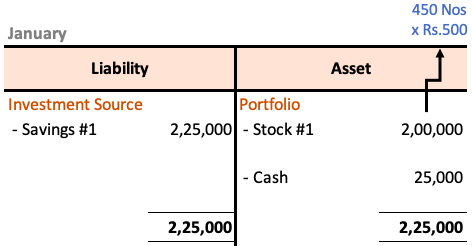
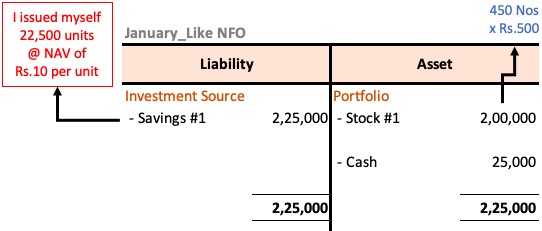
Suppose, there was Rs.2,25,000 available for investment under one savings head. This money was used to buy few stocks in the month of January. A symbolic representation of this investment is shown below in a Balance Sheet format.
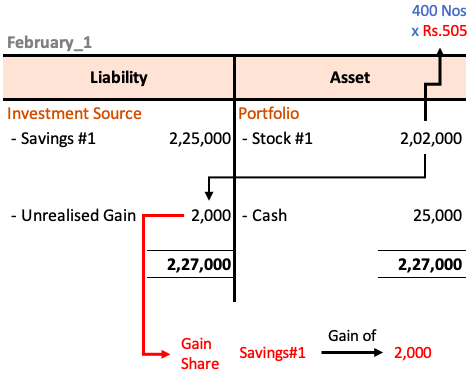
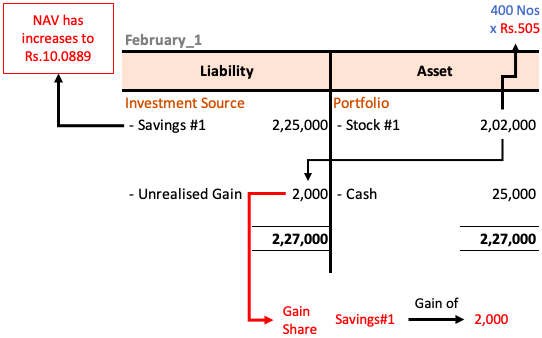
Now suppose by end of February, the stock price grew from Rs.500 to Rs505. It means the value of stock #1 becomes Rs.2,02,000. This is a gain of Rs.2,000 from January. Let’s see how this February development is recorded in the balance sheet.
Suppose on the last day of February another lot of Rs.50,000 (savings #2) was also available for investment. Let’s see how this new fund will impact the gains of the existing investment (savings #1).
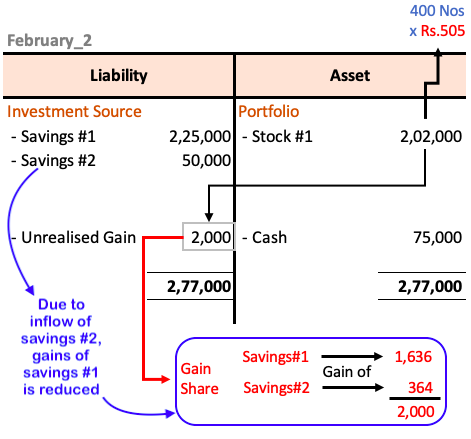
Here is the problem. Due to inflow of new funds into my portfolio, the gains of existing savings#1 got reduced. Why? Because the unrealised gain which was shown as Rs.2,000 is now proportionately shared by Savings#1 and Savings#2. But actually, savings#2 is not eligible to claim gains in February.
Why Savings #2 is not eligible for proportional gain? Because it has come-in right on the last day of February. All the gains of Rs.2,000 is attributable only to savings#1.
Similarly, had my portfolio showing negative gains of say -Rs.2,000, it would have been unfair for the savings#2 to share the weight of the already accrued losses.
This was the problem that I had to solve, and it got resolved by using the concept of Net Asset Value (NAV) used by mutual fund schemes.
So let’s get some basics first about NAV, then we will see the solution.
What is Net Asset Value (NAV)?
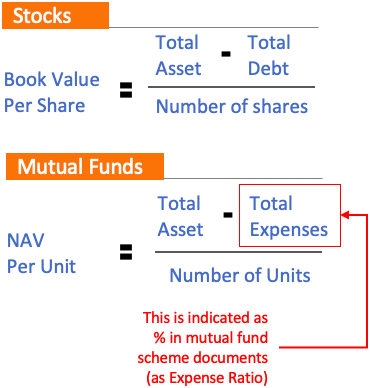
Generally speaking, what is “Book Value” for a stock, NAV is for mutual fund schemes. Though they are not identical but they have a lot of similarity.
In case of book value calculation, we subtract the total debt from total asset. In case of NAV calculation, we use committed/foreseen total expenses (instead of total debt) by the scheme in that financial year.
What we see as NAV in our mutual fund tickers is actually ‘NAV per unit‘.
Let’s see the individual terms indicated in the above NAV formula:
- Total Asset: It is basically the sum of market value of all securities included in the portfolio. The securities can be stocks, bonds, cash etc. For securities like stocks, current market value is considered for valuation. It means, when stock price will go up, the NAV of the mutual fund scheme will also go up and vice versa.
- Total Expenses: Mutual fund basically works as a money aggregators. They pool-in money from people, and then invest them in lump-sum to buy securities. This is a service that they provide for their subscribers. In turn, they charge a fee. The charges on the fee include, fund management charges, operation costs, distribution expenses, marketing expenses etc.*
- Number of Units: Like listed company’s have shares, mutual fund schemes have units. Each unit represents the total asset of the scheme divided into infinitesimal small parts. When we buy a unit, we are actually buying a small portion of the mutual funds asset. Each unit of a scheme is priced at its NAV.
[* P.Note: Generally, mutual fund companies books the expenses on daily basis. It is not as if the total annual expense is booked to the assets on the first day itself. I had to explain this as it took me some time to fetch this know-how from internet 🙂 ]
To solve my problem, what I needed was few units and NAV of my personal portfolio. This will eliminate my problem. But before seeing how NAV & Units solved the problem, let’s know one more thing about NAV’s. Knowing this will eventually help in seeing the solution from a much clearer perspective.
How NAV of NFO (New Fund Offer) is decided?
When a mutual fund scheme is at an NFO stage, its NAV is mandatorily fixed at Rs.10 per unit. At this stage, the fund house takes the job of marketing and distributing the new scheme (NFO) to the public. Depending on the fundamentals of the scheme, its uniqueness, fund house’s brand name, fund managers credentials, marketing, timing of launch etc, people start to pool-in their money.
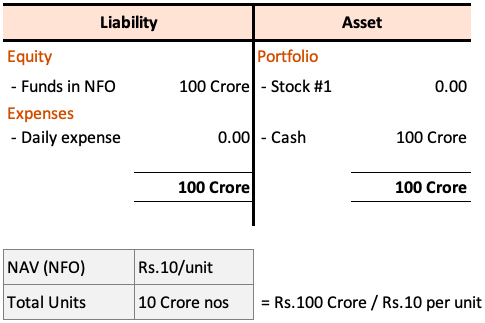
Suppose the total money collected by the scheme at the NFO stage was say Rs.100 crore. As NAV is fixed at Rs.10/share, it means, total number of units to be created is 10 crore nos (=100/10).
Once the units are created, it needs to be allotted to each investor in proportion to their invested amount. Suppose a person invested Rs.2,500 in the NFO. In this case he will get 250 nos units (=2500/10) at NAV of Rs.10.
Now from this point forward the NAV of the scheme will start to grow. But to make the NAV grow, the money needs to be invested properly in stocks, bonds etc. At the NFO stage, the mutual fund’s balance sheet will look like this:
When the collected funds is invested, say in stocks, the NAV will begin to grow in value. As the stock’s price grows, it will also take the NAV up with itself. If stock price will grow by say 1%, NAV will also go up by 1%.
How NAV of Mutual Fund Changes with Time?
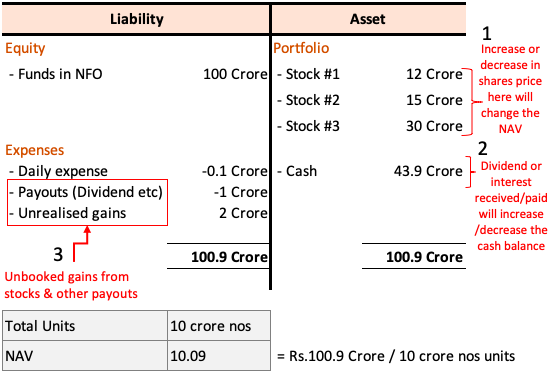
The constituents of the investment portfolio of the mutual fund scheme brings about changes in NAV over time. Let’s see some common factors which effects the NAV of mutual funds:
- Price of underlying assets: For an equity based fund, assets can be stocks, and cash. For debt based funds, assets can be bonds, cash etc. Price of both stocks and bonds are volatile. As the price of stocks will change, it will also change the NAV of it’s carrier mutual fund. This is one reason why NAV of mutual fund are declared after the stock market’s trading hours.
- Dividend/Interest Receipts: Equity funds can received dividends from its holding stocks. Debt funds can received interests from its holding bonds or deposits. In both the case, it increases the size of asset. As asset size grows, NAV also goes up.
- Dividend Payment: There are mutual funds which reward it’s investors by the way of dividend payments. When such mutual funds pays out dividend, the cash balance on the asset side decreases. This eventually lowers the NAV.
The Solution
I’m sure, people who were not so interested to know about what is NAV and how it is calculated, I have probably bored them with the details (above). But I thought this article will be incomplete without narrating these two details by jumping straight to the solution.
Anyways, now we are here, and I’ll talk about the solution. What solution I was seeking? How to logically assign the gain and losses to the invested funds in my investment portfolio? This is symbolic of how to assign gains/losses to different investors buying mutual funds at different point in time. If you have already not read about my problem, please check it here.
I’ll again explain my solution using the same hypothetical example (as done above).
January – This is the start point of portfolio building. Rs.2,25,000 available for investment under one savings head. Before this amount gets invested and is used to buy stocks etc, I issue myself few units at a NAV of Rs.10 per share. Consider it like a NFO of a mutual fund. A symbolic representation of this is shown below.
February (1) – The stock price in the portfolio rose from Rs.500 to Rs.505 level. This increased the NAV from Rs.10 to Rs.10.0889 per share. At this increased price levels, the value of my investment was at Rs.2,02,000 levels.
February (2) – Right at the point where the NAV was Rs.10.0889, I decided to infuse Rs.50,000 more into my portfolio. In the process of doing this, I had to buy units of my portfolio at the current NAV of Rs.10.0889 per unit. This way I was able to purchase 4,955.4 nos units with Rs.50,000.
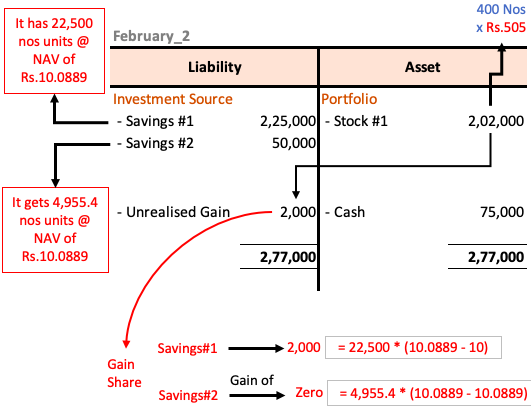
So you can see in the above infographic that, though Savings#2 has been included in the portfolio, but it is still not consuming on the gains generated by Savings#1. All this was possible because of the use of NAV/Units theory as followed by the mutual fund schemes.
Use of NAV was the ultimate solution to my problem.
Quick Look
- Net Asset Value is calculated by summing current value of all assets minus the accumulated daily expenses of the mutual fund scheme.
- In case of my personal portfolio, I also book my confirmed losses as expenses. The loss so booked is also adjusted in asset side of balance sheet by reducing the cash balance accordingly.
- NAV is just a number. On its own it does not reflect the performance of a portfolio. But a historical NAV data can precisely highlight the performance of mutual fund. NAV of a mutual fund growing from Rs.10 to Rs.12 in a year, highlights a growth rate of 20% per annum.


Great article and thought process Mani ! By any chance could you share any sample excel which you may have created to track the pf from NAV point of view.