
If you like to estimate intrinsic value of a stock, then start with Net Current Asset Value Per Share (NCAVPS). Why? Because it is the easiest to calculate and is most reliable of all. Yes, for me it is even more reliable than DCF method.
But the big problem with NCAVPS method is that, its estimates are so low that, it is like impossible to find good stocks trading at NCAVPS levels. So why to use it? Because it gives us a feel about the stock’s intrinsic value.
Though intrinsic value should always be ONE number. But this is true for magic investors like Warren Buffett. For common men like us, intrinsic value is a range. It has a lower limit and an upper limit.
We would like to buy stocks which falls in between this range, and this is where NCAVPS comes in. It helps us to calculate the intrinsic value’s lower limit.
Who made the concept of NCAVPS popular? Benjamin Graham…
The Concept: Net Current Asset Value
The concept of Net Current Asset Value Per Share (NCAVPS) was coined by Benjamin Graham. Here are the words of Benjamin Graham related to “Net Current Asset Value” picked from his book The Intelligent Investor Chapter 7, Page 169.
“….the type of bargain issue that can be most readily identified is a common stock that sells for less than the company’s net working capital alone, after deducting all prior obligations. This would mean that the buyer would pay nothing at all for the fixed assets— buildings, machinery, etc., or any good-will items that might exist. Very few companies turn out to have an ultimate value less than the working capital alone…”
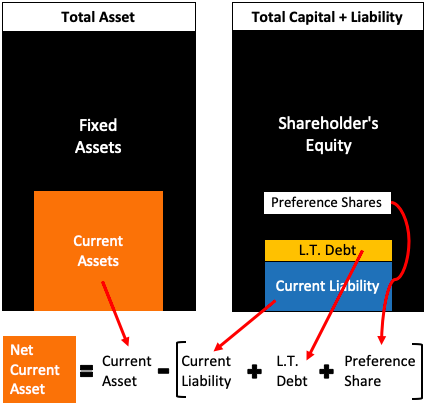
“Net Working Capital” for Benjamin Graham is what is “Net Current Assets” for us. In terms of formula Graham’s Net Working Capital looks like this:
Net Working Capital = Current Assets – (current liability + long term debt + preference shares)
Now we understand what Benjamin Graham means by Net Working Capital (Net Current Asset). Let’s also know what he means by “..bargain issue….that sells for less than the company’s net working capital“. In layman terms, this statement of Ben Graham can be represented as below:

When a stock is trading at a price so low that its total market capitalisation is less than its net current asset, in this case we can say that the stock is grossly undervalued.
A stock which is trading at such price levels, it is as if it is available almost free of cost. It is very likely that the market price of such a stock will increase dramatically in future.
…why we say grossly undervalued?
Generally speaking, any company is made up of its assets. These assets can be fixed assets like land, building, machinery, capital work-in progress, patents, furnitures, automobiles, etc. The assets can also be relatively liquid called current assets like cash, short term investments, receivables, inventories etc.
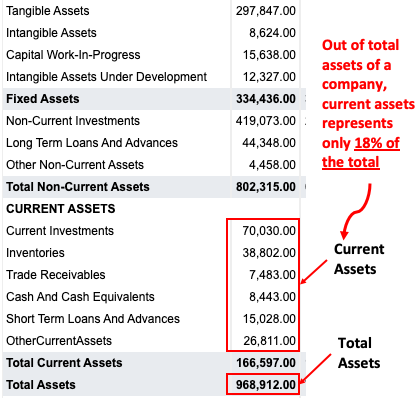
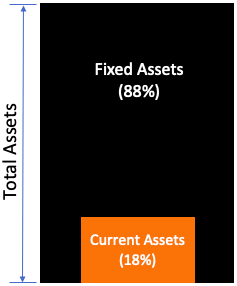
In the above example (RIL) you can note that the proportion between fixed assets and current assets is 82% vs 18% respectively. Just keep this in mind that, for a typical manufacturing company, ratio between current assets and total assets is like 1:5.
Now, what Benjamin graham says is to reduce the weight of current assets further. How? By adjusting it for current liabilities, long term debt and preferential shares if any. After this what’s left on current asset is called “Net Current Asset” to him. Let’s see how this looks in our ‘total asset’ vs ‘current asset’ graphics:
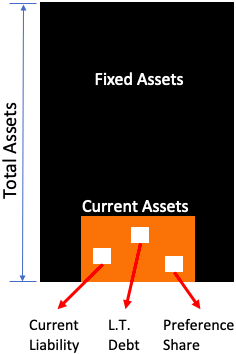
Why grossly undervalued? This is because when an investor pays only for net current assets, he/she is not paying for the fixed assets. The investor is able to buy the whole company at the rate of net current asset. This is a phenomenal price.
Imagine it like this: you are able to buy a prime residential property by paying only for the master bed-room. This will be a great buy, right?
I hope you have understood the concept of net current asset valuation of stocks, and why it is so hard to find good stocks trading at such price levels. Now let’s learn how to calculate NCA from financial reports.
Calculation: Net Current Asset (NCA)
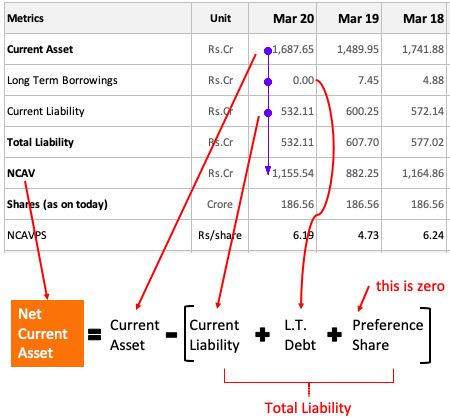
What you see here is a snapshot of NCAVPS sheet of my stock analysis worksheet. Seeing this you can easily visualize how Net Current Asset Value (NCAV) is computed from several numbers in the balance sheet.
- Current Asset: First step is to fetch the current asset numbers. This value is available in the company’s balance sheet. In our example stock, current asset for Mar’20 is showing as Rs.1,687 crore.
- Current Liability: Second step is to get current liability data from company’s balance sheet. Current liability along with other debts and obligations will form total liability.
- Long Term Borrowings: All loans whose tenure is longer than 12 months falls under this category. Short term loans are part of current liability. This value is also available in balance sheet. In our example stock, for Mar’20, this value is zero.
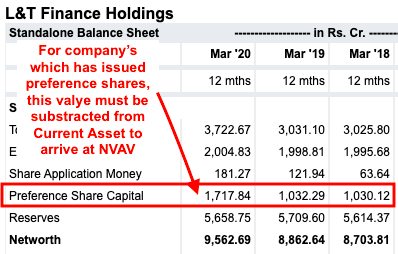
- Preference Shares: Not many company’s issue these shares. According to me, 90% companies issue only common shares. But for company’s which has issued preference shares, this value must be subtracted from current assets to arrive at NCAV. This value is also available in balance sheet.
Once you have all these numbers, use the formula shown in the above graphics to calculate ‘Net Current Asset’.
Intrinsic Value: Net Current Asset Value Per Share
What we have seen till now is the calculation method of ‘net current asset value’. But how to convert this value into intrinsic value? How to know if a stock is undervalued or overvalued?
Calculation of Net Current Asset Value is like 99% job done. What’s remaining is only mere aesthetics worth. This will eventually help us to draw a conclusion. Let’s see what we have to do more:
There are two ways of approaching the case:
- Market Cap Method: Net Current Asset Value (NCAV) computed as shown above is actually the intrinsic value of the company. Compare the NCAV with the total market cap of the company. If the market cap is less than NCAV, then we can say that the company is extremely undervalued (read the limitations).
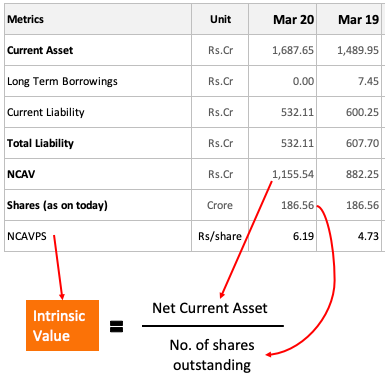
- Market Price Method: Pick the ‘number of shares outstanding’ from the company’s financial reports. Divided the calculated NCAV with the ‘number of shares outstanding’. The value you get is called Net Current Asset Value Per Share (NCAVPS). This is the intrinsic value. Compare it with current price of the company to know if stock is undervalued or overvalued.
What it means when we buy a stock at NCAVPS value?
This is another explanation of why a stock trading at NCAVPS levels is said to be grossly undervalued.
Suppose you bought a company’s stocks which was trading at a price equivalent to its NCAVPS levels. Due to some reasons, after few months from the purchase date, the company decided to wind-up its operations. What will happen to the shareholders?
When a listed company winds up its operations what it will do is to start liquidating all its assets. Upon liquidation, whatever funds is collected will be used to pay-off all the liabilities/payables. The balance amount which is left after paying all liabilities, will be distributed proportionally among the shareholders.
Let’s understand this concept using our graphics.
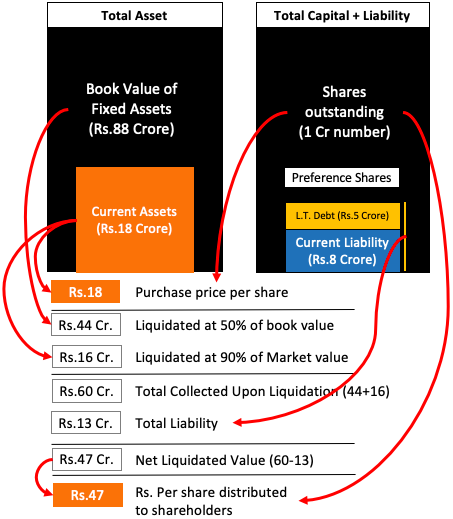
You can see, purchase price was Rs.18 per share. After liquidation, amount received by the shareholders is Rs 47 per share. There is a gain even though the company got liquidated.
You must also note that, during liquidation following two thigs are also happening:
- Fixed Assets: These are sold at a throw away price of almost 50% of the book value.
- Current Assets: These are liquidated at 90% of the market value.
This is what is called distressed selling. Even though the assets are sold at such price levels, still the shareholder is not at loss. Their gain is Rs.29 per share (Rs.17 to Rs.47).
What made this possible? It was possible because the shareholder bought the share at market price equivalent to NCAVPS.
What is shown above is an extreme case of company shutting down its operations. In normal circumstances, stocks of a good company, trading at NCAVPS levels, will record steep price appreciation soon in future.
Limitation of Intrinsic Value? How to deal with it?
If NCAVPS is such a strong indicator of undervaluation, why it is not such a popular metric among shareholders? There are two reasons for it:
- Rare to Locate: Yes, it is almost like impossible to locate a good company trading at such low price levels (below NCAVPS). Hence it is not so popular.
- Earning Quality: It is not enough to compare only NCAVPS with market price. It is also necessary to look at earnings. A company which has been reporting losses for last 5 years, may trade at NCAVPS levels. But shall be buy such stocks? Not at all.
So, in order to prevent one self from buying a dead-beat stock, better is to have another financial metric in our pocket for double checking. This metric is called Return on Asset (ROA).
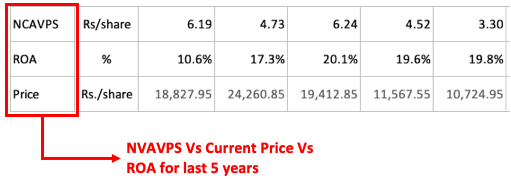
Check last 5 years ROA of the company. If they are positive and growing, still the market price is below NCAVPS, it becomes a good buy. Though further fundamental analysis must be done. How to do it? I do it using my stock analysis worksheet.
But if it is so rare to find a stock at NCAVPS price levels, why to bother going into its calculations? If we will try to locate NCAVPS stocks in “high, and mid cap, blue chip” category, we may never find it. But there is a fair possibility to find such stocks in small cap space.
Remember: Idea is to find a fundamentally strong stock trading at NCAVPS price levels.
Conclusion
It may take time for investors to identify shares which are trading at NCAVPS price levels. But once done, its benefit is unquestionable. But the investor must not forget about the limitation of NCAVPS, and how to manage it.
Typically, what to look for in a stock that will have a high ‘Net Current Asset Value Per Share’? First of all, it must be a cash rich company. Secondly, it must be a very low debt company. These characteristics will keep the company’s NCAV high.
My stock analysis worksheet uses NCAVPS as the first metric to estimate intrinsic value of stocks. But as NCAVPS has its limitations, hence other valuation models are use for practical purposes.
I hope you liked the article on Net Current Asset Value Per Share. It is a simple concept, but I’ve tried to explain it in a way that lots of other concepts also become clear. Please give me your feedback by posting your views in the comment section below.
Thanks and happy investing.


This is an excellent article. It is clear and helpful. Had it been printable, it would be a record for treasure. May think in that way
SIR
I WANT TO BUY YOUR EXCEL WORK SHEET
BUT I HAVE EXCELL 2007
HENCE CONFIRM WHETHER IT WILL WORK PLEASE.
Hi Manish,
Thank you for all the clarification related to NCAVPS.it really help me to analyze stock. can you please also clarify where we can find the exact no. related to ‘outstanding shares’.
You will get it in the company’s financial statement. You can also calculate it. Shares = PAT/EPS
great work bro .
Well researched
Thanks Mani. Excellent Work.
Your articles gave good understanding the share market and details to look into. Thanks a lot for your great effort.
Hello Mani, Thank you so much for the enlightening definitions, explanation of the concepts. I had watched many videos in youtube about the fundamental analysis before i happened to click getmoneyrich for the first time, the explanation, graphics and examples mentioned here complements my fundamental analysis understanding. Thank you Bro.
Thanks for the feedback
Very Clear and simple with graphical illustration. Getting more knowledge from you sir day by day. Thank You
fantastic explanation Mani. Thanks a lot.
Explained the concepts very lucidly.
Thanks