
The EV/EBITDA ratio is a financial metric that is commonly used to judge the valuation of a company. It is often used as an alternative to the (P/E) ratio. The EV/EBITDA ratio is considered to be a more comprehensive valuation metric. In this article, we’ll learn more about this ratio.
EV/EBITDA Calculator
Use this calculator to estimate a company’s EV/EBITDA ratio. Just input your company’s data in the fields and the calculator would give you the EV/EBITDA multiple.
Enter these numbers of Reliance Industries to know its EV/EBITDA multiple. Market Cap: 1577421 Cr, Cash: 21714 Cr, Debt: 194563 Cr, PAT: 39084, Tax: 7702 Cr, Interest: 9123 Cr, D&A: 10276 Cr.
Introduction
The EV/EBITDA ratio is a popular financial metric used by investors to evaluate the value of a company. It measures a company’s enterprise value (EV) relative to its earnings before interest, taxes, depreciation, and amortization (EBITDA).
This ratio is a key indicator of a company’s price valuation. Investors often use it to determine whether a company is undervalued or overvalued.
The EV/EBITDA ratio is particularly useful for evaluating those companies that have high levels of debt or those with significant investments in capital equipment.
Now, let us get into more detail on this subject.
Utility of EV/EBITDA
Companies that are more debt-burdened or are very capital investment intensive are better valued using EV/EBITDA ratio. For such companies, the use of the P/E ratio gives a less accurate picture of their valuations. Why?
Companies with high levels of debt have a higher risk of default. Hence, the role of debt must be factored in to estimate their valuations. Generally speaking, the presence of debt in the balance sheet reduces the company’s valuation.
Similarly, companies that have significant and regular investments in capital equipment have higher depreciation (D&A) expenses. It eventually lowers the company’s profits. But we must note that D&A is a non-cash expense. It is only an accounting assumption. By using EBITDA (which adds back depreciation and amortization to earnings), the EV/EBITDA ratio provides a more accurate measure of a company’s operating performance.
So, to value such companies, the use of the EV/EBITDA ratio is better than the P/E ratio.
What is EV/EBITDA Ratio
The EV/EBITDA ratio is a financial metric used to evaluate the value of a company relative to its earnings before interest, taxes, depreciation, and amortization (EBITDA). The ratio measures a company’s enterprise value (EV) by dividing it by its EBITDA.
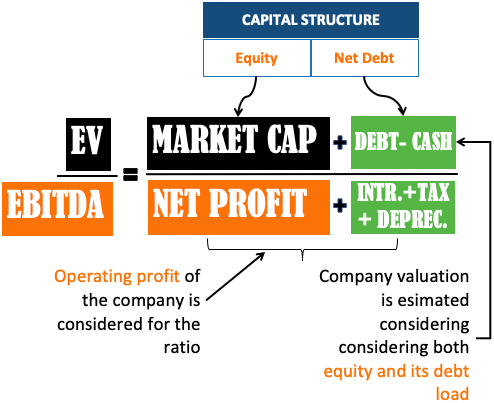
- Enterprise value is a measure of a company’s total value that includes debt, equity, and other liabilities. It’s calculated by adding a company’s market capitalization (the total value of its outstanding shares) to its debt and then subtracting its cash and cash equivalents. In other words, enterprise value represents the total cost of acquiring a company.
- EBITDA, on the other hand, is a measure of a company’s operating performance that adds back depreciation and amortization to earnings. This provides a more accurate measure of a company’s earnings before accounting assumptions (non-cash expenses) are taken into account.
The formula for the EV/EBITDA ratio is:
How to Calculate EV to EBITDA Ratio
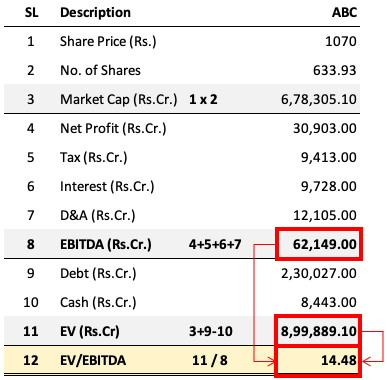
Let’s try to calculate the EV to EBITDA ratio of an example company ABC. There will be three stages of the calculation:
- Market Cap: To calculate market capitalization, first note down the share price (P=1070) and nos of shares outstanding (N=633.93 Cr.). Then multiplying P x N will give the market capitalization. For our example company, the market cap will be Rs.6,78,305 Crore (=1070 x 633.93).
- EBITDA: Note net profit (PAT), and adding to it the following non-operational expenses: tax, interest, and depreciation will give EBITDA. Our example company has an EBITDA of Rs.62,149 Cr.
- Enterprise Value (EV): It is calculated by noting the market capitalization and then adding net debt (debt – cash). For our example company, the market cap is Rs.6,78,305, and the net debt is Rs.2,21,584 Cr. (=2,30,027-8,443). Hence EV will be 8,99,889 Cr. (=6,78,305+2,21,584).
We are now ready will all the values required to calculate the ratio. Just use the EV and EBITDA numbers to do the calculation. As I’ve shown in the above calculations, the ratio for our example company is 14.48 (=8,99,889/62,149)
The resulting ratio provides a measure of how much an investor is paying for every Rupe of EBITDA of the company. A low EV/EBITDA ratio may indicate that a company is undervalued, while a high ratio may suggest that a company is overvalued.
How To Interpret EV/EBITDA
How investors can use the EV/EBITDA ratio to evaluate a company’s valuation? They can compare the EV/EBITDA multiple of a company with other similar companies within the same industry.
A low EV/EBITDA ratio compared to its peers may indicate that a company is undervalued. It is an indication of a good investment opportunity. A high ratio compared to its peers may indicate that a company is overvalued. Such companies may not be a good investment opportunity.
The typical range of EV/EBITDA ratios for different Indian industries can vary widely depending on the industry’s characteristics and market conditions. Let’s understand it using two examples:
- A capital-intensive industry: The construction industry may have a higher EV/EBITDA ratio. This industry relies more on debt to manage its working capital and CAPEX requirements. Moreover, the industry typically operates with lower cash levels.
- A less capital-intensive industry: The software services industry may have a lower ratio. The companies in this industry do not need heavy investments in equipment. They also have a higher stash of cash. They typically show low debt levels as well. The net effect is a low EV/EBITDA multiple.
- Generally Speaking: The EV/EBITDA ratio for Indian companies tends to be lower than that of their global counterparts. This is because, comparatively, Indian companies display lower debt levels compared to their global peers.
Interpretation
How to determine whether a company’s EV/EBITDA ratio is high or low relatively? Use the following steps:
- Step#1: Compare the ratio to the company’s historical ratio to see if it is higher or lower than its historical average.
- Step#2: Compare the ratio to the company’s current EV/EBITDA ratio to their sector’s/industry’s average multiple.
- Step#3: Compare the ratio to the average ratio of other companies in the same industry.
The average EV/EBITDA ratio for some of the major Indian sectors/industries is listed below:
| Industry | Average EV/EBITDA Ratio |
|---|---|
| Banking and Finance | 11.14 |
| Information Technology | 22.67 |
| Pharmaceuticals | 23.71 |
| Automobiles | 10.37 |
| Consumer Goods | 23.34 |
| Infrastructure and Construction | 15.61 |
| Metals and Mining | 7.80 |
| Oil and Gas | 5.27 |
| Power and Utilities | 7.06 |
| Real Estate | 16.70 |
The EV/EBITDA ratio can vary significantly between individual companies within each industry. Companies whose cash in-flow is weak may have to rely more on debt. This will take their ratio higher than the industry average. So it is important to conduct a thorough analysis of a company’s financial performance before making final decisions.
Comparison Between P/E and EV/EBITDA multiple
| Ratio | Formula | Interpretation |
|---|---|---|
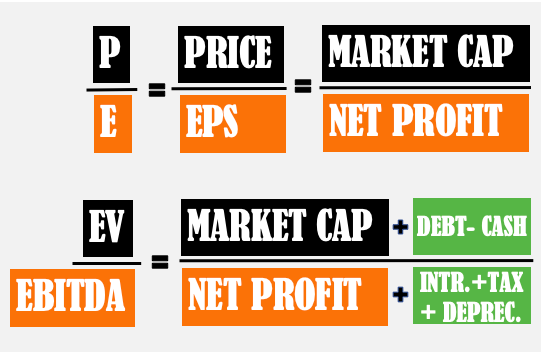
| P/E ratio | Market price per share / Earnings per share (EPS) | Compares the market price of a share with the company’s earnings |
| EV/EBITDA ratio | Enterprise Value (EV) / Earnings before interest, taxes, depreciation, and amortization (EBITDA) | Compares the enterprise value with a company’s cash earnings |
Please note that both the P/E ratio and EV/EBITDA ratio are commonly used valuation metrics in investment analysis. The P/E ratio compares a company’s market price with its EPS. The EV/EBITDA ratio compares the enterprise value with the EBITDA.
Here is the PE formula and its explanation:
While both ratios can be useful in evaluating a company’s valuation, they have different strengths and weaknesses.
- The P/E ratio is widely used and easily understood, but it can be influenced by non-cash items such as depreciation and amortization.
- The EV/EBITDA ratio is less influenced by non-cash items. It can be more useful for comparing companies with different capital structures or levels of debt. But it is not as well-known or widely understood as the P/E ratio.
It is essential to note that, both ratios should be used in conjunction with other financial and qualitative factors to make informed investment decisions.
Which is a better ratio P/E or EV/EBITDA?
The P/E ratio is a more widely used ratio among the two. But this is because it is easier to calculate the P/E Ratio than the EV/EBITDA multiple. Moreover, the P/E Ratio is also readily available for stocks in all major financial dailies and online journals. But EV/EBITDA can provide a better valuation judgment.
Example
Suppose there are two hypothetical companies ABC and DEF. Shares of both these companies are trading at a market price of Rs.250, and their Earning Per Share (EPS) is Rs.20. Hence, in this case, the P/E ratio for both ABC and DEF will be 12.5 (=250/20). As both companies have the same P/E, we might consider both as evenly priced, right?
But this might be a misguided assumption. Why? Because of the ‘EPS’ factor. How to calculate EPS? Net Profit/shares. Many non-operational factors might change the net profit number. Hence, the use of the P/E ratio alongside the EV/EBITDA ratio is better.
Let’s see two non-operating factors to understand how it influences the company’s EPS and hence its P/E ratio.
#1. EV/EBITDA is better than P/E because of the depreciation factor
Let’s take the company ABC for example. The same company can have two different net profit numbers for the same FY. This can happen if the management decides to take an alternative policy decision on depreciation deduction. Let me show you how.
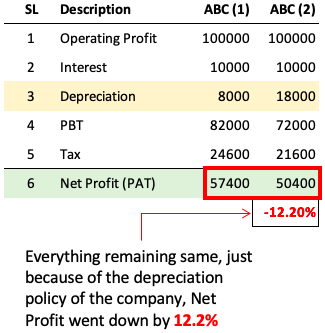
- ABC (1): The company has considered a Depreciation deduction of only 8,000.
- ABC (2): The depreciation deduction of 18,000 was considered. This can happen if the company opts for straight-line depreciation benefits vs an accelerated depreciation benefit respectively.
In the case of ABC (1) Net profit was 57,400. In the case of ABC (2), the net profit number slumped to 50,400. This is a fall of more than 12%. The point is that without any change in the company’s business fundamentals, the company would post less or high net profit numbers based on their management’s decision. For a trained eye, it might look like an ambiguity.
Hence, professional investors do not like to rely too much on PAT. They have more faith in EBITDA (operating profit) numbers to evaluate price ratios.
#2. EV/EBITDA is better than P/E because of the deferred tax rule
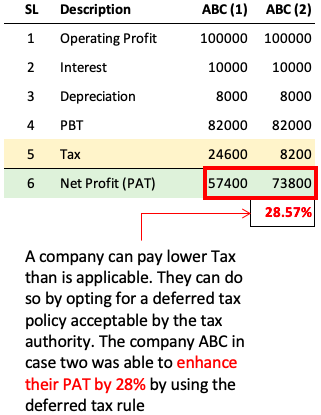
It is also possible to influence the net profit of the company through a deferred tax rule. A company may decide to show more net profits than actual by choosing to defer its tax liability in the future. Similarly, net profits can also be lowered by intentionally paying more tax than necessary.
So you can see, without any change in profits at the operational level, a policy decision by the management (agreeing to deferred tax liability) can enhance the net profit.
But if we are dealing in EBITDA instead of net profit (PAT), such artificial influence is not possible.
Advantages of Using EV/EBITDA Multiple
The use of the EV/EBITDA ratio as a valuation metric has several advantages for investors:
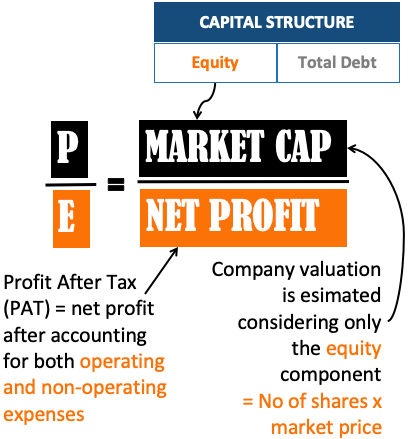
- The entire capital structure is considered: Unlike the P/E ratio, which only considers a company’s equity, the EV/EBITDA ratio considers the entire capital structure of a company. This includes debt and available cash, giving investors a more accurate picture of the company’s value.
- Considers EBITDA instead of PAT: The use of EBITDA in the calculation of the ratio is more reliable than PAT. This is because EBITDA is not influenced by non-cash items such as depreciation and amortization (D&A). PAT is calculated after accounting for D&A. For capital-intensive companies, the use of D&A can distort a company’s profitability and hence its valuation.
- Provides better comparative data: The EV/EBITDA ratio can be particularly useful for comparing companies with different levels of debt or capital structure. This is because the ratio takes into account both the company’s debt and equity. Hence it provides a more comprehensive picture of its valuation.
- Can help identify undervalued companies: The main utility of EV/EBITDA multiple is to highlight the price valuation of the company. The ratio provides a more accurate measure of valuation than the P/E ratio, particularly in industries with high levels of capital expenditure or high levels of debt
By using the EV/EBITDA ratio, investors can identify undervalued companies that may have a lower market capitalization than their peers, providing an opportunity for potential long-term gains.
Limitations of EV/EBITDA Ratio
We’ve seen the advantages of the EV/EBITDA ratio, but it also has some limitations. As an investor, we should be aware of them as well. We will present its limitations with respect to its usage as a valuation ratio.
- Growth Rate is Not Considered: To calculate the EV/EBITDA ratio, the future growth rate of the company is not considered. Hence, it will value the two companies equally even it’s their growth rates are different. In value parlance, it is incorrect.
- Suitable for Only Specific Industries: The EV/EBITDA ratio may not be suitable for companies of all industries. For example, a service-based company does not require significant capital expenditure. They also operate at a low debt level. For such companies, the P/E ratio is good enough.
- Not Appropriate For Highly Leveraged Companies: The EV/EBITDA ratio may not be appropriate for highly leveraged companies. As their debt levels remain high, their enterprise value is also inflated. Such companies will always appear as overvalued if reviewed using EV/EBITDA ratio.
- One-Time Gains are also accounted for in EV/EBITDA calculation. The EV/EBITDA ratio may be affected by non-recurring items such as “Other Income”. Though this is also the case with the P/E ratio. Anyways, one-time gains can distort a company’s ratio leading to wrong interpretation.
EV/EBITDA ratio also has some limitations. Investors should carefully consider the limitations and use the ratio in conjunction with other metrics. It will help one to take a more informed investment decision. Suggested reading: DCF method to value a company.
Quality of EV/EBITDA Ratio
As an investor, we should not rely only on a one-year EV/EBITDA number. We must track the history of this ratio. What we would like to see is a reduced ratio. This is step number one. The next step is to deeply check what has caused the lowering of the ratio.
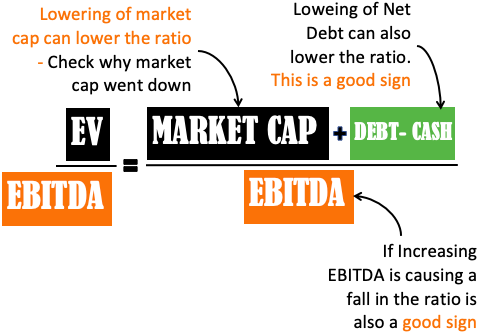
We would like to see a reduced ratio due to an increase in EBITDA or a reduction in net debt, or both.
The EV/EBITDA ratio may fall due to market cap correction (price fall). In such a case we must question and investigate why the market cap is falling.
Suppose a company’s stock price is falling and it is causing the lowering of the EBITDA multiple. In this case, one must check if the price fall is due to a dip in sales, net profit, EPS, net worth, or cash flow, numbers. Compare the quarterly data and it will give this clarity.
As an investor, we would be cautious to invest in a company whose sales, profits, etc are falling even if its EV/EBITDA multiple is at attractive levels. In short, only a low EV/EBITDA level is not enough, we must also check the quality of this ratio.
Examples of using EV/EBITDA ratio
Here are some examples of how the EV/EBITDA ratio is used to evaluate companies.
- In 2020, Kotak Institutional Equities recommended Larsen & Toubro based on its attractive EV/EBITDA valuation. The firm believed that L&T’s valuation had become more reasonable after the sharp correction in the Indian stock market in March 2020. They noted that L&T’s EV/EBITDA ratio had come down to 11.5x. At those levels, it was below its historical average and the average for its peers.
- In 2019, ICICI Securities recommended Cadila Healthcare, based on its attractive EV/EBITDA valuation. The firm noted that Cadila Healthcare had a strong domestic portfolio and a robust pipeline of specialty products. These factors could drive growth in the future. In those times, the company’s EV/EBITDA ratio of 12x. It was considered attractive compared to its peers in the Indian pharma space.
- In 2018, Motilal Oswal Securities recommended Infosys based on its attractive EV/EBITDA valuation. The firm noted that Infosys had a strong balance sheet and a robust pipeline of deals. The future growth of Infosys looked reasonable. In those days, Infosys’s EV/EBITDA ratio was 11x. It was attractive compared to its peers in the Indian IT industry.
You can calculate the current EV/EBITDA ratio of the above three companies using our EV/EBITDA calculator.
I’ve calculated the EV/EBITDA of L&T as of today (Apr 2023). Market Cap: 305010 Cr, Cash: 6498 Cr, Debt: 20298 Cr, PAT: 7879, Tax: 2129 Cr, Interest: 1754 Cr, D&A: 1172 Cr. The final value of the EV/EBITDA ratio has risen from 11.5x levels (2020) to 24.65x levels as of (Apr 2023)
By comparing a company’s enterprise value to its EBITDA, investors can get a better sense of its valuation.
Conclusion
As we have seen throughout this article, the EV/EBITDA ratio is a valuable tool that investors can use to evaluate the market valuation of a company. However, it’s important to keep in mind that no single metric can provide a complete picture of a company’s performance or prospects.
Investors should not rely solely on the EV/EBITDA ratio when making investment decisions. The ratio shall be used alongside other financial metrics, such as the P/E ratio, debt-to-equity ratio, ROCE, and intrinsic value.
Additionally, investors should conduct thorough fundamental analysis, including assessing a company’s competitive position, management quality, and growth prospects, before making investment decisions.
Have a happy investing.


Though I am an old C.A., I find the insight provided by you abt EV/EBITDA very useful. It takes years to derive such actionable interpretation. My God bless you!
Thank you for posting the awesome feedback.
Hi Mani,
Thanks for all the gyan shared in your blog. Great knowledge sharing. Kudhos.
In the above article I did not get how to calculate target price from the ratio. From the title, I assume you will summarize that part. What is the best way to calculate target price for a stock if I decide to invest in it?
Dear Mani,
Your articles are excellent and I am happy for you that you are following your passion. I have been following the stock market for quite some time but starting to understand more now. I have a Product Idea and would like to discuss with you. As far as I know, this kind of product is not available in the market. Please ping me on the email if you are interested to discuss.
Thanks
Thanks for your comment.