The Capital Asset Pricing Model (CAPM) is a financial model used by experts to establish a relationship between risk and return from an asset. But a common stock investor can also utilize the CAPM model. We can use it to tune our return expectations from stocks.
Generally, when we buy stocks, we do it with certain return expectations. But our expectations are based more on random assumptions. Our expected returns from stocks can range from 12% to 30% per annum, and sometimes even higher.
Our guess work on returns is mainly based on historical returns data. If a stock has posted a 15% p.a return in the last 5-Yr span, then we assume that the same may be replicated in times to come.
This is one way of guessing the future price. But CAPM model provides a more logical and formula based approach to estimate a stock’s potential returns. Of course, this is also a guess work, but it is based on a known financial model.
Our Feeling About Stock’s Price
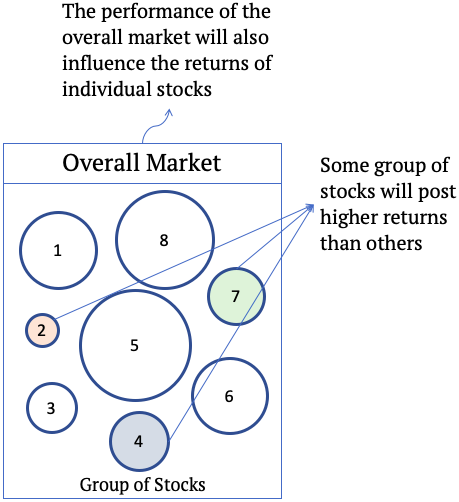
We might not be experts in finance, but we at least have a feeling about the stock’s potential returns. Following two factors can influence a stock’s future returns:
- Some types of stocks yield higher returns than others. We can feel that; more volatile stocks (risky ones) can make or break our investment. On the other hand, we also have safe stocks.
- The Market has a big influence on the returns. If the market is going down, no matter if it is IT, Energy, Pharma, or Bank stocks, their returns will be negative and vice versa.
The purpose behind highlighting the above two feelings brings forth the idea that these two factors can potentially lead to losses. This risk of loss must be understood more deeply by us investors.
Types of Risk
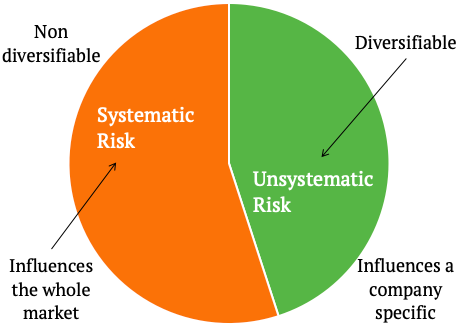
Our understanding of stock’s future returns is also confirmed by the CAPM model. It illustrates that there are two types of risk associated with stock investing:
- Unsystematic Risk: These are risks associated with the stock’s underlying business. For example, if a company posts lower EPS, its price will fall. All factors which directly or indirectly influence the business fundamentals of stock (like EPS) fall under the category of unsystematic risk. This is what explains why some type of stocks posts better returns than others. This type of risk is also called diversifiable risk.
- Systematic Risk: This type of risk is not diversifiable. Why? Because it is caused by factors which are not originating from a company-specific. It is more caused by factors like interest rates, inflation, currency’s strength, economy, etc. These factors influence the whole stock market.
How does this knowledge about systematic and unsystematic risk help us to gauge a stock’s future returns? Due to systematic risk, all stock prices will be affected. If the stock market is bullish, the price of stocks will generally go up. Similarly, if the market is bearish, the price of even the best of stocks will fall.
So it means that, if the market is following a trend (up or down), then it becomes comparatively easy to predict stock’s price. One example is price movement during COVID-19, or during the Yr-2008-09 subprime mortgage crisis.
During normal market times, stock’s price is more influenced by its underlying business fundamentals (mainly profits). If profits (EPS) are soaring, stock price will follow its trend.
Suggested Reading: How stock price is determined?
Now, the CAPM model uses the concept of systematic and unsystematic risk to suggest a solution to manage the risk of investing in stocks.
Portfolio Diversification
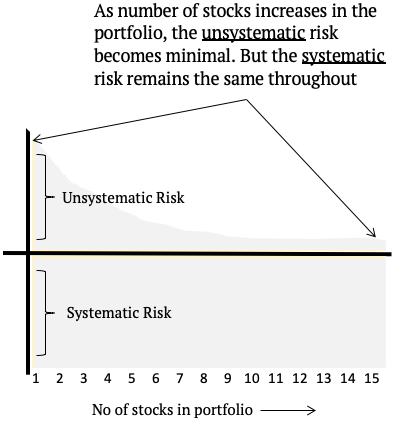
What is portfolio diversification? It says that, if we keep 15-20 numbers, non-related stocks in our portfolio, it will help in minimising the unsystematic risk to almost zero.
How it happens?
Suppose there is a hypothetical market that has only one product and this item is ice cream. For the first 6 months of the year (say in summer), ice-cream sales are robust. Hence the company will report good net profits. This also reflects in the company’s stock price (will rise). But for the next 6 months, ice cream sales are like zero (price will fall).
So for investors, for the first 6 months, his portfolio will see capital appreciation, and then it falls. There is no way for the investors to manage this risk of price fall.
Now suppose, another product line is introduced in the market. It is winter clothing. This item is sold more in winter and less in summer. Please note, the trend is inverse of ice cream sales.
So if investors have stocks of both ice cream and winter clothing companies, they will see minimum volatility in their invested capital.
So by keeping to inversely related stock in the portfolio, called diversification, the risk of price fall due to unsystematic risk has been managed.
In a real market scenario, including 15-20 number non related stocks will ensure decent diversification. The effect of diversification can also be understood from the below graphical representation.
Risk and Return Relationship
Now, we have understood the two types of risks involved in stock investing, and the maximum diversification we can achieve. What is the conclusion? There will always be some risk of loss involved when we buy and hold stocks.
It is a natural human instinct to always avoid risks. In stock investing, even a perfectly diversified portfolio will have a systematic risk. So why we still go with stocks? Before answering why let’s ask what is the alternative? If stocks are risky, what is risk free?
Risk-free investment instruments are bank deposits, government bonds, etc. Currently in India, investment yield of these instruments are in the rage of 3.5% to 7.5%. Compare it with our average inflation in last 5 years of about 6.5%. The effective return, net of inflation, is mostly in negative. This is the reason why, we must opt for equity investing.
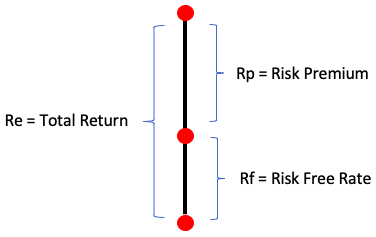
So, people will invest in equity to earn higher returns than risk-free investment options. This is what is called earning a risk premium. In terms of formula, the expected return from stocks can be expressed as shown below:
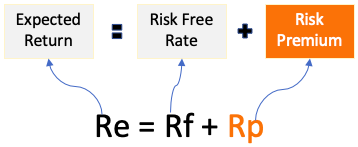
How a common man can read this formula? We always have an option of investing in risk-free investment options. But if we are investing in risky instruments like stocks, then we must be rewarded with a risk premium.
Use of CAPM To Estimate Potential Return of A Stock
This is where the Capital Asset Pricing Model (CAPM) formula takes the final shape. But before we see the formula, allow me to postulate again briefly about what is already said in the above paragraphs.
Return from stocks is dependent on two factors, first, on the individual stock’s fundamentals. They influence its future returns (unsystematic risk). Secondly, the overall market’s behavior also has an influence on the stock’s future returns (systematic risk). These two risks, in turn, make stocks a risky affair. Hence, the investors expect a healthy risk premium.
The risk premium is nothing but extra return that stock investors demand to invest in risky security like stocks.
So with this understanding, allow me to expand the formula shown above to something more complete. This is what we know as the CAPM risk-return formula:
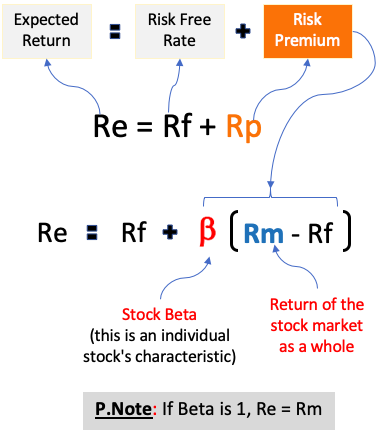
Explaining The CAPM Formula…
The above formula has two main components. The first is the risk-free rate (Rf). It is a minimum return that all investment securities must yield. The second component is risk premium (Rp).
The Rp again has two sub-components. A stock with a high beta translates into a higher risk premium (Rp). A stock’s beta is its individual characteristic. All stocks have their own beta number. Stocks can have a beta of less than one, one, or more than one. Stock with a beta of more than one will yield higher returns. For example, penny stocks generally have a high beta. Hence, in the bullish run, penny stocks can yield stellar returns.
The second sub-component is the risk premium of the overall market. It is denoted by Rm – Rf. During a bull run, indices like Nifty, Sensex, S&P BSE 500 show a dominant uptrend, which means high Rm. In such times, the Rm – Rf component will be high.
Now, lets combine the two:
Beta x (Rm – Rf) = Risk Premium of the individual stock.
The above formula can also be read as, “A stock with high beta, in a bull-run can yield a high risk premium.”
The effect of beta and Rm on the stocks total return potential can also be expressed graphically as shown below:
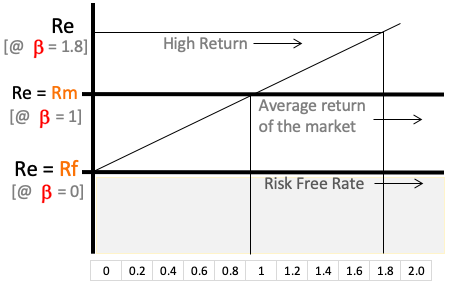
Let’s calculate the expected return of a hypothetical stock. Assuming a risk-free rate (Rf) of 7% per annum. Stock’s beta is 1.35. The expected return from investing in the Nifty index (Rm), for a period of the next 3 years, is (say) 12% per annum.
Re = Rf + Beta * (Rm – Rf) = 7 + 1.35 * (12 – 7) = 13.75%
Conclusion
CAPM model shown above is important for both the investors and the company. Investors can use it to tune their return expectation from a stock.
The company will use it to calculate its cost of equity (Ce). For the company, knowledge of the cost of equity is essential to calculate the weighted average cost of capital (WACC). Why WACC is important? A business can be called profitable only if its RoCE, ROIC, etc is higher than WACC.

Thank you
My pleasure
Awesome……
Explained in a simple way……
Thanks……
Thanks