Generally, how we evaluate performance of mutual funds? By looking at their historical returns.
Suppose there are two mutual funds A & B. The returns generated by these mutual funds in last 1 year has been as below:
- Mutual Fund (A): 12% per annum.
- Mutual Fund (B): 10% per annum.
Most likely, in which mutual fund you will invest your money? Probably “A”, right?
Now lets add two (2) conditions in the above values. Lets see how the conclusion pan’s out after that.
Condition #1: Performance Compared to Benchmark…
| Funds Name | Return (Last 1 Year) | Remark |
| Mutual Fund (A) | 12.0% | Underperformed its benchmark |
| Benchmark index of (A) | 12.2% | |
| Mutual Fund (B) | 10.0% | Outperformed its benchmark |
| Benchmark index of (B) | 8.6% | – |
What is visible in the table?
Though “A” has generated higher returns than “B” but it has underperformed its benchmark index.
Such mutual funds are not good? Why?
Because Fund Managers are expected to outperform their benchmark index.
That is why, we as investors, pay them that extra cost (expense ratio). Otherwise investing in index fund is better, right?
A mutual fund which is underperforming means, the fund manager (team) is not doing the expected job.
In this perspective, fund “B” is better as it has outperformed its benchmark index by 1.5%.
Condition #2: Performance Compared to “Total Return” of Benchmark…
| Funds Name | Return (Last 1 Year) | Remark |
| Mutual Fund (A) | 12.0% | Underperformed its benchmark |
| Benchmark index of (A) – TRI | 13.7% | |
| Mutual Fund (B) | 10.0% | Underperformed its benchmark |
| Benchmark index of (B) – TRI | 10.1% | – |
What has changed in the above table? Two things:
- We have added a suffix (TRI) next to benchmark.
- The Return on both the benchmark has increased by 1.5%.
So two questions automatically comes to mind:
What is TRI? How the returns of benchmark has increased?
TRI is an abbreviation for “Total Return Index.
We will see what is TRI, but before that, lets comprehend its impact on our analysis of mutual fund.
As benchmark’s return has increased by 1.5%, this has made both the mutual funds “A” and “B” as under-performers.
So ideally speaking, investors must look at both the funds “A” and “B” with lot of scepticism.
So now we are read to know what in the world is TRI… 🙂
#1. SEBI’s Guidelines on TRI…
On Jan’2018, SEBI issued a circular. The circular was addressed to all mutual funds (AMCs) etc.
The subject of the circular was, I quote:
“Benchmarking of Scheme’s Performance to Total Return Index”.
As per this circular, all mutual funds must be benchmarked to the “Total Return” variant of their respective indices.
What SEBI was exactly asking AMC’s to do?
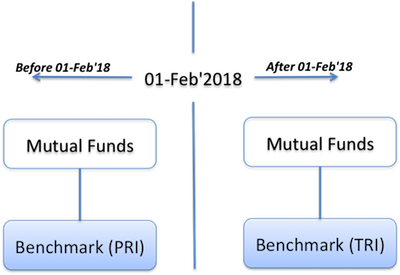
Before 01-Feb’2018, most of the mutual funds had “Price Return Index (PRI)” based benchmarks.
After 01-Feb’2018, all mutual funds must have “Total Return Index (TRI)” based benchmarks.
SEBI has issued this circular in the interest of the common man (investors). How?
For this we must first know the difference between PRI and TRI based benchmarks.
What are PRI and TRI based benchmarks?
As we saw in the above example, with introduction of TRI based benchmark, both fund A and B became under-performers.
In PRI based benchmarking, only fund A could be identified as an under-performer.
Why this happened? To understand this, lets know what is PRI & TRI.
What is “Price Return Index (PRI)”?
In this type of index, only price appreciation of index is recorded.
What is “Total Return Index (TRI)”?
In this type of index both, capital appreciation and dividend/interest earned by the index is recorded.
In simple words, TRI = PRI + Dividend Yiled
Why TRI based benchmarking was introduced?
The logic is very simple.
Suppose you bought stocks of TCS & RIL.
In how many ways you will be rewarded over time by these stocks? In two ways:
- Price Appreciation, and
- Dividend earnings.
The same logic is applied for the “stock market indices” as well.
What are stock market indices? A basket (collection) of several stocks.
To understand how these indices has performed, NSE and BSE used to track only the “price” component of the index.
Hence such indices are called Price Return Index (PRI)”. Example: Nifty 50 Index.
Now consider this, suppose there is an index fund whose benchmark is Nifty 50.
Also assume that, in last one year Nifty 50 index has moved up 12%.
How much return this index fund will generate for its investors?
- By Capital Appreciation (12% as index went up).
- By Dividend (say 1.5%).
What will be the total return generated by this mutual fund? 13.5% (12%+1.5%).
How the mutual fund has performed compared to its PRI benchmark?
- Nifty 50 (PRI) – Moved up by 12%.
- Index Fund – Generated return (13.5%).
- Conclusion: Index Fund has outperformed Nifty 50.
But isn’t it wrong? How can a index fund outperform its own benchmark index. It is impossible.
This has happened because of the fallacy in estimating performance of the benchmark index.
- Benchmark’s performance is devoid of dividend.
- Index fund’s performance includes dividend.
A similar analogy can be used for any mutual fund and any benchmark index.
This proves why PRI based index does not show the real picture.
TRI based index, which includes both price and dividend component, gives more realistic representation of the performance of the benchmark.
What TRI means for the mutual fund industry?
After introduction of TRI based benchmarking, mutual funds has to work harder to earn the tag of an “out-performer”.
How TRI effects performance of mutual funds?
Actually, TRI has no influence on performance of mutual funds.
What it does is only to change the “degree of perception” of the mutual fund among its investors.
What do I mean?
Suppose there is a “Multi Cap Fund” which has S&P BSE 500 (PRI) has its benchmark.
In last 5 year, this mutual fund generated a return of say 17.1% per annum.
So do you think that this mutual fund could have performed any differently had its benchmark index been different?
I don’t think so. But what would change is the perception. How?
In last 5 years, S&P BSE 500 (PRI) has risen as below:
- 27-Sep’2013 – 7,117.86 Levels.
- 14-Sep’2018 – 15,528
- Growth of: 17.00% (CAGR).
Had it been S&P BSE 500 (TRI), it returns would be as below:
TRI = PRI + Dividend Yield = 17%+3.31% = 20.31%.
If we compare this mutual fund with these two indices the conclusion will be as below:
| – | Return CAGR (Last 5 Year) | Remark |
| Multicap Fund | 17.10% | Out-performer. |
| S&P BSE 500 (PRI) | 17.00% | – |
| Multicap Fund | 17.10% | Under-performer |
| S&P BSE 500 (TRI) | 20.31% | – |
S&P BSE 500 (TRI) index makes the multicap fund look like an under-performer. Whereas, in comparison to S&P BSE 500 (PRI) index, multi cap fund is a out-performer.
So numbers are giving a clear picture. But how we, as small investors, should look at these data?
A return on 17.1% (CAGR, 5 years) is anyways a great return.
I am sure majority investor will love such multi cap funds irrespective of it being an out-performer or an under-performer.
But underneath that love, investors will remember that the fund could not beat its TRI based benchmark.
Probably its time to ask questions to the fund manager…
This is the only effect that a TRI based benchmarking can have on a mutual fund.
What is the effect? Higher investors expectation.
How to compute performance of benchmarks in TRI Regime?
What we see in below price chart of S&P BSE 500 index is only its price component:
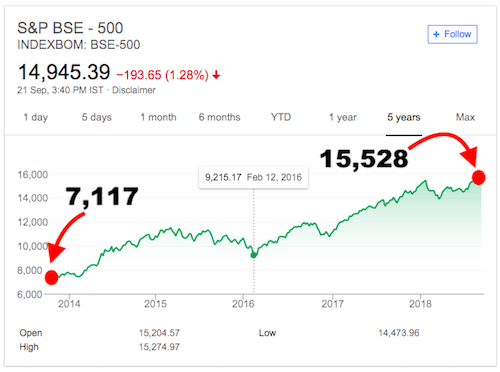
In last 5 years, S&P BSE 500 index rose from 7,117 to 15,528 levels.
This is a growth rate of 16.88% CAGR.
The point is, the PRI based data collection and index computation has been going on for years in India now.
But TRI based regulation has started only recently (post 01-Feb’2018).
So if we need to calculate performance (CAGR) of S&P BSE 500 index in last 5 years, how it will be done?
By use of the below formula as suggested by SEBI in their circular:

| Example | – | – |
| Date: | S&P BSE 500 (PRI) Values | S&P BSE 500 (TRI) Values |
| 27-Sep’2013 | 7,117 | – |
| 12-Feb’2016 | 9,216 | 9,316 |
| 14-Sep’2018 | 15,528 | 18,028 |
So as on 15-Sep’2018, performance of S&P BSE 500 index will be as below:
CAGR = (9216/7117) * (18,028/9316) ^ (1/4.967years*) -1 = 20.31%
[* 27-Sep-2013 to 14-Sep’2018 = 1813 days = 4.967 years.]
In PRI Regime, the return would have been as below:
CAGR = (15528/7117) ^ (1/4.967) -1 = 17.00%.
Performance of benchmark (S&P BSE 500 Index) – PRI Vs. TRI is as below:
CAGR (PRI) : 17%
CAGR (TRI): 20.31%
Conclusion
To buy mutual funds, past performance of mutual fund is a key selection criteria.
How we evaluate past performance of mutual funds?
- Comparison between similar funds.
- Comparison between funds and its benchmark.
A mutual fund which has outperformed its peers and benchmark are most favoured by investors.
TRI based benchmark will also show higher returns than PRI based benchmarks.
Hence it will be tougher for the fund manager of actively managed funds to earn the tag of “out-performer” in TRI based regime.
As mutual funds are already reinvesting their dividend income, hence incorporation of TRI based system was only evident.
TRI based benchmarking may pose tough times for the AUM’s but it will add more transparency for the investors.
The website of NSE provides TRI values of their indices (last 365 days only).
Performance of Nifty 50 in last 1 year (PRI Vs. TRI)
| Months | Nifty 50 (TRI) | Nifty 50 (PRI) |
| Sep’17 | 14,153 | 10,340 |
| Oct’17 | 14,077 | 10,269 |
| Nov’17 | 14,634 | 10,674 |
| Dec’17 | 14,662 | 10,676 |
| Jan’18 | 14,881 | 10,806 |
| Feb’18 | 14,610 | 10,646 |
| Mar’18 | 14,800 | 10,756 |
| Apr’18 | 15,252 | 11,060 |
| May’18 | 14,626 | 10,664 |
| Jun’18 | 14,775 | 10,743 |
| Jul’18 | 15,152 | 10,991 |
| Aug’18 | 15,880 | 11,498 |
| Sep’18 | 15,807 | 11,434 |
| CAGR (1Y) | 11.69% | 10.58% |
| Difference | 1.11% | . |
In last 12 month, PRI based Nifty 50 Index rose @10.58%.
In the same period, TRI based Nifty 50 Index rose @11.69%.
TRI based Index’s CAGR growth rate was 1.11% higher than PRI based index.




Super read..very well explained.
Hello. I want to know about Term Plan. Please provide it.Thanx.
Great and an informative article!