
Why operating profit margin is critical for investors? Because it highlights the profitability of operations of the company. A high operating profit margin is a strong indicator of an inherently profitable business. Investors always strive to buy stocks of such companies.
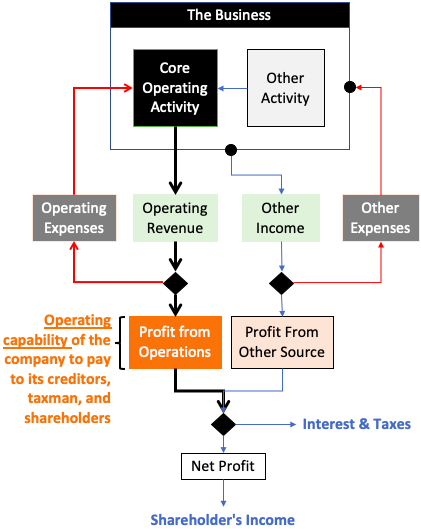
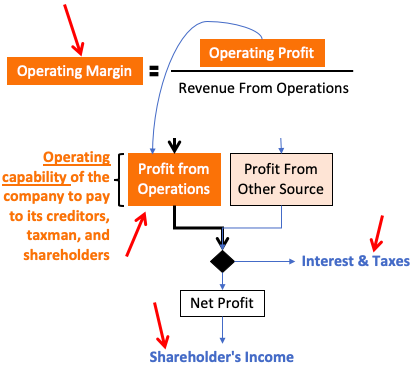
Operating profit margin highlights the capability of the core business (its operations) to generate income for its creditors, taxman, and shareholders.
The Operating Margin is a better indicator of profitability than the Net Margin? It is a better indicator because it does not include other income. Why?
Suppose there is an automobile company whose net profit margin is 25%. But 50% of its revenue is coming from other sources, not from its operations.
It means the profitability of its operations is less than what is indicated by the net margin (25%). The value of the net profit margin of 25% is giving a faulty interpretation of the profitability.
Operating Profit Margin Formula
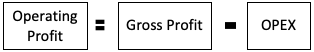
Operating Profit
The income generated by a company from its operations is called operating profit. The core of any business is its operations. The use of a specific portion of income and expenses finally yields operating profit. The values for computation of the margin are available in the P&L Account.
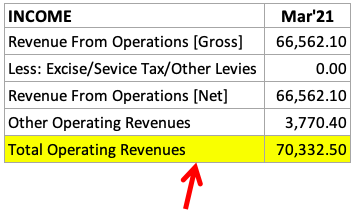
- Income: The P&L Account of any company can have two components of revenue, income from operations and other income. Operating profit calculation will not use the other income component for calculation. Interest income, dividends from subsidiaries, sale of the asset, etc are few forms of other income. If we’ll look into the P&L account of a company in moneycontrol, revenue from operations is visible clearly (see below).

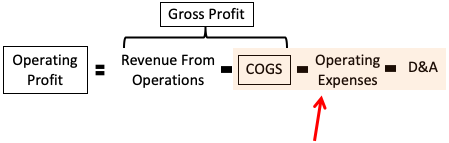
- Expenses: All expense booked for the production of saleable-goods of a company falls under the two heads, Cost of Goods Sold (COGS) and Operating Expenses. D&A is also considered an operating expense. From moneycontrol, we can calculate all operation linked expenses as shown below:

COGS and Gross Profit
Financial reports published in India are slightly different. The categorization of expenses under the head Cost of Goods Sold (COGS) is absent. But we can still calculate it from the published numbers. It is better to have a visible COGS number. Why? Because it gives us a cost that is directly associated with the production of goods produced by the company.
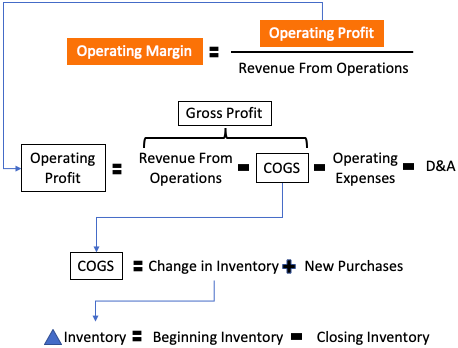
Revenue from operations minus COGS is Gross Profit.
Gross Profit = Revenue From Operations – COGS
The formula used to calculate COGS is this:
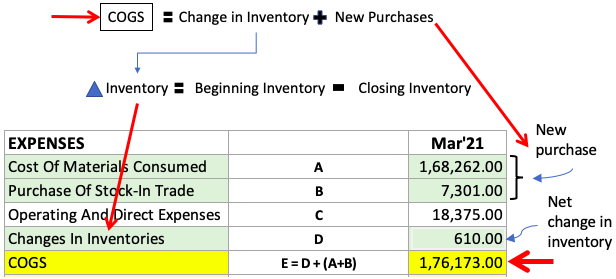
- Beginning Inventory for a financial year (FY) will be the ending inventory number of the last FY. It mainly depicts the unsold finished good inventory, unutilized raw materials (if any), and stock-in-trade.
- New Purchases for an FY will be mainly new raw material and stock-in-trade items bought in that year.
- Closing Inventory for a financial year (FY) will be the unsold finished good inventory, leftover raw materials, and unused stock-in-trade.
[Note: The companies of the Service sector maintain no inventory. Hence for such companies, COGS is calculated as zero. In few examples, we will see how the gross profit and operating profit of such companies are derived.]
Operating Expense (OPEX) with D&A
All costs attached to operating a business are segregated into COGS and OPEX. We have already discussed how COGS is calculated. Now let’s talk about OPEX calculation.
I use a formula to arrive at a reasonable OPEX number. As this value does not directly appear in the P&L account, hence it must be separately calculated.
OPEX number include expenses like rent, salaries, sales and marketing, insurance, R&D cost, etc. Most of these numbers are clubbed in the P&L account as “Other expenses”.
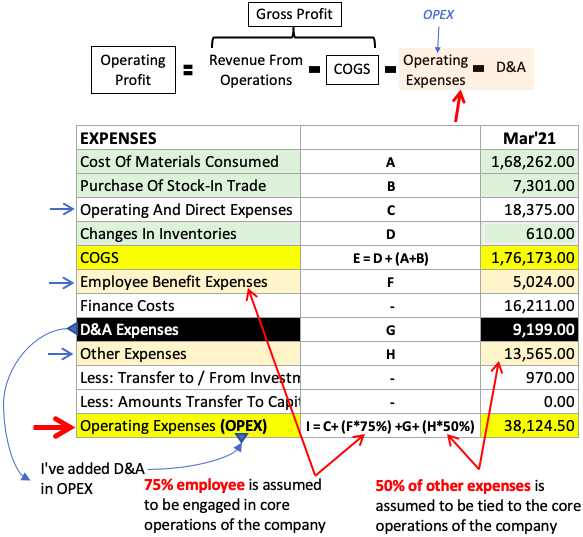
From the numbers published on the moneycontrol’s website, I calculate the OPEX number using the formula shown below. Please note that the D&A is included in the OPEX calculation.
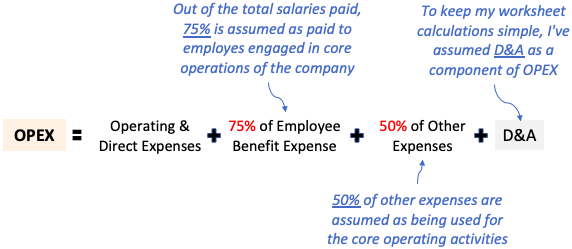
[Note: Why Depreciation and Amortization are considered as operating expenses? It is assumed as a proxy expense to compensate for the normal wear and tear of the assets over time. It is considered as an expense, that must be encountered for the up-keep of the assets of the company.]
Operating Margin
Operating margin is the ratio between operating profit and operating revenue of a company. It is expressed as a percentage that highlights what portion of revenue is left to pay to the creditors, taxman, and the shareholders. In terms of formula it is expressed as shown below::
Why operating margin is important? It is important for both the company and its investors. How? Suppose a company’s operating margin is 25%. What does it say about the company?
Out of every Rs.100 earned from the sales, Rs.25 is retained by the company. The balance, Rs.75 is used as the cost of operations. So, a higher operating margin means less cost-intensive is the core business of the company. To understand it more clearly, lets’ take the example of Coca-Cola.
- Cost (Rs.2.00 / 250ml): Coca Cola’s cost of production of its soft drink is about Rs.4 per ltr. So a 250ml soft drinks cost of production is about Rs.1.0. The cost of bottling the liquid is another Rs.0.6 per 250ml. Let us say other operating expenses to produce a 250ml Coke bottle is another Rs.1.0. This way, the total operating cost to produce a 250ml of Coke is about Rs.2.6.
- Revenue: Suppose Coke gives Rs.3 per bottle to its distributors and retailers. So, to make a 250ml bottle of Coke reach its customers, the total cost to the company is Rs.5.6. At what price do we buy a 250ml bottle? Rs.19. Hence, the net revenue for Coca Coal is Rs.16 per bottle.
Operating Margin = Operating Profit / Revenue = (16-2.6) / 16 = 83.75%
Conclusion
You must have seen FII/DII’s (pro investors) buying stocks of companies reporting negative net profits. For retail investors, it is a confusing scenario. Why do pro investors continue to invest in a sinking ship? Because it is not a sinking ship. One such example is Bharti Airtel.
In the last five years, Bharti Airtel has reported negative net profit numbers. But see its Gross margin and operating margin numbers in the below table.
| Airtel | Mar-21 | Mar-20 | Mar-19 | Mar-18 | Mar-17 |
| Net Profit | -25,198 | -36,088 | -1,869 | 79 | -9,926 |
| GP | 64,326 | 54,317 | 49,606 | 53,663 | 62,276 |
| GM | 100.0% | 100.0% | 100.0% | 100.0% | 100.0% |
| OP | 12,786 | 2,474 | 798 | 15,280 | 23,079 |
| OM | 19.9% | 4.6% | 1.6% | 28.5% | 37.1% |
What do a positive GM and OM suggest? It suggests that the company is not operating at a loss. In FY Mar’19 and Mar’20, the operating margin was too low, but in FYs Mar’21, Mar’18, Mar’17 it was between 19% to 37% mark.
[Note: Airtel does not produce any goods for sale. Hence, its COGS is zero. It is a company from Service Sector. That is why its GM is showing as 100%.]
A business capable of yielding a positive operating profit and a high operating margin has a correct business model in place. It means, if things are done in the right way, such a business is capable of creating shareholders value over time
Gross Profit, Operating Profit, and Operating Margin of Few Top Indian Companies
(Updated: Oct’21)
GP = Gross Profit, GM = Gross Margin, OP = Operating Profit, OM = Operating Margin
| Company | Industry | Description | Mar-21 | Mar-20 | Mar-19 | Mar-18 | Mar-17 |
| RIL | Mfg. | GP | 69,494 | 92,242 | 1,01,333 | 87,977 | 77,453 |
| GM | 28.3% | 27.4% | 27.3% | 30.3% | 32.0% | ||
| OP | 31,370 | 49,387 | 54,435 | 59,094 | 50,781 | ||
| OM | 12.8% | 14.7% | 14.6% | 20.4% | 21.0% | ||
| AsianP | Mfg. | GP | 8,434 | 7,688 | 6,981 | 6,171 | 5,779 |
| GM | 45.5% | 44.7% | 42.6% | 43.6% | 45.7% | ||
| OP | 5,484 | 4,836 | 4,477 | 4,037 | 3,744 | ||
| OM | 29.6% | 28.1% | 27.3% | 28.5% | 29.6% | ||
| TCS | IT | GP | 1,35,963 | 1,31,306 | 1,23,170 | 97,270 | 92,599 |
| GM | 100.0% | 100.0% | 100.0% | 99.9% | 99.9% | ||
| OP | 67,207 | 64,604 | 61,505 | 47,056 | 45,408 | ||
| OM | 49.4% | 49.2% | 49.9% | 48.3% | 49.0% | ||
| HUL | FMCG | GP | 24,319 | 20,992 | 20,264 | 18,293 | 16,205 |
| GM | 52.9% | 54.1% | 53.0% | 53.0% | 50.8% | ||
| OP | 16,252 | 13,935 | 13,490 | 11,870 | 10,325 | ||
| OM | 35.3% | 35.9% | 35.3% | 34.4% | 32.4% | ||
| Airtel | Telecom | GP | 64,326 | 54,317 | 49,606 | 53,663 | 62,276 |
| GM | 100.0% | 100.0% | 100.0% | 100.0% | 100.0% | ||
| OP | 12,786 | 2,474 | 798 | 15,280 | 23,079 | ||
| OM | 19.9% | 4.6% | 1.6% | 28.5% | 37.1% | ||
| Dmart | Retail | GP | 3,431 | 3,659 | 2,936 | 2,360 | 1,785 |
| GM | 14.4% | 14.8% | 14.7% | 15.7% | 15.0% | ||
| OP | 2,091 | 2,445 | 2,007 | 1,625 | 1,201 | ||
| OM | 8.8% | 9.9% | 10.1% | 10.8% | 10.1% | ||
| ITC | Diversified | GP | 25,511 | 28,385 | 27,691 | 24,838 | 24,112 |
| GM | 56.1% | 62.2% | 61.5% | 61.1% | 60.1% | ||
| OP | 18,249 | 20,917 | 20,504 | 18,422 | 17,696 | ||
| OM | 40.1% | 45.8% | 45.6% | 45.3% | 44.1% | ||
| L&T | Construct. | GP | 66,052 | 76,105 | 76,795 | 66,036 | 56,831 |
| GM | 90.1% | 92.4% | 93.3% | 88.7% | 86.5% | ||
| OP | 8,749 | 8,660 | 9,111 | 9,221 | 7,887 | ||
| OM | 11.9% | 10.5% | 11.1% | 12.4% | 12.0% | ||
| Maruti | Auto | GP | 19,515 | 22,454 | 25,766 | 24,788 | 21,303 |
| GM | 27.7% | 29.7% | 30.0% | 31.1% | 31.3% | ||
| OP | 8,512 | 10,446 | 14,489 | 14,909 | 12,591 | ||
| OM | 12.1% | 13.8% | 16.8% | 18.7% | 18.5% | ||
| Sun Pharma | Pharma | GP | 8,009 | 7,964 | 6,630 | 5,435 | 4,387 |
| GM | 62.6% | 63.6% | 64.3% | 60.4% | 57.1% | ||
| OP | 4,436 | 4,351 | 3,247 | 2,313 | 1,453 | ||
| OM | 34.6% | 34.7% | 31.5% | 25.7% | 18.9% | ||
| Titan | Jewellery | GP | 4,833 | 5,498 | 5,083 | 4,236 | 3,608 |
| GM | 23.5% | 27.5% | 26.7% | 27.1% | 28.0% | ||
| OP | 2,708 | 3,388 | 3,184 | 2,684 | 2,134 | ||
| OM | 13.1% | 16.9% | 16.7% | 17.2% | 16.6% |
EXCELLENT GIVES INSIGHT OF TOTAL OPERATIONS AND BUSINESS.
MOST USEFUL
THANKS & REGARDS
d m naik
Thanks for the feedback.