
There is no doubt that Nifty and Sensex are trading at their all-time highs. For the last two days, from 19-Oct’21, the market is showing signs of correction. In days, the Nifty50 has fallen by about 2.5%. So, our stock market is overvalued or undervalued?
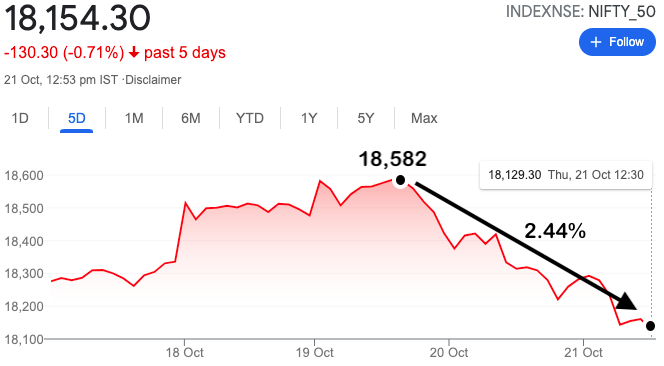
People are waiting for a sizeable correction of the market. Why? Because it may again bring a buy-opportunity. At the current levels (Nifty 18,000+, Sensex 60,000+), people are apprehensive of the valuations (overvaluation). The apprehension is also justified.
About 18-months back, when Sensex was at 40000, people were calling it overvalued. Today it has crossed 60,000 levels. But still, some people are investing. It is confusing, right? How to know if the Indian stock market is overvalued?
It is what we will try to answer in this article. We will take the example of Nifty-50 as on 20-Oct’2021. We will analyze the valuation of Nifty.
Introduction
We will use the numbers published by NSE on their website. The parameters based on which we will do the analysis, valuation of Nifty-50, are the following:
- PE Ratio of Nifty-50.
- PB Ratio of Nifty-50.
- DY (Dividend Yield) of Nifty-50
How to do the analysis? Based on the database, we will establish a trend. We’ll check the historical levels of PE, PB, and DY. The focus will be more on the pre-covid crash and post-covid crash numbers.
We start the number crunching from 01-Jan’18 to 20-Oct’21. It is a period which is three years and ten months long. Though it is not a very long period, it will surely suffice our conclusion. It will give a strong feeling about whether the stock market is overvalued at current levels or not.
Such an analysis helps those investors who prefer index-investing over direct stock investing. Who likes investing in it? People who want to take advantage of long-term equity growth but prefer indulging in it only passively, like index-investing.
I would also like to add that it is a simple analysis. Even beginners can use this method to judge the valuation of the market.
What conclusion is possible from such an analysis for a stock investor like me?
I do not generally invest in an index. I prefer direct stocks. An overvalued market asks me to go slow. Why? Because a correction is waiting in the future. An undervalued market motivates me to do a detailed fundamental analysis of the stocks in my watchlist.
#1. PE Analysis of Nifty-50
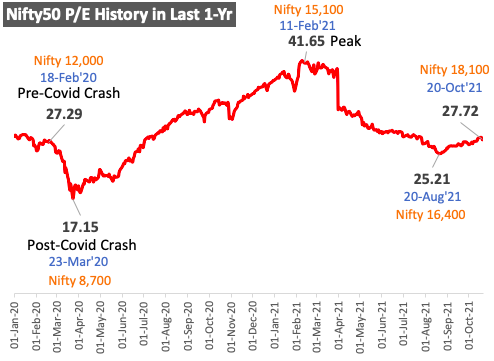
To get a first impression of the valuation of Nifty-50, begin with PE for a shorter period of 22-Months (2020 to 2021). We can read the chart from left to right.
- 18-Feb’20: From the above chart, it looks the COVID-19 crash started approximately from this date. Then, Nifty-50 was trading at 12,000 levels. At this juncture, most of us were not aware of the COVID phenomenon about to happen. On this day, the P/E ratio of Nifty was 27.29.
- 23-Mar’20: The downward momentum started in the second week of Feb’20, and in the next 45-Days the Nifty touched its bottom (in Mar’20). On this day, the Nifty was at 8,700 levels. It was down by almost 30%. At these levels, the P/E ratio of Nifty was 17.15.
- 11-Feb’21: In terms of PE ratio, Nifty peaked at 41.65 (all-time high PE). On this date, the Nifty-50 was at 15,100 levels. The upward movement from 23-Mar’20 till 11-Feb’21 was relentless. Please note that even on Jan’08 (before the mortgage crisis), the Nifty PE level was 28.25 (See 14-Year PE Chart).
- 20-Oct’21: As of date, the Nifty PE has cooled down considerably. Currently, Nifty PE is at 27.2 levels. From these numbers, it looks like the Nifty PE is at pre-covid levels. But I’m unable to say if the Nifty is too overvalued. But the valuation certainly looks on the higher side.
PE History 2018 to 2021 (3Y, 10 Months)
To make the conclusion more decisive, allow me to present to you the PE chart of the last 3-Years and 10-months (2018 to 2021).
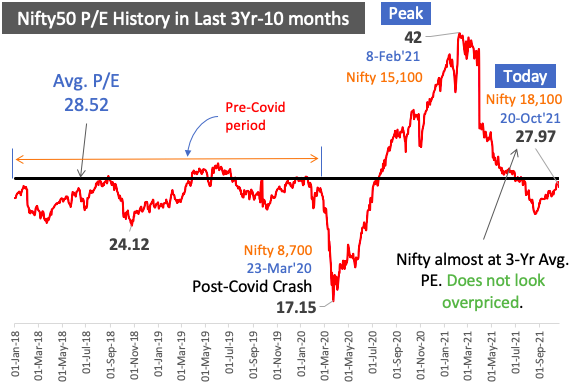
As we have broadened our database, the trend is looking more clear. Check the pre-covid period (2018 to 2020). The PE of Nifty was trying to touch the 28.5 mark and then correcting. In those times, the PE28 number was the top end of Nifty’s PE. It remained like that till Feb’20. In Mar’20, when Nifty declined, its PE touched the bottom of 17.5 level.
So, considering the pre-covid period as normal-market, the PE in those days was in the 27 range. Now, compare it with the present PE of 27.97 levels. The market does not look overvalued. Right?
Deeper Understanding of PE Ratio
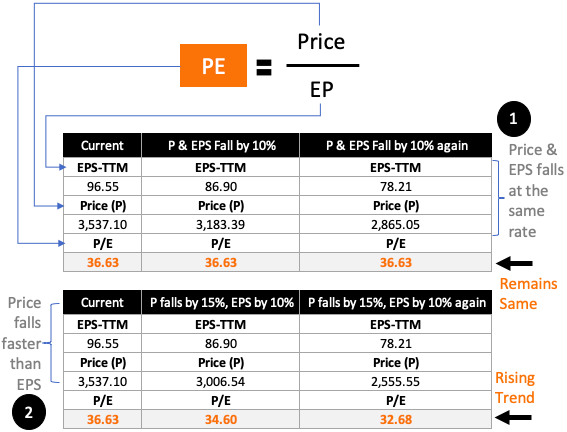
In the above set of numbers, there are two scenarios.
- First: The price and EPS fall at the same rate (10%). In this case, the PE ratio remains constant at 36.63 levels.
- Second: The price is falling at 15%, and EPS falls at a slower rate of 10%. In this case, the PE falls from 36.63 to 34.60 and then to 32.68 levels.
It is a simple mathematical rule. For the ratio to remain the same, the numerator and the denominator should change proportionately. An unproportionate change will cause it to rise and fall.
If the ratio is increasing, it means that the price is rising faster than EPS. It is a trend taking Nifty towards overvaluation. Similarly, if the price is sinking more rapidly than the EPS, the ratio will fall. It is a trend towards undervaluation.
This understanding is more useful in times like COVID. Why? Because of the global lockdown, both stock prices and companies’ profits were falling. In this scenario, if PE is falling, it means the price is falling faster than EPS. If PE is rising, the price is growing faster than EPS. The former gives us a buying opportunity, and the latter is the time to cool off our guns and wait (investment pause).
#2. PB Analysis of Nifty 50
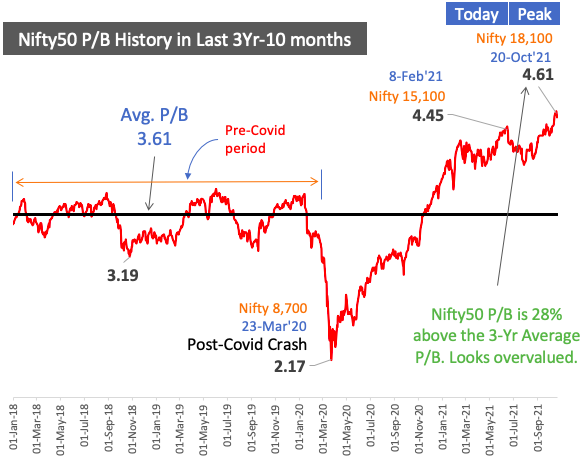
Please look at the PB ratio of the pre-covid period. It remained at the average 3.61 levels. After the covid crash, the P/E ratio fell to 2.17 levels. But see where is the P/E ratio today, at 4.61 levels. It is about 28% higher than the 3-YR average PB levels. It is a sign of overvaluation.
If we can expand our dataset to the last 14-Years, the overvaluation of Nifty will be even more clearer.
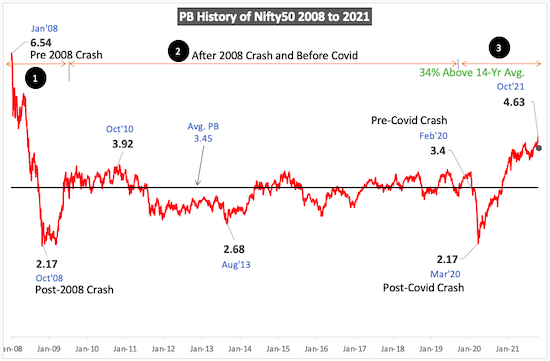
We have divided the whole 14-Year PB chart into three segments.
- #1 2008-2009: This was the period when the mortgage crisis of the USA struck the world. Here you can note the PB levels of Nifty before the crash. It was trading at 6.54 levels. After Nifty crashed, it tumbled down to 2.17 levels.
- #2 2010 to 2019: This is the period between two major disruptions, the mortgage Crisis of 2008 and Covid-2020. Hence for us, it is a normal market. During this period, check the PB ratio of Nifty. It was hovering around the 3.45 levels.
- #3 2020-2021: When the COVID crash happened in Feb’20, the Nifty PB was at about 3.4 levels. Historical numbers suggest that, in Feb’2020 it was not at overvalued levels. But COVID came and hit the world hard. Coincidently, after the COVID crash, the Nifty PB fell to 2.17 levels again (like 2008-09). But what is the Nifty’s PB today? I is at 4.63 levels. It is 34% above the 14-YR average PB ratio.
By looking at these historical PB numbers, we can conclude that Nifty is overvalued. This conclusion is different from what was arrived at after Nifty’s PE analysis (above).
#3. Dividend Yield (DY) Analysis of Nifty 50
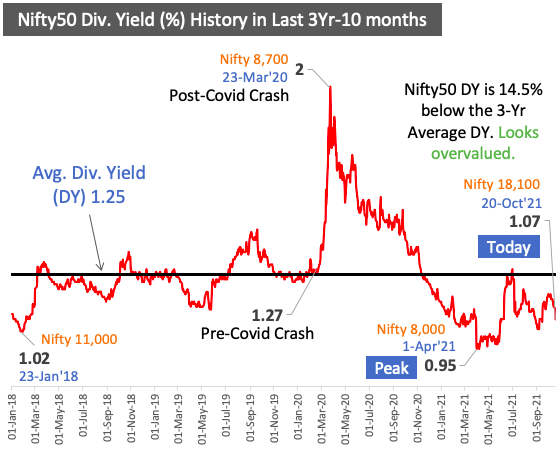
First, we will look at the data from 2018 to 2021. I’ve plotted the chart for this period, and the pattern is clear. Before the COVID waves struck the world, the dividend yield of Nifty50 stocks was hovering around 1.25% levels. After the stock market crash in 2020, the dividend yield was at its maximum of 2.0% levels. As of today, the dividend yield of Nifty is at 1.07%. Comparing these numbers, Nifty does not look overvalued.
Let’s expand our gauge wider and see the trend between the years 2008 and 2021 (last 14-Years)
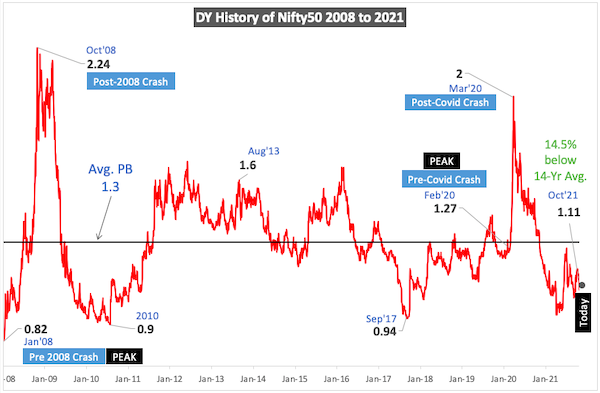
- 2008-2009: In Jan’08, the nifty was at a peak (6,200 points). At that time, the dividend yield was as low as 0.82%. From this point onwards, Nifty crashed and sunk to 2,800 levels by Oct’08. At this instant, the DY of Nifty was as high as 2.24%. It is the maximum yield the Nifty has sown in the last 14-years. This number suggests that the Nifty was most undervalued in Oct’08.
- 2020-2021: Similarly, on Mar’20, the Nifty’s DY peaked at 2.0%. It was the second time that the dividend yield of the Nifty touched this level in the last 14-years. Today, the Nifty DY is 1.11% which is much below the two peaks.
Today, nifty is trading at an all-time high of 18,000+ points. But in terms of dividend yield, it is not so overvalued. Currently, the dividend yield (DY) of Nifty-50 is at about 1.11% levels. By comparing it to the last 14-Year Average of DY-1.3%, Nifty’s current DY is down by 14.5%. So Nifty is overvalued, but the degree of overvaluation is not as extreme as the index numbers suggest.
Conclusion
The price-to-earnings ratio (PE) does suggest that Nifty is overvalued (see the 14-Yr PE trend). In Oct’21, the Nifty is trading at a PE multiple of 28.17 levels. I would wait for this PE to come down to its 14-Yr-average of about 23. For this to happen, the Nifty must undergo a correction of about 18%. If Nifty comes down by 18% from its current levels, it should be trading at 15,000 points.
In terms of price-to-book ratio (PB), Nifty looks overvalued for sure. Currently, the Nifty’s PB ratio is about 4.3 levels. It is almost 34% above the 14-Yr average. I’m not sure if Nifty will fall by 34% in the coming years, but a 15% to 20% correction can happen. So, even by PB trend analysis, Nifty trading at 15,000 will make it investible.
The current dividend yield (DY) number of Nifty is 1.11%. It is below the 14-Yr average of 1.3%. From these numbers, the Nifty is looking poised to attract investors.
I would personally wait for the Nifty to cool down a bit, at least by 10%. It will bring the Nifty close to 16,000 levels. I’ll wait till then before investing in the index.


It took 3 months for your analysis to be true somewhat. I hope you have started buying.
Hey Mani,
You were pretty right. Today is the bloodbath day.
I realised that FIIs highly follow the PE and PB ratios and Quarterly Profit margins. Hence they are pulling off.
More importantly, I would like get data for individual stocks PE and PB ratios.
>> Nifty must undergo a correction of about 18%
That’s like waiting for another pandemic to hit the world or WW3.
However, reasonable downfall in Nifty as per my feeling is about 7%. And possible triggering event is the rise of debt instruments interest rate by USA. Only thing is floating market is huge sum of liquidity from FIIs.
Once they pull out, we will see 2-3 years of mild break to rate of increase of nifty.
You are right. Hence, I concluded the article with a more realistic expectation 🙂
I am afraid that impatient newbie retail investors of India may pull out the liquidity from stock after they start seeing under performing market. I feel FIIS will jump back after Q3 results if they beat street expectation.
In any case I am going to hang on to the good stocks. And wait for stocks to fall.
Excellent analysis clearly nifty is trading in overvalued zone. If you look mid and small cap stocks lot of good companies with less debt trading below PE of 12 …What about these companies. So we have to buy or postpone the buy decision based on Nifty valuation.. your views please.
The use of PE in valuation is just a starting point. It is essential to also see the trend of EPS. Thanks for asking
I don’t think marketplace is overvalued at the moment but it’s going on the right pace. I regularly follow your blog and got to know a lot about stock market in recent months. Keep it up. Getmoneyrich is my favorite blog to follow in recent days.
Thanks for the feedback
Hi
Your analysis is bang on target except for the fact that you need to include details of PE adjustment data that happened in the NSE Website from 31 Mar due to adjustment in the method of calculation of PE.
PE for Nifty is now (After Mar’2021) is calculated based on consolidated earnings instead of standalone numbers. It can make the PE of Nifty about 5-10% lower than the previous method.
Hi Manish, firstly, thank you for such a great blog. What do you think if NSE didn’t change the calculation method {consolidated earnings instead of standalone numbers}, can we say that P/E method also would have suggested that stock-market-is-overvalued. Should we reconsider the historical averages of P/E ratio post the change by NSE.
If the calculation method was not changed, Nifty would have looked even more overvalued :).
It is always better to look at PE trend, instead of relying on only one year’s PE. Trend plus historical average gives more insight into the index’s valuation. I’ve tried to use this concept in the article.
Thanks for posing your feedback and your comment.