To assess a company’s profitability requires a nuanced understanding of financial metrics. This article is about how to measure the profitability of companies. We will learn how to tell if a company is profitable by reading its balance sheet and profit and loss accounts. Which ratios can measure and highlight the profitability aspect of the company? We’ll know about such six ratios here.
Let’s delve into the details of profitability measurement. We’ll take up both, the foundational principles and a few advanced insights. Beyond the conventional ratios, we’ll also explore key indicators that can empower us to make informed decisions.
The article will explore profitability measurement, examining not just the “what” but the “how” and “why” behind a company’s financial health.
The ratios that we’ll discuss here will highlight the ability of a company to generate profits relative to its sales and assets/capital base. The higher the ratios better the profitability. A high ratio is an indicator of the ability of a company to generate higher sales and profits.
- The Concept of Profitability Measurement
- Margin analysis
- Return analysis
- Business Profitability: A New Dimension
- Steps To Measure Profitability
- Conclusion
The Concept of Profitability Measurement: Unveiling the Depths

To truly grasp the concept of a company’s profitability, we go beyond conventional ratios. While ratios are essential, considering macroeconomic factors, industry trends, and competitive analyses provides a holistic view.
To measure the profitability of a company, we can use two types of ratios: margins and returns.
- Margins: These are financial ratios that highlight the percentage of sales/revenue getting converted into profits. One can use multiple ratios to know about the profit-making capacity of a company. Example of it is gross profit margin, operating profit margin, and net profit margin.
- Returns: These are ratios that highlight the returns a company/business is generating for its owners. To run a business, the owner sources capital and builds assets. It is interesting to know how much profit the company can generate per hundred rupees invested in it. Examples of return ratios we can use ROA, ROE, and ROCE.
Different margin ratios highlight the degree of operating efficiency of a company. They tell about the efficiency of the company in producing goods and services (gross margin) and running the overall operations (operating margin). Net profit margin highlights the ability of a company to yield profits after accounting for all types of costs including D&A, interest, and taxes.
Different return ratios highlight the resources utilized by the company to yield profits. A combination of ROA, ROE, and ROCE digs deeper into the ability of a company to generate returns.
The best use of profitability ratios is in comparison with the past numbers. This way, the ratios not only give us the quantum of profitability but also establish a trend. As an investor, we would like to see a growing trend.
Margin Analysis [Revenue, Expense, and Profit]
The margin analysis of a company scrutinizes how different categories of expenses stack up against the revenue. Margin analysis is not only about the numbers. An experienced person can also picturise the costs of a company, just by looking at the margins. How do we retail investors do a similar picturization?
I try to recall this infographic every time I see the margin ratios of a company.
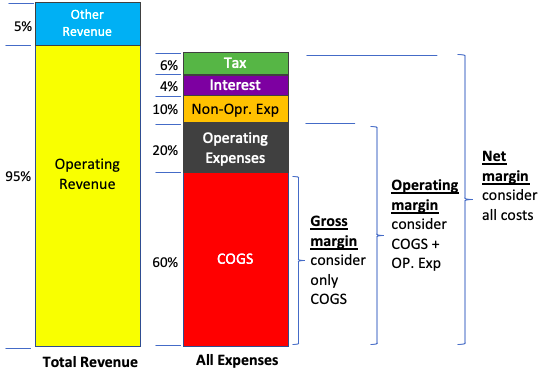
The above comparison of a company’s revenues, expenses, and margins is very effective in concluding the deeper fundamental analysis.
Generally speaking, for a manufacturing company, the distribution of expenses is shown above. Out of all the expenses, about 60% of it is used by the COGS. The next major cost head is the operating expense (20%).
A company whose COGS is 60% will display a gross margin higher than 40%.
Gross margin = (Operating Revenue – COGS) / Operating Revenue
Similarly, for a company whose operating margin is 30%, we will know that its COGS plus operating expenses will be more than 70%.
For non-manufacturing businesses like IT, Finance, and Services, among others, COGS is almost zero. Hence for such companies, the gross profit margin will show as 100%. But such a high number does not mean that the company is very profitable. The actual profitability of such companies is evident from their operating profit margins.
#1. Gross Profit Margin Ratio
It is a ratio that highlights how much gross profit the company can generate for every hundred rupees of sales. Suppose, the gross profit of a company is 30%. It means that the company is generating gross profits of Rs.30 for every Rs.100 revenue it earns from the sale of its products and services (operating income).
The formula for the gross profit margin looks like this:
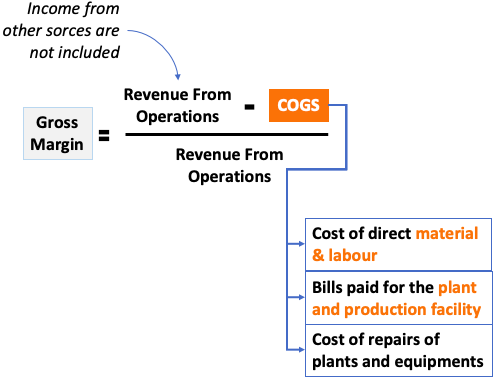
COGS is an abbreviation for the Cost of Goods Sold. It represents the total cost incurred to produce salable goods and services. As an investor, I would like to see how cost-intensive are the products for its company. Less cost-intensive products (smaller COGS) will yield a higher gross profit margin.
If a company maintains or improves its gross profit margins over time, is a strong indicator of pricing power (economic moat).
Gross Profit Margin: Beyond Numbers – The gross profit margin formula is straightforward. However, experts also consider factors like supply chain efficiency, production technology, and economies of scale. Analyzing these aspects, along with the gross margin, provides a more accurate picture of a company’s cost-effectiveness.
#2. Operating Profit Margin
Suppose a company has a manufacturing facility that it uses to produce goods for its customers. All costs that are directly accountable for the production of goods fall under the category of COGS.
But there are associated costs, though indirectly, which are essential to run the manufacturing facility. They come under the head of “operating expenses.” A few examples of operating expenses are listed below:
- Maintenance and Repairs.
- Research & Development.
- Rent
- Insurance
- Sales & Marketing.
- Office Supplies.
- Property Tax.
- Salaries & Wages of Employees (indirect labor).
- Others.
The formula for operating profit margin looks like this:
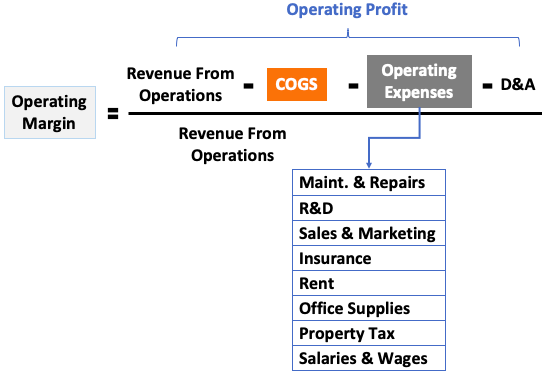
Please note that the inclusion of D&A is a must in evaluating operating margins. D&A works as a proxy for the costs associated with the upkeep of equipment/assets of the company.
Operating Profit Margin: The Hidden Operating Costs – Operating expenses are more than just numbers on a balance sheet. Expert analysis includes scrutinizing the efficiency of R&D investments and marketing strategies. The impact of technological advancements on operational costs is also necessary to analyze.
#3. Net Profit Margin
Net margin is the bottom line of a company. It displays the profitability of a company after considering all costs associated with it (all expenses).
In the calculation of net margin, all sources of income must be considered. All income includes revenue from operations and income from other sources.
The best use of net profit margin is in the calculation of EPS. However, I prefer the use of gross profit margin and operating margin over net margin. Why? Because the net margin is calculated using income from other sources. Hence it dilutes the authenticity of the displayed profitability.
On the expense head as well, some expenses are one-time or exceptional. In net margin calculation, even one-timers are included. Again I feel they are not fair indicators of a company’s profitability. Hence I hesitate in comparing it to the margins of other companies.
The formula for net profit margin looks like this:
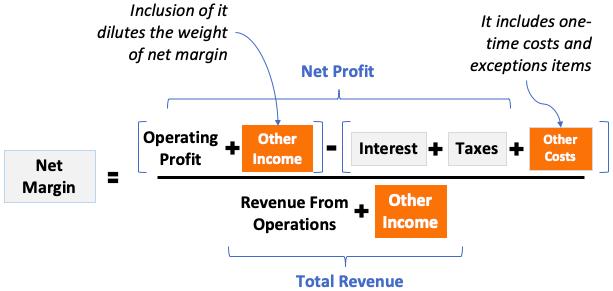
Net Profit Margin: Beyond the Bottom Line. The focus should be on the revenue from Other Income Sources. Experts will never miss this component in the net profit margin calculation. Net profit margin often includes income from diverse sources. However, experts argue that filtering out one-time or exceptional income provides a clearer representation of a company’s core profitability.
Return Analysis
In the intricate landscape of profitability measurement, return analysis serves as a compass, guiding us through the hidden layers of a company’s financial prowess. In this segment, we unravel the significance of Return on Assets (ROA), Return on Equity (ROE), and Return on Capital Employed (ROCE). Beyond mere calculations, we explore how these ratios provide profound insights into a company’s asset utilization, shareholder value creation, and overall capital efficiency. Join us in deciphering the nuanced world of return analysis, where numbers transcend into strategic indicators of sustained profitability.
#4. Return on Asset (ROA)
When the net profit is expressed as a percentage of the total asset, it is called ROA. The significance of ROA is that it highlights the ability of its assets to yield profits. A higher ROA number means better utilization of the company’s assets.
In terms of formula, ROA looks like this:
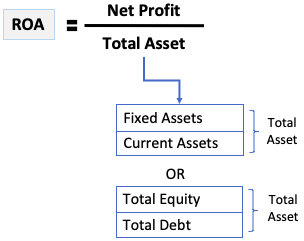
Companies sectors like steel, cement, auto, oil & gas, and banks are capital-intensive sectors. It means, that to yield every extra Rupee of net profit, they need more underlying assets. ROA of such companies is low.
Companies from service sectors like IT, NBFC’s among others, have a high ROA.
You can also read about asset turnover to get a better view of asset utilization.
ROA: A Window into Asset Utilization – While the formula remains constant, experts consider industry standards for asset turnover. Sectors like IT showcase high ROA due to low capital intensity, while steel, cement, auto sectors, etc display a low ROA. This point emphasizes the importance of sector-specific analysis. We cannot compare the ROA of one industry to the other.
#5. Return on Equity (ROE)
When the net profit is expressed as a percentage of the total equity, it is called ROE. The significance of ROA is that it highlights how profitably the company is using the owners/shareholders’ funds to yield profits. A high ROE company may not require loans from banks to manage its working capital. However, this does not mean that a high ROE company may not seek debt. If the company is in expansion mode, it will require long-term loans to feed its CAPEX demands.
In terms of formula, ROE looks like this:
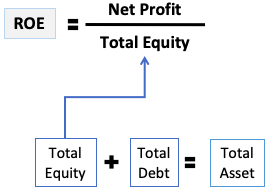
Out of the total assets, only the equity portion is compared with the profits. For stock market investors, ROE is the best ratio for comparison with peer companies.
ROE: A Holistic View of Shareholders’ Funds – Understanding a company’s capital structure is essential. High ROE may suggest profitability, but experts emphasize assessing the risk associated with debt and its impact on long-term sustainability. Read more about why high ROE alone is not always good. We must look at the other ratio along with ROE.
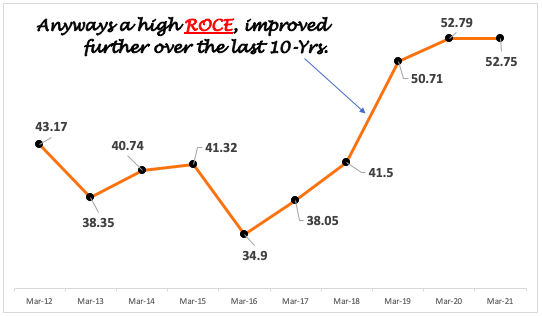
#6. Return on Capital Employed (ROCE)
ROCE is a measure of how much EBIT a company is making for every Rupee of total capital fed into the business. A positive ROCE number indicates that the business model of the company is profitable.
In terms of formula, ROCE looks like this:

A high ROCE number indicates that the company is profitable enough to pay its creditors and owners. A company with a high ROCE will also pay taxes to its government, thereby contributing to the country.
To measure the profitability of a business using only one ratio, I’ll use ROCE. For me, this ratio provides the most real measure of profitability of any business.
ROCE: A Reliable Indicator of Profitability – ROCE stands out as a comprehensive measure. Experts argue its significance lies not just in profitability but in a company’s ability to meet its financial obligations, contribute to taxes, and support growth. Read about the combination of ROCE and EPS growth rate to identify growth stocks.
Business Profitability: A New Dimension
In our exploration of business profitability, we are trying to interpret traditional metrics to unveil deeper insights that propel companies to new heights.
We’ll delve into advanced strategies like proactive cost management, revenue diversification, and leveraging technology for operational efficiency. This way we’ll expand the scope of traditional metrics.
These strategies are not merely ancillary; they are integral to understanding and enhancing a company’s overall profitability. Proactive cost management directly influences the bottom line. Revenue diversification broadens income streams. Let’s know more about them in detail.
a. Proactive Cost Management:
In proactive cost management, businesses navigate beyond conventional cost-cutting measures. Picture a manufacturing company strategically investing in state-of-the-art machinery to reduce production time and material wastage. Experts advocate for an intimate understanding of cost structures. The idea is to recognize that investing in cutting-edge technology can be a catalyst for long-term savings.
Consider a retail enterprise employing data analytics to optimize inventory levels. By dissecting consumer trends, they identify peak purchasing periods, ensuring shelves are stocked efficiently. This goes beyond the simplicity of reducing inventory. It is about aligning stock levels with actual demand, and diminishing storage costs. Eventually, it can also bolster customer satisfaction through product availability.
In the services sector, a tech company might proactively invest in employee training programs. These initiatives enhance skill sets, reducing the need for outsourcing or costly external expertise. It’s a nuanced approach to cost management – not just trimming expenses. It is like strategically investing to fortify the foundation of the business.
b. Strategic Revenue Diversification
Imagine an e-commerce giant expanding its offerings beyond its core products. By delving into market analysis, they identify complementary products or services that resonate with their existing customer base. This expansion not only broadens revenue channels but also establishes the business as a one-stop destination. This in turn will enhance customer loyalty and lifetime value.
Consider a software company exploring international markets. Instead of relying solely on software licensing, they strategically went for a subscription-based model. This shift not only ensures a steady influx of revenue but also provides customers with a more flexible and scalable solution.
c. Leveraging Technology for Operational Efficiency
Visualize a manufacturing facility incorporating automation to streamline production. By integrating robotic systems, they not only reduce manual labor costs but also enhance precision and speed in manufacturing processes. This technological integration exemplifies how advancements can revolutionize the very core of operational efficiency.
Consider a logistics company implementing data analytics to optimize supply chain management. Through real-time data insights, they forecast demand patterns, reducing excess inventory and minimizing delays. This not only cuts operational costs but also positions the company as responsive and adaptive to market fluctuations.
In the financial sector, a banking institution employs artificial intelligence (AI) algorithms for fraud detection. By analyzing patterns in transactions, AI algorithms swiftly identify anomalies, fortifying the security of financial transactions. This not only safeguards the interests of customers but also establishes trust with customers.
Steps To Measure Profitability
Measuring the profitability of a company involves several key steps, especially for beginners. Let’s break it down. Start by grasping the basic concepts of profitability. Start with simple definitions of revenue, expenses, and profit. Then, go on and understand what is profitability. It essentially means a company’s ability to generate profits from its resources. Once you know the basics, learn about the profitability ratios.
Five Steps
- Step #1. Margin Analysis: Explore margin analysis. Look at different types of profit margins. This includes gross profit margin, operating profit margin, and net profit margin. While doing this analysis remember picturising the revenue vs cost infographics.
- Step #2. Return Ratios: This step will take you deeper into profitability analysis. Dive into return ratios like ROA, ROE, and ROCE. These ratios go beyond surface-level numbers and tell you how well a company is using its assets and capital to generate profits.
- Step #3. Trend Analysis: We must also look back to get a deeper perspective of the company’s current profitability. Compare current profitability numbers with past data. Trends are crucial because they show you if a company’s profitability is growing or declining over time.
- Step #4. Comparative Analysis: Compare a company’s profitability ratios with industry benchmarks or its competitors. This helps you gauge how well it performs relative to others in the same business.
- Step #5. Consistency Check: Look for consistent profitability. A company that consistently generates profits is generally considered healthier and more reliable.
By following these five steps, we can build a solid understanding of how well the company is doing concerning the profitability of its business.
Conclusion
To ascertain if a company is truly profitable, we must move beyond standard ratios. This blog post aims to equip the readers with a nuanced understanding of profitability measurement. A combination of traditional metrics and expert analysis ensures a comprehensive evaluation.
How to tell if a company is profitable or not? At the basic level, we must open the company’s balance sheet and profit and loss account. These two reports can be used to measure the profitability of a company using margin ratios and return ratios.
In this article, we have used three types of margins: gross margin, operating margin, and net margin. We have also used three return ratios for profitability analysis: ROA, ROE, and ROCE.
A combination of high margins and high ROCE is a better indicator of a company’s profitability.
I hope you enjoyed reading the article.
Have a happy investing.
Suggested Reading:


Beutifully written document, seemly wow.
I am wondering that the complex concept of accounts and finance can be explained in such a simple and powerful way. It is self explanatory to non finance background professional.
Thank you for the feedback.
Great Information Mani, would love to connect
[email protected]
Hello Mani,
It’s a great informative article on measuring the profitability of a company. The fall of Indigo, DHFL proves that. I decided not to invest in a company that does not have good sales growth and is profitable for at least 10 quarters. Personally, I found investing in indexes may be a better option for an investor with a longer horizon, especially salaried people.
Index investing is a reliable option for passive investors.