I was thinking about a new theme to add to our stock screener. The purpose is to shortlist stocks that are investment-worthy.
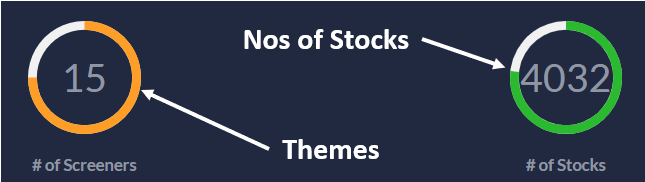
There are already 15 number stock screening themes available, to date, that can screen about 4,000 number stocks. I was thinking, what different I can offer to my subscribers through this new theme? I was not clear about it initially. Hence I decided to take the first step with this theory in mind, “Write an algorithm that will be both effective and understandable.”
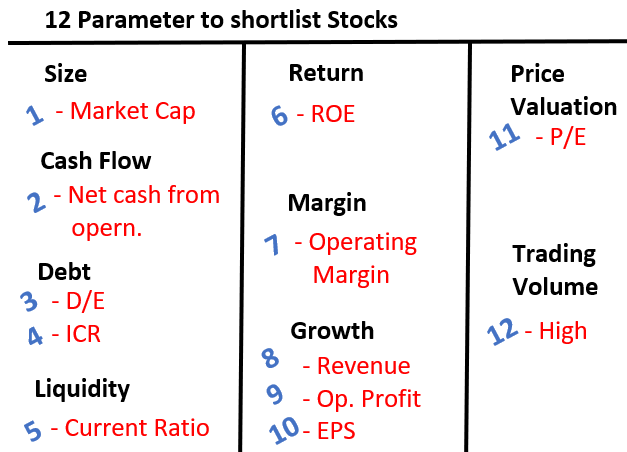
During this weekend I sat on my whiteboard and began formulating a logic. Initially, I assumed that only four to five parameters will be enough to shortlist stocks. But in the end, I could limit the parameters to only twelve (12) numbers, not less.
When I applied these parameters to 4000+ number stocks, the final outcome was about 20 number stocks.
We are working on this algorithm, and soon it will be added to our existing basket of stock screener themes (the theme is now live). The existing subscribers will see it live soon. The name of the new screener theme will be “12-Parameters.”
Allow me to explain the individual parameters I’ve used to shortlist stocks for investment.
#1 Size of the company
This is the first filter. Out of all the 4000+ companies listed in the exchange, we’ll consider only those that have a market cap of Rs.50 crore or higher. A safer filter would have been a higher market cap, like Rs.500 crore. But this way we may lose on a few potential small-cap stocks.
Having said that, it is also true that including very small companies might make out theme muddy. Hence, I’ve decided to limit the market capitalization value to Rs.50 crores.
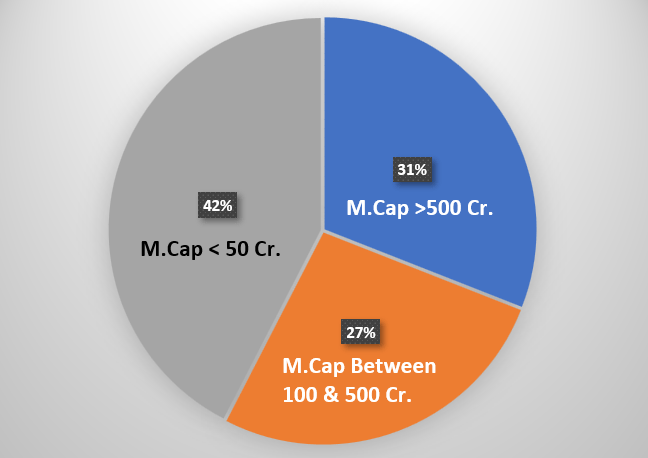
Approximately, out of all stocks listed in the BSE and NSE, about 42% of stocks have a market cap lower than Rs.50 crores. It means we are not analyzing 42% of all stocks. But I think we must live with it. Not satisfied? Please continue reading and wait for the conclusion. You’ll get a pleasant surprise.
#2. Net Cash From Operations
It is essential for companies to yield profits. But to keep alive its day-to-day operations, the company needs cash inflow. Our next filter will be related to cash flow. We’ll consider only such companies that at least generate a positive net cash flow from their operating activities. In industries, cash is king. Hence, we’ll use this concept in our stock screener theme.
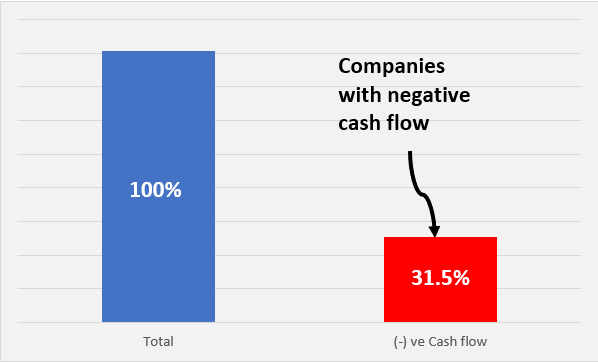
Allow me to give you some data about net cash flow from operations. Out of all companies listed in the stock market, about 31% generated a negative cash flow. A defensive retail investor may choose to stay away from such companies. Interestingly, 15% out of the 31% are such companies that have reported positive net profit (PAT) numbers.
What is the problem with negative cash flow? Such companies will have problems managing their current liabilities and working capital. They might resort to short-term debt to manage their immediate cash requirements. This will increase their interest expense, hence lowering the profitability. If they resort to equity financing, it will dilute their profits. [Note: good companies generally do not go for equity financing to manage near-term cash needs.]
#3 & 4. Quantum of Debt
Experienced investors always handle debt-laden companies with extra care. For retail investors, the easiest way to analyze the debt load of a company is through the following two ratios:
- #3. Debt-Equity (D/E): We are not aiming for debt-free companies. But we would also like to eliminate businesses resorting to high debt. One way of estimating the debt load is through comparison between the debt and equity base of a company. As per experts, a debt-equity ratio below 2.5 is acceptable. A lower value would be safer, but we would like to include reasonably fast-growing companies. Such companies may have to temporarily resort to a higher D/E ratio. Why? During an expansion phase, they may require debt financing.
- #4. Interest Coverage Ratio (ICR): No matter how prudent is a company’s D/E ratio, if it is not yielding enough profits (EBIT), it cannot pay the interest on the debt. As a rule of thumb, an Interest to EBIT ratio, called Interest Coverage Ratio (ICR), of two (2) or higher is essential.
So, a D/E and ICR limit as stated above will be used in our “12-Parameter” stock screening theme. At this step, we are screening off any potential bankrupt company.
#5. Liquidity
The solvency of a company is defined by its level of debt. But even a solvent company may face problems to manage its current liabilities (payables in the next 12 months). How it will happen? When the company runs out of cash. A company’s source of cash is its current assets. What are current assets? They are mainly payments from customers, cash & cash equivalents. A good company always maintains a balance between its current liability and current assets.
How to judge a company’s liquidity balance? It can be done through a ratio called the current ratio. It is a ratio between a company’s current assets and current liabilities. An acceptable current ratio is two (2) or higher.
We’ll use this limit to screen out non-liquid stocks.
Just for our information, only about 25% of all stocks listed on the stock exchange can pass this filter of the current ratio of more than two.
#6. Return on Equity (ROE)
I took a choice to use ROE over Return on Capital Employed (ROCE) as a measure of return for the screener. This screener theme is being built from the perspective of a shareholder. Hence, the use of ROE is more apt. ROE estimates how much net profit the company is generating from the borrowed shareholder’s funds.
It is true that it’s unfair to compare the ROE of companies operating in different sectors. For example, the ROE of a service sector is generally higher than that of a manufacturing sector. But we as an investor would not like to invest in low ROE companies. My screener theme will filter all stocks having an ROE of 10% or below.
To make the ROE analysis more complete, we’ll consider the current ROE and average ROEs of the last 3 and 5 years.
#7. Operating Profit Margin (OPM)
It is essential for a company’s operations to be profitable. A reliable measure of it is the operating margin. (not net profit margin). Why operating profit is more reliable than net profit margin? Operating profit considers only revenue emanating from the company’s operations. While net profit includes other iincomes.
Generally, the other income component is negligible as compared to the operating income. But at times, for a few companies, the other income becomes major. Though in the P&L account they are recorded as exceptional items, in the calculation of net profit it is considered. This factor makes the net profit number less reliable than the operating profit.
The screener filters out all stocks that have a negative OPM. To make this filter more reliable, I’ve considered the latest OPM and also the average of the last 5-Years.
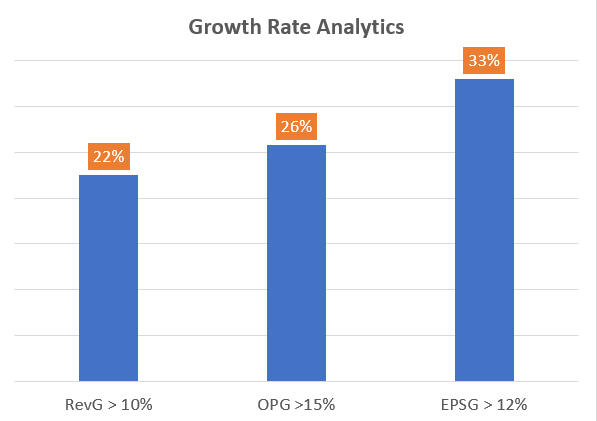
#8, 9, 10. Growth
Our screener will not be complete without the growth rate analysis. Our 12-parameter screener will use the following parameters for growth analysis:
- #8. Revenue Growth: A reasonable revenue growth is a bare minimum requirement. In this stock screener theme, we’ve considered a minimum revenue growth rate of 10%. This is our cut-off limit. All companies having a lesser growth rate number are removed from the list. The number considered for analysis is the 5-Year average revenue growth.
- #9. Operating Profit Growth: Operating profit growth is a fair indicator of the economic moat (competitive advantage) of a company. A company that can grow its operating profit at a rate of 15% per annum can be a shareholder’s delight. But of course, other factors must also be favorable. So, the limit of 15% is our next filter.
- #10. EPS Growth: From the point of view of a shareholder, EPS growth is perhaps most important. The stock market loves to see a constantly growing EPS. Hence, I’ve considered a cut-off limit of 12% per annum for a 5-Years average EPS growth rate.
Just for our understanding, out of all companies listed in the stock market, only 22% have a revenue growth rate of more than 10%. Only 26% have a more than 15% operating profit growth rate. Only 33% have an EPS growth rate of 12% or more. Note: these are all 5-Year average numbers.
#11. Price To Earnings Ratio (P/E)
The easiest and most understood price valuation ratio is PE. Even value investors have an affinity for the PE ratio.
We can understand the PE ratio as the price paid for the ownership of a company for every Rupee of its profit. The PE ratio of reliance industries is 30. It means, at this price, the investor is paying Rs.30 for every Rupee of its net profit. Similarly, TCS has a PE ratio of 36. For TCS, one is paying Rs.36 for every Rupee of its net profit.
The higher is the PE ratio, the more overvalued is the stock. Though a better indicator of price valuation is the PEG ratio, for this screener theme, we will stick with the PE ratio. I’ve kept the cut-off limit of 10. It means, any stock that has a PE ratio of 10 or higher, will be removed.
Just for our information, out of all stocks listed in the stock market, only about 15% will satisfy the PE-10 rule.
#12. Trading Volume
At the end of the day, we would not want to hold a low trading volume share. Why? Because they are not easy to buy and sell. Suppose the market is at its peak and you would like to sell your holding. Low trading volume shares will not find enough buyers. At your desired price, you may not be able to find a buyer for all of your holdings. This is the reason why along with the fundamentals, the high trading volume should also be a screening criterion.
For example, the trading volume of Sundaram-Clayton and Honeywell Automation is only 148 and 155 numbers respectively. A reasonably liquid company would have a minimum trading volume in thousands. Titan reported a trading volume of about 78,000. Bharat Forge reported a trading volume of 28,000 today. A share that has been most traded in a particular day can have a trading volume to the tune of 50,00,000 or more. These are few values to give you a perspective of what it means by high and low trading volume stocks.
Conclusion
The idea behind implementing this 12-point screener is to filter out non-investment-worthy companies. Though it is also true that a stock screener can never replace the utility of fundamental analysis. But it is also true that we cannot do a detailed analysis of all 4,000+ listed stocks. Hence, we’ve built a stock screener with multiple screening themes. It helps us to generate a shorter list of stocks that we can eventually analyze in more depth.
[Note: Does the size of a company matter while we shortlist stocks for investment? In this 12-Parameter stock screener, we kept the market capitalization’s cut-off limit of Rs.50 crore. Even if this limit was not present, the lowest market cap stock that satisfied the balance 11-Parameters has a size of Rs.187 crore. So, I would assume that, as the company grows in size, its fundamentals also improve.]


Being an engineer self , I recognize your passion to dismantle Finance the Project Way.
Your top to bottom approach on fundamentals based tech-tool analysis & updates are worth praising .
New Entrants in Small/Mid/Large caps movements as per AMFI ( half year report) will be a great value column add.
Dear Sir,
This truly is an amazing screener (the top 12) . The parameters considered to select the stocks are apt. I just have a small feedback though, in the top 12 screener should we also screen the Promoter’s behavior towards their own company ? For e.g. the first and the top bet in this screener is a stock called Godawari Power & Ispat. In this stock we are witnessing continuous Insider Selling by Multiple Board of Directors month on month right from August of 2021. Just wanted your opinion that when insider’s trust in the company is somewhat diminishing, should we consider that stock in the long term portfolio. Just a thought. Thank you
Thats really very helpful blog to get the idea of shortlist stock on investment.
I was looking for such information and i got this article its give me clarity over the investment which can be really helpful for me.
can you also share some details related to demat account so that i can get a clear view on this as well.
A very informative post thanks Mani for sharing. I have been following your articles for last 2 years and love reading it.
One reason is your way of writing so that even a novice like me can understand financial jargons.
Thanks once again, keep doing the good work.
Thank you for the awesome feedback.
Great article. Opened many windows to think. Got to sit with a book & pen for the important points to note down. Thank you so much for the useful article. Looking forwards for such posts in the future.
Regards,
A Learner
Very attractive blog, had to to read it.
Excellent insight into investing
Thanks
Really Insightful. Had to read the whole content. Impressive. Looking for more.