Our Stock Engine’s effectiveness does not come from its fancy reporting style. It comes from its underlying algorithm that makes the complicated stock analysis more interpretable for its users. Ultimately, the purpose of any stock tool is to highlight if a stock is worth investing or not. The latest update is focused completely on making our algorithm more interpretable.
The purpose of starting the Stock Engine app was to make stock interpretation easy for even a novice investor. When we first launched our web app in February 2022, It was one big feat. Today in May 2023, we have rolled out a major update. Between 2022 and 2023, we realized something very amazing. No matter how strong is the underlying algorithm, it will serve its purpose only if the users can interpret its analyzed results. Throwing only numbers and jargon at them is meaningless.
So, in this update, our focus was to make the Stock Engine an easy-to-comprehend stock tool. Though it gives no investment advice, we decided to develop this tool ‘up for it.’ With the same purpose, we launched our web app in 2022 (earlier it was in an Excel Avatar). In our latest update, we have made the critical stock parameters more comprehensible. How? This is what I’ll tell you in this article.
So let’s start with the basics of stock investing and then allow me to explain how this latest version of the Stock Engine answers those basic queries.
Introduction
Every time we think about stock investing, our purpose is to know if the stock is worth investing or not. Two things make a stock investible, the underlying fundamentals of its business and its price valuation.
The underlying fundamentals of a stock are decided by its growth, profitability, financial health, quality of management, and economic moat. The price valuation decision can be taken by comparing the stock’s fair price (intrinsic value) with its current price. The Stock Engine app tries to uncover all these critical parameters of a company (stock).
#1. Overall Impression – A Stock is Worth Investing Or Not
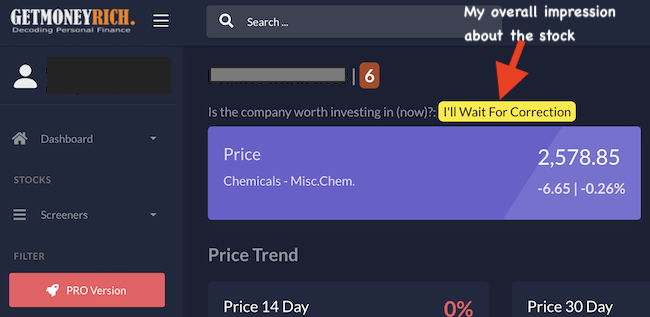
The stock’s detail page will immediately deliver my first impression of the stock. In this example, it is concluded that if I’ve to invest in this stock, I’ll wait for a correction.
If one wants to know more about what is the basis of my impression of the company, scroll down to the “Overview” section of the app.
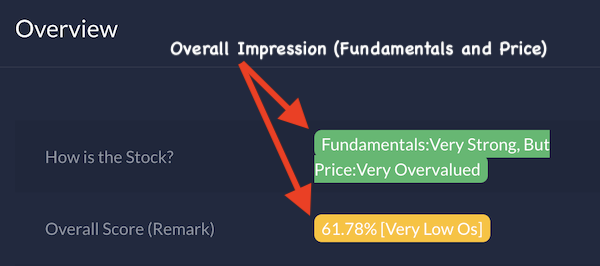
There you will see that the overall score of the stock is 61.78% (Very Low). Generally, a stock whose overall score is 75% or higher will garner a preferable overall impression.
The low overall score rating of our example stocks is because of its price being “Very Overvalued” but its Fundamentals are “Very Strong“.
It means that the Overall Score of this stock is low mainly because of its expensive price valuation. Though the business is fundamentally very strong.
Had the price of this stock been lower, it would have become investible. This is why my comment about the stocks at the beginning of the page was, I’ll wait for corrections (will not invest in this company now).
Practical Tip
Suppose the Stock Engine thinks that the fundamentals of the company are very strong, but it will wait for the price correction to buy it as its price is very overvalued. In this case, I’ll suggest the users look at the second element of the Stock Engine app, the last 14-day, 30-day, and 90-day price trends. If this trend shows that the price of the fundamentally super strong stock has already corrected by about say 15%, the stock is already trading near its buy zone.
Why it is so? Because practically, fundamentally strong stocks do not correct a lot even during major corrections. Hence, a 15% decline is indicative of a level beyond which it is already poised to bounce back.
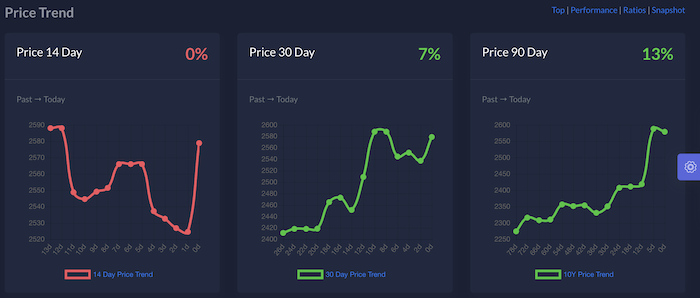
In our example company, the price correction has still not started. Hence, it is better to wait before taking the final buy call.
#2. Fundamentally Strong or Weak?
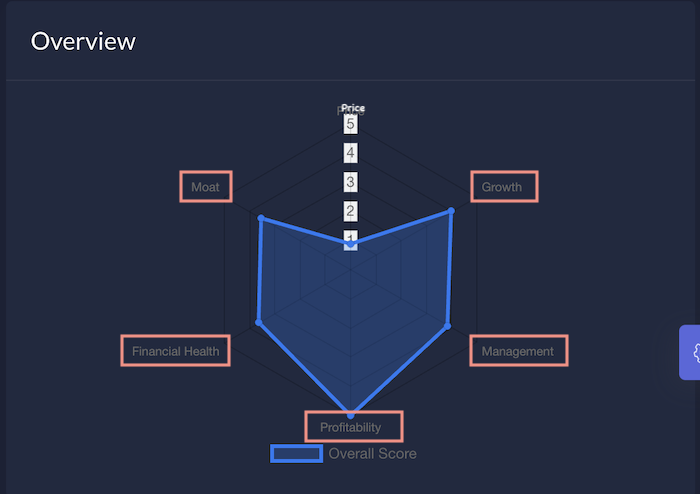
By this time, the user will already know whether the stock is fundamentally strong or weak. The Stock Engine can also quantify the degree of fundamental strength possessed by a stock. It rates it in a scale of zero to five. Our example company has earned a fundamental strength score of 4.07.

There are five parameters based on which the Stock Engine evaluates the fundamental strength of a company (stock). The five parameters are growth, profitability, financial health, quality of management, and economic moat (competitive advantage).
To know how much the company has scored on each of these parameters, it is displayed on the Spider Diagram. In this diagram, the company is rated, for fundamentals, on a scale of 1 to 5 on each of these five parameters of business. Hover your cursor, in the app, on the spider diagram and it will show the ratings.
#3. Price Valuation
By this stage, the user of the app is also aware of the price valuation of the stock. Like in our example stock, though its fundamentals were very strong, the price was very overvalued.
To get a deeper perspective on the price valuation aspect of the company, the users can scroll down in the app to the ‘Price Valuation’ section.
Again, the price valuation parameter of the stock is also quantified in two ways by the Stock Engine. First, it estimates the company’s (stock’s) intrinsic value. Second, it quantifies the price valuation factor on a scale of one to five. This kind of scaling highlights the degree of under or overvaluation.
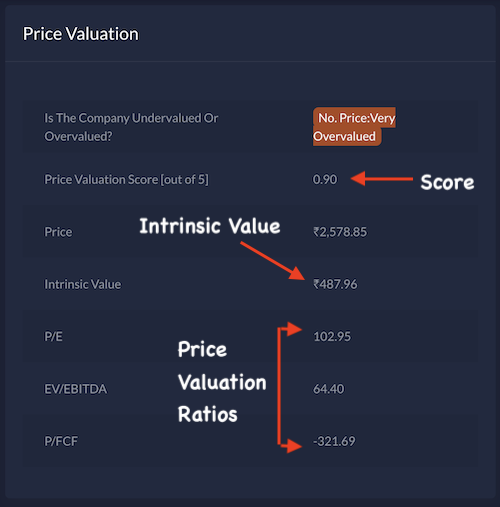
Our example company has earned a price valuation rating of 0.9 on a scale of 5. Hence, it is tagged as very overvalued. Compare its estimated intrinsic value (Rs. 487) with its current price (Rs. 2,578). You can see, the current price is almost 5 times its intrinsic value.
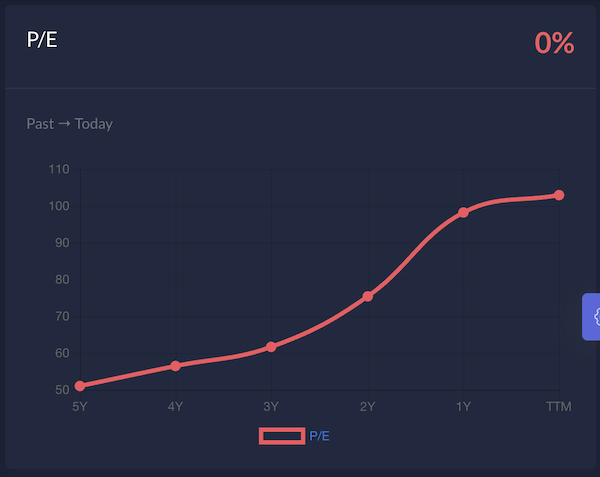
To get a more visual perspective of the price valuation aspect of the company, the app also provides a P/E chart. A rapidly rising P/E chart is an indicator of both, growth and possible overvaluation.
#4. Profitability
One of the essential ingredients that make a company earn the tag of being fundamentally strong is its profitability. Our example company has already been tagged as fundamentally very strong. But let’s check how it fares in the profitability scores.
We need to just scroll down the page to the profitability section.

The first line itself will declare in plain text if the company is a profitable company or not. Our example company is “very profitable.”
The example company has earned a profitability score of 5 out of 5. This excellent rating is coming from the fact that its ROCE (Return on Capital Employed) is almost twice its WACC (Weighted Average Cost of Capital). Such companies are great value creators in the long term.
Other aspects of profitability are also checked before allocating the final score. Some key parameters that are checked are free cash flow, operating profit, and net profit (PAT).
#5. Growth
For a company to be tagged as fundamentally strong, it must first be profitable and also growing. Hence, the Stock Engine app evaluates the growth aspect of the stock carefully. Why carefully? Because when we see the past numbers, there are chances of overestimation. Similarly, a weak past must not weigh too much on the growth score. Hence, a variety of parameters are used to quantify the growth score. One such parameter is the sustainable growth score (SGR) and self-financeable growth (SFG).
To know about the growth score, scroll down in the app to the growth section.
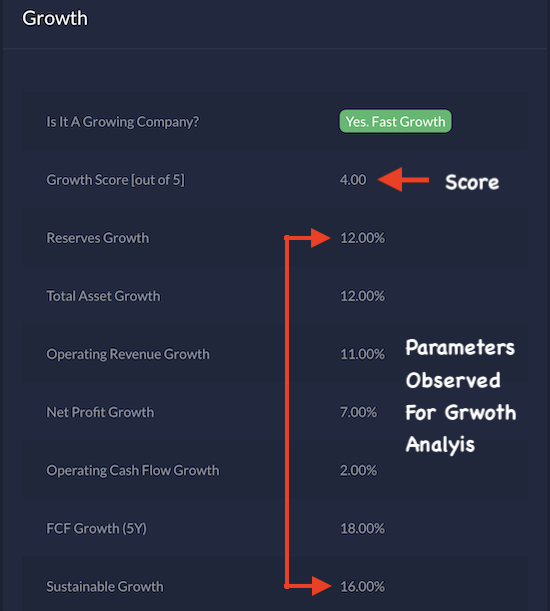
The first line declares in plain text the status of the company with respect to its growth prospects. Our example company is “Fast Growing.” In the next line, the users can see the growth score. Our example company has earned a score of four out of five.
The score is allotted by inspecting the past numbers for reserves, operating revenue, profit, and cash flows. The algorithm of the app also used the factors like SGR and SFG to estimate the growth prospects of the company.
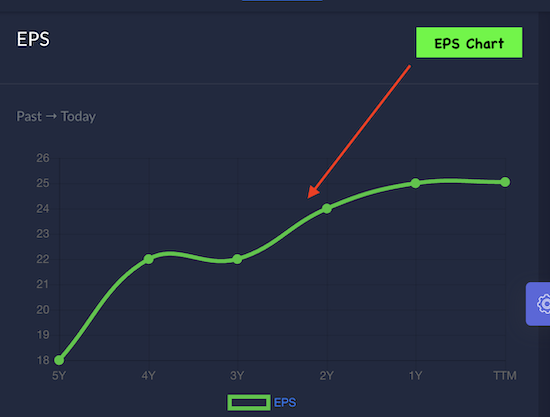
To give an idea of how all the fundamentals of the company are ultimately working to enhance the EPS of the stock, a chart shows the trend.
#6. Financial Health
Judging the overall financial health of a company is slightly more complicated than profitability and growth analysis. Hence, we decided to present the conclusions in plain text instead of throwing numbers or values at the users. The idea is to make users know, in an easy-to-understand way, in which areas the company is showing signs of good and poor health.
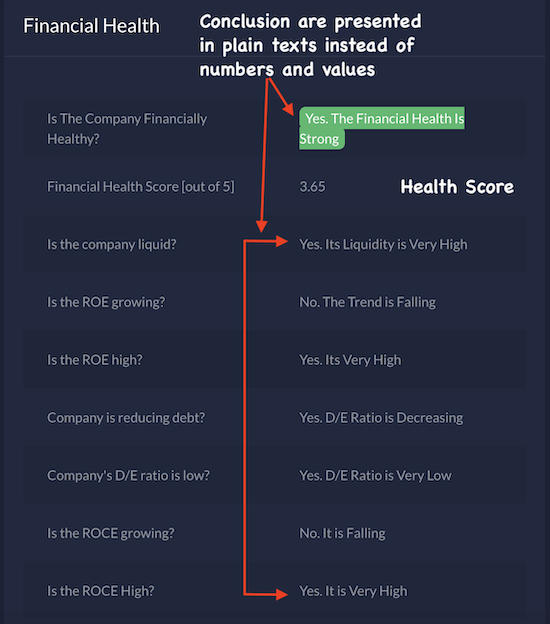
In the first line itself, the users will see a text declaration that highlights if the company is financially healthy or not. In the next line there will be the financial health score. Our example company has earned a health score of 3.65 out of five. Hence, the algorithm calls it as “strong” and not “very strong”.
The reason for a slightly lower rating can be found in the underlying parameters that build the health score.
- Liquidity Analysis: Our example company was found to be sufficiently liquid. This analysis is done based on the current ratio, quick ratio, and cash ratio.
- ROE Analysis: The ROE analysis is done by scrutinizing the absolute ROE number and its trend analysis. Our example company has a high ROE but it was not growing.
- Debt Analysis: High debt makes a company risky. Hence, the debt analysis is done based on the debt-equity ratio, interest coverage ratio, debt vs cash analysis, etc. Our example company not only had low debt but was also reducing it over time.
- ROCE: A company with a high return on employed capital is a healthy company. But here again, the user must also see the trend of ROCE. Though our example company has a high ROCE, over time, the ROCE is falling.
So there are a few reasons that made our example company financially strong but not super strong.
#7. Quality of Management
To judge the quality of the management of a company, the best way is to know who constitutes the board of directors and top managers. But unfortunately, as a small investment enthusiast, I do not have that access. Hence, I followed the bottom-up approach.
I asked myself, what are the performance indicators that highlight the quality of management? I found some and then I tried to quantify them for analysis and comparison.
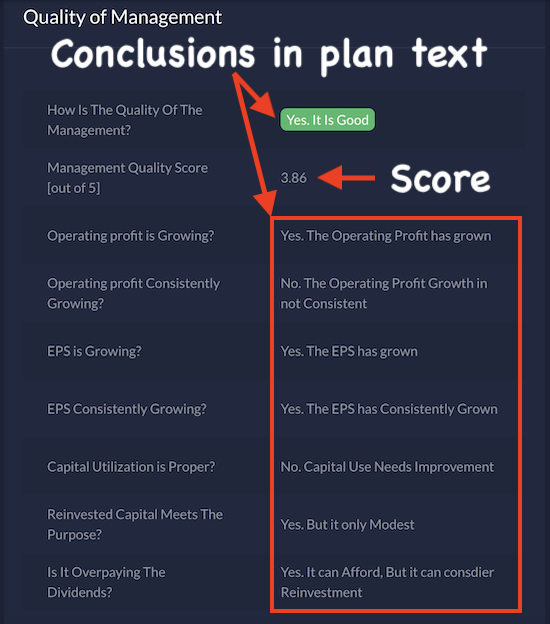
Here again, instead of throwing jargon at the users, the conclusions are written in plain text.
In the first line itself, the user will know if the quality of management is Good or not. Our example company’s management attained a tag of “Good”. It attained a quality score of 3.86 out of five.
The management’s quality analysis is done based on the following parameters:
Parameters
- Operating Profit: One of the tasks of the management is to keep growing the operating profit of the company consistently with time. Our example company’s operating profit was growing, but it has seen dips in between.
- EPS: EPS is a parameter that the shareholders (investors) follow very closely. Hence, for me, the management that keeps diluting the EPS should earn a low score. Our example company has seen consistent growth in EPS over the last few years.
- Capital Utilization: When a company raises capital from investors in an IPO or from bonds etc, they do it with a purpose. The most common reason for capital raise is expansion and modernization. Again, when the company retains profits, it again does it for the same reasons and also for working capital management. The Stock Engine app checks if the capital raised by the company from its debtors and investors is meeting the purpose. Our example company scored only fair in this aspect.
- Dividend: Dividend payment to shareholders is important. But if the management is just overdoing it, it is not quality governance. Hence, the Stock Engine app checks if the management is misleading the shareholders (about its cash position) by paying excessive dividends. Our example company can afford to pay the dividends it has paid in the past.
#8. Economic Moat
The Stock Engine app does a close analysis of the company’s economic moat (competitive advantage). But it is also true that judging a company for its moat only on the basis of the numbers it reports is not foolproof. Hence, I will accept that out of all the other algorithms, this one still needs a lot of work. Though I’m confident that the score that it is rendering now for the company is close to reality.
To know the company’s moat score and conclusion, one needs to scroll down to the Moat section of the app.
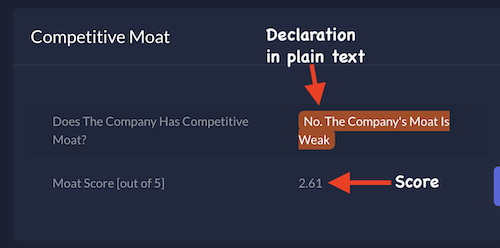
Our example company earned a low moat score of 2.61 out of five. This is probably because there are other strong competitors operating in the same industry. Sometimes, a low moat score is also possible if the company does not have enough pricing power.
To make the moat of a company more visibly evident to the users, like other apps, the Stock Engine also presents it in a tabulated format. It makes the comparison easier. Moreover, in this one view, the users can compare the “Overall Score” of the best companies in the industry in one view.
Conclusion
As a user, suppose you are using Yahoo Finance to know about Reliance Industries. How easy it is to draw conclusions about the company using this app? I’m sure, a majority will tag it as non-conclusive. Though I’ll admit that the way the data of companies are presented in that app is impressive (especially its cash flow report). Then why do I say that is non-conclusive? Because it works just as a tool that reports the financial numbers of companies in a nice way.
It does calculations of a few key financial ratios. But can a beginner or a novice investor can draw conclusions from it? I believe the answer will be ‘no.’
This is where the Stock Engine app becomes useful. Though there is a clear disclaimer in its footer that says that the domain offers no investment advice, but its utility is evident.

People can use the app to build a first impression about a company. Then, they can do their own research or approach their financial advisor to make the final buy or sell call.
The thing that makes this updated version of the Stock Engine more useful is its ability to enable its user to draw more inferences from its analysis.
There are hundreds of lines of code and logics that are used to compute the intrinsic value, overall score, other scores, and financial ratios. But they will have zero utility if the user of the app cannot interpret those numbers. We’ve developed this app with this objectivity in mind.
“Simplicity is the ultimate sophistication.”
– Leonardo da Vinci

![Stock Investment For Beginners – A Detail Guide [India]](https://ourwealthinsights.com/wp-content/uploads/2010/11/Stock-Investment-for-Beginners-image.png)