
This is an attempt to do a quick fundamental analysis of Expleo Solutions. The purpose of this article is to get an idea about what is a fair price (Intrinsic value) of the company’s shares. Currently, the stock price of Expleo Solutions is trading at approximately Rs.1,400 per share.
Recently someone close to me brought this company to my attention. The person heard in the TV news channels and on YouTube that the Indian IT sector is currently facing some headwinds. Hence, it is underperforming.
The proof of the underperformance is very visible when we compare the Nifty IT index with other indices of the Indian stock market. In the last 12 months period, the Nifty IT index has gone up by 6.89%. It is even weaker than the performance of the broader index Nifty50 (up by 10.41%) and the S&P BSE Large Cap index (up by 7.49%). In the same period, the Midcap and Smallcap Indices have gone up by 25% and 28% respectively.
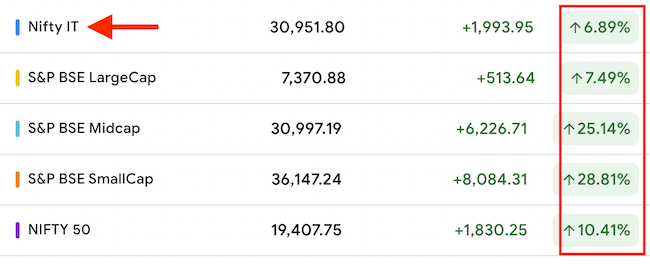
Hence, there is no doubt that the IT sector is not performing as well as other sectors.
#1. Stock Performance of Expleo Solutions
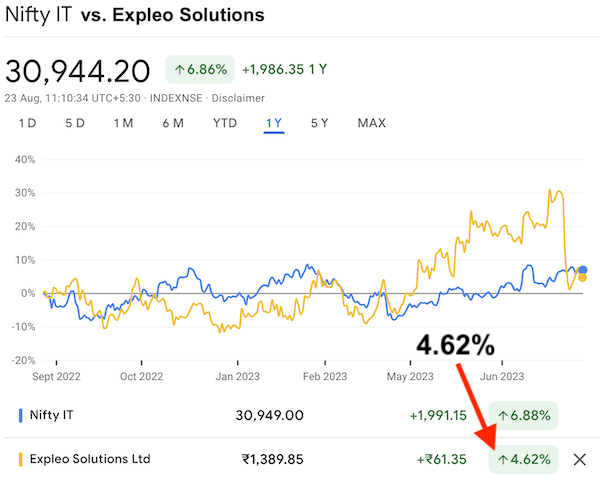
We’ve already established that IT sector is not performing like other sectors. Within the IT sector, the performance of the stock of Expleo Solutions is even not at par.
In the last 12 months, when the Nifty IT index has gone up by 6.88%, Expleo’s stock has gone up by only 4.62%.
Moreover, the person who approached me, digged some more into the company. He found that, in the last 10 years, the performance of the stock of Expleo has been quite good. He came to me with this data:
| Price Trend | Growth (CAGR) | Remarks |
| 3 Months | -12.98% | Sudden Fall in Aug’23 |
| 3 Years | 33.61% | COVID Crash Effect |
| 5 Years | 21.39% | – |
| 10 Years | 16.22% | – |
In the last three, five and ten years, the stock price has grown at a rate of 33.61%, 21.39%, and 16.22% per annum respectively. Also, the in the last 3 months, the share price has corrected by about 13%.
So the person approached me with the query, What is the right time to start accumulating Expleo Solutions? The person was interested to buy and hold this stock for the long term (over 5 years).
Hence, I decided to do a quick fundamental analysis of this company.
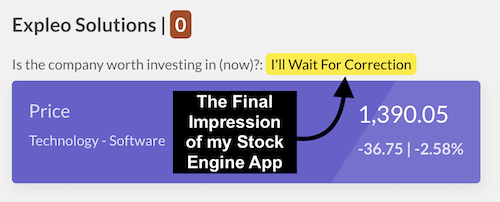
#2. A Quick Check
I did a quick check of the company on my Stock Engine App. My app’s algorithm wants to wait for a correction before buying the stock. It is an indication that the algorithm thinks that the company’s fundamentals are good but its price is overvalued. The stock engine estimates that the current price is about 2.5 times the fair price, which makes it very overvalued.
The other quick indicators (ratings on a scale of 0 to 5) from my stock engine gave these values:
| Parameters | Scores |
| Price valuation | 0.5 / 5 |
| Profitability | 5 / 5 |
| Growth | 5 / 5 |
| Financial Health | 3.59 / 5 |
| Quality of Management | 3.67 / 5 |
| Moat Score | 3 / 5 |
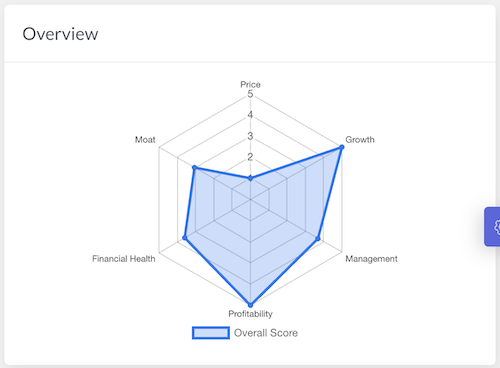
Seeing these values, the Stock Engine’s algorithm has given this company an overall score of 62%. An ideal overall score for any stock is 75% minimum. But the overall score of Expleo is not too low, I decided to do a manual fundamental analysis of it.
I’ll do a quick check on the business model and then re-verify its intrinsic value. Before buying any stocks, I do a quick manual calculation of the intrinsic value of my stocks.
#3. Business Model of Expleo Solutions
Expleo Solutions is a leading player in the global IT and consulting services domain. Its business model encompasses a range of products and services, catering to a wide customer base. We’ll delve into the details of their business model, highlighting their offerings, customer segments, and competition.
Products and Services:
Expleo Solutions offers a portfolio of services aimed at driving digital transformation and innovation for businesses across various industries. Their services can be broadly categorized as follows:
- IT Consulting and Solutions: It specializes in providing end-to-end IT consulting and solutions. The solution includes software development, application modernization, and technology implementation. This includes technologies like artificial intelligence (AI), machine learning (ML), and blockchain.
- Quality Assurance and Testing: The company is also a player in quality assurance and testing services. They ensure the reliability and functionality of software applications through testing processes.
- Digital Transformation: Expleo Solutions facilitates digital transformation journeys for businesses. This includes implementing cloud solutions, data analytics, and automation to enhance operational efficiency.
- Engineering Services: The company provides engineering services across various domains, including aerospace, automotive, and manufacturing. These services encompass product design, prototyping, and validation. A few examples of product designing includes ADAS camera system development, providing RAMS-cybersecurity support, etc,
Competitors
In a competitive landscape, Expleo Solutions faces competition from various players in the IT services and consulting sector. While the specific competitors may vary based on the region and industry, some notable contenders include well-established companies offering similar services. Expleo Solutions faces competition from several prominent companies in the IT services and consulting sector.
- Tata Consultancy Services (TCS)
- Infosys
- Wipro
- HCL Technologies
- Tech Mahindra
- Cognizant
- LTI Mindtree
These companies, along with others in the industry, compete with Expleo Solutions in delivering IT solutions and services to clients in India and beyond.
#4. Intrinsic Value of Expleo Solutions
We’ll use the DCF method of intrinsic value estimation to do the calculations. But before that, allow me to share key financial data (last 10 years change) which most of us follow for our stocks.
| Description | YR 2023 | YR 2014 | Growth (CAGR) |
| Revenue | 903.3 | 194.4 | 16.60% |
| EBITDA | 216.2 | 49.9 | 15.79% |
| EPS | 86.3 | 28.7 | 11.64% |
| Networth | 530.2 | 108.2 | 17.23% |
| Working Capital | 385.1 | 86.7 | 16.08% |
| Cash & Eqiv. | 155.7 | 50.2 | 11.98% |
| Share Price | 1400 | 460 | 11.77% |
Looking at the last 10-year growth numbers of the company, it would be safe to assume that the company will at least grow at a rate of 12% per annum for the next 3 years at least.
With this as our premise and first impression, let’s get into the Discounted Cash Flow (DCF) calculation.
#4.1. Free Cash Flow [From Cash Flow Report]
Free Cash Flow To Firm (FCFF)
Based on the cash flow report of the last two financial years of the company, the free cash flow to firm (FCFF) comes out to be as shown in the below table. All Values are in Rs. Crores.
| Description | FY 2023 | FY 2014 |
| Net Profit (PAT) | 133.89 | 67.68 |
| Net Cash From Operations | 23.08 | 24.23 |
| Note: Operating Cash Flow as % of PAT | 17.2% | 35.8% |
| Capex | 44.20 | 25.43 |
| Free Cash Flow To Firm (FCFF) * | -21.12 | -1.20 |
At the outset I would like to point out that, out of the net profit (PAT) reported for FY 2023 and 2024, the net cash flow from operations was 17.2% and 35.8% of the PAT. These two numbers have a strong hint towards weak account receivables on the part of a company. The company was not able to collect the due payments fast enough from its customers.
Generally, I would have discounted the “net cash from operations” for companies showing such weak account receivables turnaround. But as the net free cash flow is already coming in negative, I’ll skip the discounting.
Though the cash flow of the company is weak, the company is still investing in CAPEX to grow the company. As the company is nearly debt free, hence I’m assuming that the cash for the CAPEX is coming from the cash & cash equivalent reserves of the company. In the last two FYs, the cash position of the company has remained strong:
| Description | FY 2023 (Rs.Cr.) | FY 2022 (Rs.Cr.) |
| Cash & Cash Equiv. | 152.531 | 173.08 |
Free Cash Flow To Equity (FCFE)
The estimation of the Intrinsic value of a company, which we can compare with the current stock price, is derived from FCFE and not FCFF.
FCFE = FCFF – Net New Debt – Interest * (1 – Tax Rate)
Let’s calculate the Net new debt first.
| Description | FY 2023 (Rs.Cr.) | FY 2022 (Rs.Cr.) |
| New Debt | 0 | 0.457 |
| Debt Repaid | 0.064 | 0.067 |
| Net New Debt | -0.064 | 0.39 |
Next, we’ll take into account the effect of interest on the income tax paid (effective tax rate).
| Description | FY 2023 (Rs.Cr.) | FY 2022 (Rs.Cr.) |
| Interest | 2.256 | 1.212 |
| Total Tax Paid | 52.218 | 42.428 |
| Profit Before Tax (PBT) | 186.1 | 110.1 |
| Eff. Tax Rate | 28.06% | 38.54% |
Now, let’s calculate the Free Cash Flow To Equity (FFCFE)
| Description | FY 2023 (Rs.Cr.) | FY 2022 (Rs.Cr.) |
| FCFF | -21.12 | -1.20 |
| Net New Debt | -0.06 | 0.39 |
| Interest | 2.26 | 1.21 |
| Eff. Tax Rate | 0.28 | 0.39 |
| FCFE | -22.67 | -2.33 |
As the calculated Free Cash Flow To Equity (FCFE) is coming in negative for the company, we’ll not proceed further with the calculations. We’ll assume that, based on cash in the cash flow report’s numbers, the estimated intrinsic value is zero.
But we are not leaving the matter here, we will do the estimation by calculating the free cash flow using the company’s profit and loss accounts.
#4.2. Free Cash Flow [P&L Account]
4.2.1 Estimating Free Cash Flow To Firm (FCFF)
There is another formula to calculate the free cash flow generated by a company. This formula is specifically useful for such companies whose cash collection cycles are generally delayed. Expleo Solutions being a company from the IT service sector, should have shown a stronger cash flow report. But anyway, for the moment we’ll live with it.
The formula for FCFF using a P&L account looks like this:
FCFF = PAT + D&A – Capex – Increase in Working Capital
For the FCFF calculation, most of the data is directly available in the company P&L account, and cash flow report.
| Description | FY 2023 (Rs.Cr.) | FY 2022 (Rs.Cr.) | Remarks |
| PAT | 133.89 | 67.68 | P&L Account |
| Depreciation | 27.884 | 18.764 | P&L Account |
| Capex | 44.20 | 25.43 | Cash Flow Report |
But to get to the value of Increase in Working Capital, we’ll have to do a few calculations:
| Description | FY 2023 (Rs.Cr.) | FY 2022 (Rs.Cr.) | Remarks |
| Current Assets | 552.7 | 448.5 | Balance Sheet |
| Current Liability | 167.73 | 174.591 | Balance Sheet |
| Working Capital | 384.97 | 273.909 | – |
| Increase in Working Capital | 111.061 | – | – |
Let’s use the above data to estimate the Free Cash Flow to Firm (FCFF) of Expleo Solutions. It is a point worth highlighting that though the company’s “net cash flow from operations” was not strong, its current asset and cash base are robust. This is the reason why, the company is likely to perform well even if its cash flow is not as strong (because of the available cash).
Let’s use this formula to estimate FCFF:
FCFF = PAT + D&A – Capex – Increase in Working Capital
| Description | FY 2023 (Rs.Cr.) |
| PAT | 133.89 |
| Depreciation | 27.884 |
| Capex | 44.20 |
| Increase in Working Capital | 111.061 |
| FCFF | 6.52 |
4.2.2 Estimating Free Cash Flow To Equity (FCFE)
We’ll use this formula to estimate FCFE
FCFE = FCFF + New Debt – Interest * (1-Tax Rate)
| Description | FY 2023 (Rs.Cr.) |
| FCFF | 6.52 |
| Net New Debt | -0.06 |
| Interest | 2.26 |
| Eff. Tax Rate | 28.06% |
| FCFE | 4.96 |
So, we can see that using this method, we are able to see a positive free cash flow (FCFE). Now, we can use this positive value to estimate the intrinsic value of the company.
But to do that, we will have to first assume a free cash flow growth number for the next 3 years. We’ve already observed the past number and have taken an informed guess of 12% per annum.
But we’ll use another method to estimate the free cash flow growth rate.
4.2.3 Sustainable Growth Rate (SGR)
Based on the return generated by the company from its equity capital, we can estimate a future growth rate for the company’s free cash flows. If you want to know more about the concept on which the SGR is based, read this article.
In short, the concept says that ROE is the rate at which the company can grow its FCF in times to come (near term). But if the company is paying dividends, it means, it is not retaining all its net profits. Hence, the ROE factor (PAT / Net Worth) must be adjusted for the dividend payouts of the company.
For companies, that do not pay dividends, their SGR will be equal to their ROE.
The formula of SGR looks like this:
SGR = ROE * (1 – Dividend Payout Ratio)
Let’s first calculate the ROE and Dividend payout ratio of the company:
| Description | FY 2023 (Rs.Cr.) | FY 2022 (Rs.Cr.) |
| PAT | 133.88 | 67.678 |
| Networth | 530.2 | 394.578 |
| ROE | 25.25% | 17.15% |
| Dividend / Share | 5 | 0 |
| No of Shares (Crore) | 1.552 | 1.552 |
| Dividend Paid | 7.76 | 0 |
| Dividend Payout | 5.8% | 0.00% |
The company’s dividend payout ratio in FY 2023 is 5.8%. But in FY 2022, it paid no dividends. In the last 10 years, the company has been known for paying very high dividend payouts to its shareholders. In the past years, its payout ratio has been in the range of 30% to 110%.
Last 10-Year Data
| Description | 2023 | 2022 | 2021 | 2020 | 2019 | 2018 | 2017 | 2016 | 2015 | 2014 |
| PAT | 133.9 | 67.7 | 50.4 | 39.9 | 36.2 | 31.9 | 23.2 | 36.9 | 21.6 | 30 |
| Div / Share | 5 | 0 | 0 | 0 | 0 | 24 | 24 | 24 | 25 | 9 |
| No of Shares (Cr) | 1.552 | 1.552 | 1.0252 | 1.0252 | 1.0713 | 1.071 | 1.068 | 1.0639 | 1.0545 | 1.0268 |
| Dividend | 7.76 | 0 | 0 | 0 | 0 | 25.704 | 25.632 | 25.5336 | 26.3625 | 9.2412 |
| Payout (%) | 5.8% | 0.0% | 0.0% | 0.0% | 0.0% | 80.6% | 110.5% | 69.2% | 122.0% | 30.8% |
But I’m making a guess that going forward from the year 2023, being a growing company, it will not exceed the dividend payout by more than 15%.
Now, let’s calculate the SGR for the company:
SGR = ROE * (1 – Dividend Payout Ratio)
SGR = 25.25% * (1 – 15%) = 21.46%
As per the past growth numbers, a safe growth rate we’ve assumed as 12% per annum. As per SGR, the future growth rate is coming out as 21.46%.
Hence, we’ll assume an average of the two numbers, which is 16.73% [=(12+21.46)/2] = 17%.
4.2.4 Future Free Cash Flows (FCFs)
We’ve already calculated the current year’s Free Cash Flow to Equity (FCFE) of Expleo Solutions as Rs. 4.97 Crore. We’ve also estimated the FCF growth for the next three years as 17% per annum.
The future FCFEs of the company will be as shown in the formula:
- FCFE1 = Current Year FCFE * (1+Growth Rate)^1
- FCFE2 = Current Year FCFE * (1+Growth Rate)^2
- FCFE3 = Current Year FCFE * (1+Growth Rate)^3
| FCF Growth Rate | 17% Per Annum |
| FCFE (Current year) | Rs. 4.97 Cr. |
| FCFE1 (One Year After) | Rs. 5.81 Cr. |
| FCFE2 (Two Years After) | Rs. 6.80 Cr. |
| FCFE3 (Three Years After) | Rs. 7.96 Cr. |
| Terminal Value (After The 3rd year) | Rs. 429 Cr. |
The Terminal Value (TV) can be calculated by using this formula:
- TV = FCFE3 * (1+g) / (WACC – g)
- g = 6.5% (FCFE growth rate of the company beyond the 3rd Year)
- WACC = 10% (Weighted Average Cost of Capital)
Terminal Value = 7.96 * (1+8%) / (10%-8%) = Rs. 429 Crore.
4.2.5 Present Value (PV) of Future FCFs
| Year | Free Cash Flow | Rs. Cr. | Discount Rate | PV (Rs. Cr.) |
| 0 | FCFE (Current year) | 4.97 | – | – |
| 1 | FCFE1 (One Year After) | 5.81 | 6.50% | 5.46 |
| 2 | FCFE2 (Two Years After) | 6.80 | 6.50% | 6.00 |
| 3 | FCFE3 (Three Years After) | 7.96 | 6.50% | 6.70 |
| 4 | Terminal Value | 429 | 6.50% | 335 |
| – | The Sum of The Present Value | – | – | 352 |
4.2.6 Intrinsic Value
The intrinsic value of the company can now be calculated from the sum of the present values (PVs) of future cash flows of the company. To calculate it, we can use the below formula:
Intrinsic Value = Sum of All Future FCFs / No of Shares
For Expleo Solutions, we have already seen that the number of shares outstanding is 1.552 Crore Number.
Hence, the intrinsic value is:
| The Sum of Present Values (Rs. Cr) | 352.173 |
| No of Shares (crore) | 1.552 |
| Intrinsic Value (Rs. / Share) | 226.916 |
Conclusion
When I started analyzing the company, the first impression I got about it was good. But slowly, when I started to get into its cash flow reports, the positive impression began to fade.
As the company is not able to generate enough free cash flow, its intrinsic value is coming out as too low compared to its current price.
- Current Price = Rs. 1400 / Share
- Intrinsic Value = Rs. 227 / Share
Using the DCF Method, the stocks of Expleo Solutions look extremely overvalued. The current stock price is at least 6 times its estimated intrinsic value.
But if I see the P/E ratio of the company in the last 5 years, the company does not look as overvalued. A fair PE of 15 looks acceptable for Expleo.
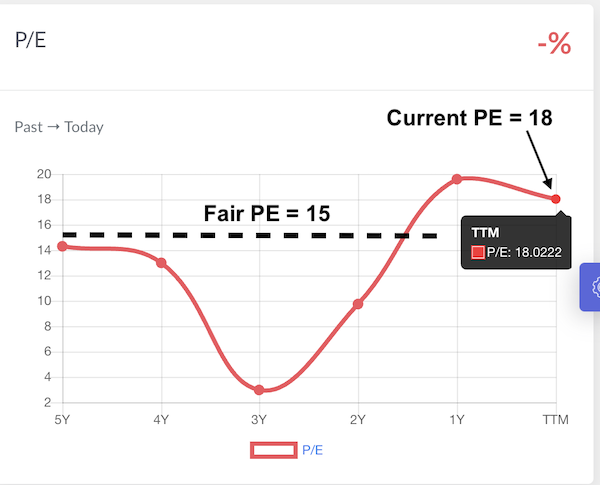
Hence, at the current EPS of Rs. 61.72 per share, the fair price of the company’s stocks will be Rs. 925 per share ( = 61.72 x 15).
Taking a rough average of the Intrinsic value calculated using the DCF and Fair PE method, I assume that the intrinsic value of the company falls somewhere between Rs.500 and 600 per share.
Even then the share price of Expleo Solutions looks very overvalued (almost 2 to 2.5 times its intrinsic value).
Hence, I proposed to my friend to look elsewhere in the IT sector. There are a few quality stocks in this sector. Next, I’ll be analyzing another IT sector stock that is fundamentally a powerhouse.
When we’ll compare that stock with Expleo, we’ll know how weak or strong is this company.
Have a happy investing.
If you find it difficult to do a fundamental analysis of companies like done here, you can subscribe to our Stock Engine. It can analyze stock with the click of a button.
Suggested Reading:


Nice blog, Manish. Discovered it accidentally, while studying Expleo Solutions. But , did you consider one point – Why do you think the promoter hiked it’s share in a big way last quarter? How will that fact affect your assessment? Eager to know. I too was a core techie, who got into Technical analysis, but late in life ( at 58). So, am a beginner in investing.
Hello, Thanks for the feedback.
The reason for the stake increase has not been in the news.
They may believe that the company has a bright future and that its shares are undervalued.
But I’m unable to see through their buy decision.
As per my estimation, there are better IT stocks in the market than this.
Thanks again and keep reading.