Last week we did a fundamental analysis of a small-cap Indian IT sector company called Expleo Solutions. While doing the analysis, the thought of doing the analysis of an IT sector heavyweight came to mind. Infosys was intentionally picked between it and TCS as it looked better valued in terms of PE ratio.
Moreover, while analyzing Expleo Solutions, its weak net cash flow raised doubt about the quality of cash flows of all IT-service sector stocks. Hence, this analysis is also aimed at establishing the quality of cash flow generated by quality companies in this industry.
The IT sector has been facing some headwinds since the last year or so. It is a reasonable time for long-term investors to accumulate strong stocks in this sector. TCS and Infosys being the market leader become an automatic pick. But these companies have become very large in size. Unless these stocks are accumulated at a sufficient undervaluation, capital growth may not even beat the index.
The purpose of this article is to first estimate the intrinsic value of Infosys. Then we’ll also look at the technicals and establish a possible buy level in case the market corrects in the next weeks.
Business Model of Infosys
Infosys is a global leader in digital services and consulting. It offers investors an exciting opportunity to participate in the evolving landscape of tech space.
Infosys stands out as a good partner for enterprises worldwide. It delivers digital solutions and transformative technology services. Investing in Infosys offers a promising outlook for several reasons:
- Digital Transformation Demand: As companies across industries race towards digital transformation, Infosys is to play a pivotal role. The increasing reliance on technology, automation, and data-driven decision-making creates a significant market for Infosys’ expertise.
- Global Expansion: Infosys’ global presence provides a strong advantage. With a customer base spread across the world, the company’s ability to tap into diverse markets and adapt to regional demands fuels growth potential.
- Evolving Services Portfolio: Infosys evolves its services portfolio to match market trends. Whether it’s AI-powered solutions, cybersecurity advancements, or sustainable practices, the company addresses current challenges and future opportunities.
- Strategic Partnerships: Collaborations with tech giants, startups, universities, and hyper scalers strengthen Infosys’ capacity. These partnerships ensure access to cutting-edge technologies and extend its reach into emerging domains.
- Enterprise Risk Management: Infosys’ strong focus on managing risks ensures stability and resilience. By identifying and mitigating potential challenges, the company ensures growth while protecting investor interests.
#1. Price Trend of Infosys (Last 90 Days)
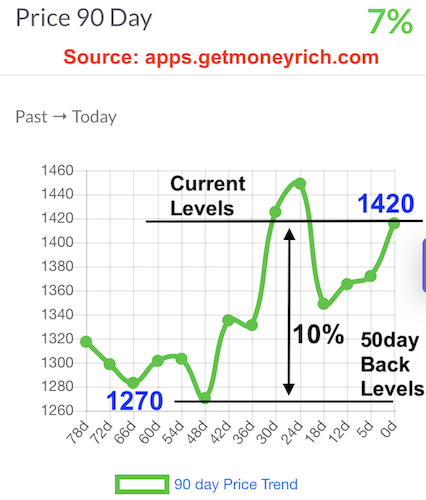
Currently, Infosys stocks are trading at price levels of Rs.1425. A correction of about 10-12% will bring it into the zone of Rs.1265 levels. The stock was at those levels in April’2023 and then it rebounded sharply. It looks like, Rs.1265 is a good support level for Infosys.
So, just by looking at the price trends, trying to buy Infosys at Rs.1265 levels will give a blanket 10% advantage. Considering that, in the long term, this stock is expected to only go up, a 10% correction from current levels will bring Infosys to my buy levels.
But we must not buy any stock like this, without checking their fundamentals. No matter what the technicals say, if the fundamentals do not support the price, the price will fall.
Let’s get to the next step and start doing the price valuation of Infosys based on its financials.
#2. Intrinsic Value Estimation of Infosys
We’ll calculate the free cash flow of the company using the numbers published in the cash flow report. We’ll repeat the same using the numbers published in the profit and loss account.
But before going into the financial reports of the company, let me show you the past 10 years’ numbers of Infosys.
| Description | FY 2023 | FY 2014 | Growth (CAGR) |
| Revenue (Rs.Cr.) | 1,49,468 | 85,557 | 5.74% |
| EBITDA (Rs.Cr.) | 37,831 | 23,052.00 | 5.08% |
| PAT (Rs.Cr.) | 24,108 | 15,410.00 | 4.58% |
| Reserves (Rs.Cr.) | 73,338 | 44,244 | 5.18% |
| Total Assets (Rs.Cr.) | 1,25,816 | 1,17,885 | 0.65% |
| Net Cash From Operations (Rs.Cr.) | 22,467 | 9,825.00 | 8.62% |
The growth numbers of the company in the last 10 years have not been great. On the basis of the past number, we can expect the company’s earnings to grow at a growth rate of about 6% in the next 5 years.
With these as our initial impression about the company, let’s get into the free cash flow analysis of Infosys.
#2.1 Free Cash Flow To Firm (FCFF)
We take the numbers for Infosys from its latest annual report FY2023-2024. The relevant metrics we need to calculate the Free Cash Flow To First (FCFF) are shown in the below formula:
FCFF = Net Cash From Operations – Capex
| Description | FY 2023 | FY 2022 |
| Net Profit (PAT) | 24,108 | 22,146 |
| Net Cash From Operations | 22,467 | 23,885 |
| Note: Operating Cash Flow as % PAT | 93.2% | 107.9% |
| Capex | 2,579 | 2,161 |
| Free Cash Flow To Firm (FCFF) | 19,888 | 21,724 |
Before going into the next step, let’s confirm the quality of the cash flow of Infosys. We’ll do it by comparing how much “Net Profit (PAT)” the company is about to convert into “cash” each year.
Here is a PAT vs. “Net Cash from operation” for the last 20 years:
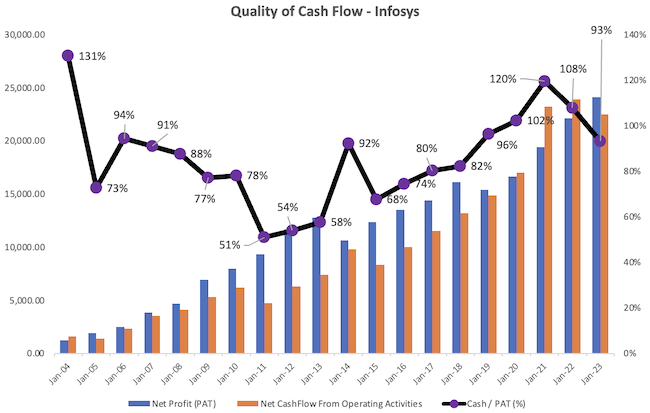
As you can see, even in the worst of times, the company was able to convert nearly 50% of its PAT into cash flows. Since 2011, its quality of cash flow has only increased. As of today, about 90% of its PAT gets converted into cash flows. This is a great sign of quality. Hence, we’ll use the FCFF value calculated above, as it is, without applying any discounting factor.
Note: In our analysis of Expleo Solutions, the quality of cash flow was not up to the mark. Rather, it had very weak cash flows reported in FY2022-23.
Let’s use a second method to calculate FCFF.
The formula that will be used is this:
FCFF = Net Profit + D&A – Capex – Increase In Working Capital
| Description | FY 2023 | FY 2022 |
| Net Profit (PAT) | 24,108 | 22,146 |
| Depreciation | 4,225 | 3,476 |
| Capex | 2,579 | 2,161 |
| Net Current Assets | 70,881 | 67,185 |
| Net Current Liability | 39,186 | 33,603 |
| Working Capital | 31,695 | 33,582 |
| Increase in WC | -1,887 | – |
| FCFF | 27,641 | – |
These are two reliable methods to calculate the free cash flow (FCFF) of companies. We’ll use the weighted average of these two numbers as our final value for FCFF. The weighted average number for FCFF of Infosys is Rs.22,834 Crore.
#2.2 Free Cash Flow To Firm (FCFE)
Free Cash Flow To Equity (FCFE) can be calculated from FCFF (as calculated above). The formula for FCFE is as shown below:
FCFE = FCFF + Net New Debt – Interest * (1-Eff. Tax Rate)
| Description | FY 2023 |
| FCFF | 22,834 |
| Net New Debt | 0.00 |
| Interest | 284 |
| Eff. Tax Rate | 27.65% |
| FCFE | 22,629 |
Infosys is a debt-free company. Hence the value of “net new debt’ is zero. To estimate the effective tax rate, we have used the formula = tax paid / PBT.
Using the formulas, the final value of FCFE calculated for onward estimation of the intrinsic value is Rs.22,629 Crore.
#2.3 Sustainable Growth Rate (SGR)
We’ve already calculated the FCFE of Infosys in the above steps. But this is the thing about the past. To estimate the intrinsic value of Infosys, we’ll need to estimate the free cash flow (FCFE) of the future. To do it, we must assume a suitable FCFE growth rate.
The measure of FCFE growth rate can be done using the SGR Formula. The formula looks like this:
SGR = ROE * (1- Dividend Payout Ratio)
We’ll use the value from the annual report of Infosys to first calculate the ROE and Dividend Payout Ratio. Then, we’ll use the above formula to calculate the SGR.
| Description | FY 2023 | FY 2022 |
| Net Profit (PAT) | 24,108 | 22,146 |
| Shareholder’s Equity | 75,795 | 75,736 |
| ROE | 31.81% | 29.24% |
| Dividend Paid | 13,631 | 12,652 |
| Div. Payout Ratio | 56.5% | 57.1% |
| SGR | 13.82% | 12.54% |
We’ve also estimated the future growth rate for Infosys using its last 10-year financial data. As per that metric, it looks like, the company could grow only at 6% per annum.
So, taking an informed guess, we’ll use a weighted average number for the company’s future growth rate at 7% per annum.
#2.4 Future Free Cash Flow
Now, we have two important numbers, Free Cash Flow To Equity (FCFE of Rs.22,629 crore) and the Future Growth Rate (@7% per annum) for the next 5 years. Beyond the fifth year, we’ll assume that the company will grow at a sustainable growth rate of only 4% per annum.
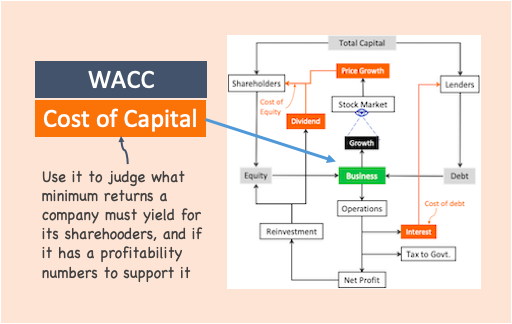
We’ll also assume a weighted average cost of capital (WACC) for the company as 12% per annum. As the company is debt-free, its cost of capital is higher. Otherwise, WACC would have been lower.
Free Cash Flow For The Next 5 Years (CAGR @7%)
| Description | Current YR | YR-1 | YR-2 | YR-3 | YR-4 | YR-5 |
| FCFE | 22,629 | 24,433 | 26,143 | 27,973 | 29,931 | 32,026 |
What we see in the above table is a gradual increase in the free cash flow of Infosys at the rate of 7% per annum. In the next five years, the company will grow its current FCFE from Rs. 22,629 Crore to Rs.32,026 Crore.
Free Cash Flow Beyond The 5th Year (CAGR @4%)
This is the free cash flow that the company will generate for the rest of its life beyond the fifth year. The way to calculate is by estimating the terminal value (TV) of the company. In the terminal value period, I’ve assumed a sustainable growth rate of only 4% per annum. We’ll use the below TV formula to do our calculations:
TV = Free Cash Flow * (1+G) / (WACC – G)
- Free Cash Flow of Fifth Year = 32,206
- G = 4% per annum.
- WACC = 12% per annum.
- TV = 416,339
#2.5 Present Value of Future Cash Flows
We have reached the final stages of the intrinsic value estimation of Infosys. At this stage, we will convert the future free cash flows to their present values. To know why we are doing it, read this article on the present value concept.
To do the conversion, we also need to assume a suitable discount rate. I have picked the value of 10% per annum.
What is the logic? Because it is an equity, the rate should be higher than the risk-free rate of 7.1% per annum. But as the company comes from a very large cap space, I do not want to overestimate the long-term growth potential. Infosys is a relatively safe investment, hence a 10% discount rate looks justified.
Let’s calculate the present value of all future cash flows:
| Description | YR-1 | YR-2 | YR-3 | YR-4 | YR-5 | TV |
| Future Cash Flows | 24,433 | 26,143 | 27,973 | 29,931 | 32,026 | 4,16,339 |
| Present Value (PV) | 22,211 | 21,606 | 21,016 | 20,443 | 19,886 | 2,35,012 |
| Sum of PV | 3,40,175 | – | – | – | – | – |
So, the sum of all future cash flows of Infosys is estimated at Rs. 3,40,175 Crores.
#2.6 Intrinsic Value Per Share of Infosys
As of date, the company has issued about 414,85,60,044 number shares (414.85 Crore) outstanding in the market. We’ve already estimated the present value of all future cash flows of Infosys as Rs. 3,40,175 Crore. Hence, the intrinsic value of Infosys comes out as below:
| Description | Amount |
| Sum of PV | 3,40,175 |
| Nos of Shares | 414.86 |
| Intrinsic Value / Share | 819.98 |
The estimated intrinsic value of Infosys is about Rs.820 per share as per DCF Model.
Conclusion
Infosys is fundamentally a powerhouse. This is evident when we analyze the quality of its cash flows for the last 20 years. The company is able to convert most of its Net Profits (PAT) into cash flow. In the last five years, it has converted about 100% of its PAT into cash flows. This is a clear sign of strong business fundamentals.
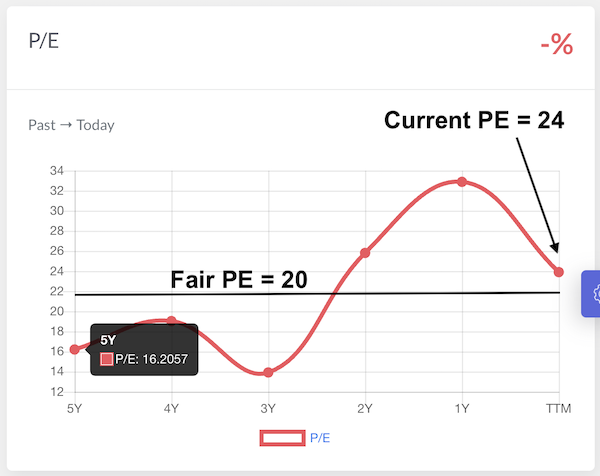
Looking at the last five year’s PE history of Infosys, it looks like the fair PE of the company should be around the PE20 mark. At the current EPS of Rs.59.23, the fair price of the company comes out to be about Rs.1,195 per share.
Using the DCF method, we’ve estimated the intrinsic value of the company as Rs.820 per share.
An average of the PE20 and DCF would give an intrinsic value of about Rs.1,000 per share.
We have also seen the technical price chart of Infosys. There it seemed like Rs. 1270 should be a good buy level for Infosys.
I’ll wait for Infosys share price to fall between Rs.1,000 and Rs. 1,270 levels before taking a buy call.
To me, this company is a super-strong stock. Buying this stock at Rs.1,000 levels can potentially give a 12.5% CAGR capital appreciation. The holding time expected is about 3-5 years.
Have a happy investing.
If you find it difficult to do a fundamental analysis of companies like done here, you can subscribe to our Stock Engine. It can analyze stock with the click of a button.
Suggested Reading: