To understand if Redington’s Stock is undervalued or not, we must first look into its business. On the face of it, the company looks like a typical IT company, but it is not. Looking at its business model will tell us why a strong-looking company like Redington trades at a PE multiple of below ten (10).
Do you know what the revenue of Infosys is? about Rs.150,000 crore. What is the revenue of Redington? about Rs.79,000 which is about 52% of Infosys.
Now let’s look at their Market Cap. Infosys has a market cap of about Rs.608,000 crore. If Redington follows the same 52% rule, its market cap should be about Rs.316,000 crores. But do you know what is the actual market cap of Redington? It is only about Rs.13,000 crores.
Persistent Systems has revenue of only about Rs.8,400 crores (23% of Redington) but its market cap is close to Rs.44,500 crore (3.4 times that of Redington).
This is why I’m referring to Redington as not a typical IT company. Considering Redington’s current income streams, it can best be described as a special trading company.
So in a way, we can say that, we cannot expect Redington to trade at the P/E levels of our IT stocks. We’ll also do the intrinsic value calculation for the company. It will actually decide, if at current PE levels, the stock is actually undervalued.
Business Model
Redington India is involved in the IT and technology industry. They have a diverse business model that includes the distribution and sale of various products, including laptops, desktops, printers, smartphones (referred to as Mobility), and cloud services.
Redington India is one of the authorized distributors and service providers for Apple products in India. They are responsible for distributing Apple products, including iPhones, iPads, Macs, and accessories, to various retailers and resellers in the Indian market. Additionally, they provided after-sales support and services for Apple products through their authorized service centers.
Like Apple, Redington also works as a distributor of hardware and software products of Microsoft, HP, Lenovo, Google Pixel, Samsung, Dell, IBM, Acer, Toshiba, etc.
Redington had partnerships with various technology companies to offer cloud services to its clients. Some of the major cloud service providers that Redington India could have partnered with for offering cloud solutions include:
- Microsoft Azure.
- Amazon AWS.
- Google Cloud Platform.
- IBM Cloud, etc.
Revenue Streams
The three main revenue streams of Redington are these:
- Volume I.T: This segment includes the distribution of products such as tablets, laptops, desktops, and printers. This business is approximately one-third (about 35%) of the total revenue of Redington.
- Mobility Business: It includes the distribution of smartphones which is another revenue stream. About 20% of the total revenue of Redington comes from this segment. It has been one of the fastest-growing business segments for Redington. However, it is also worth noting that Apple is one of the key suppliers to Redington who opened their own retail stores in Mumbai and New Delhi in April this year (2023).
- Enterprise I.T (Information Devices): This is another segment of their business, and it typically includes higher-end IT products and services tailored for enterprises and businesses. This business segment operates at a margin that is approximately 2% points higher than the volume I.T and Mobility business.
To support the above three main business verticals, Redington offers the following services as well:
- Value-added services: Redington provides value-added services, such as installation, configuration, and maintenance of IT products.
- Logistics and supply chain management: Redington provides logistics and supply chain management services to its customers and suppliers. Redington has their own warehouse services. This helps suppliers and customers manage their inventory and ensure that they have the right products at the right time.
Margin
Redington’s EBITDA margins were reported at 2.5% in the Q4 of FY 2022-23.
EBITDA margins were 2.7% in Q3 and 2.8% from the same period in the previous year (FY 2021-22)
The company has indicated that by Q4 of FY 2023-24, the margins will improve and guide that they will likely be between 2.6% to 2.9%.
This is the reason why the P/E Ratio of Redington trades at a low PE ratio. The EBITDA margin for typical companies in the Indian IT sector (TCS, Infosys, Wipro, etc.) is typically around 20%. But Redington does business at an EBITDA margin of below 3%.
That is why, though it works in the IT space, it is not our typical IT company. So expecting that, someday, its PE will also become 25-30X is farfetched and looks unrealistic today.
Other Aspects of Business
- Redington India faced margin pressure due to market contraction and pressure on inventory and stock liquidation. This is one reason why in FY 2022-23, its debt-to-equity ratio (D/E)swelled.
- The company experienced strong revenue growth of 26% on a year-on-year basis, even though there were challenges in the market.
- The drop in demand for home devices (such as laptops and tablets) due to reduced work-from-home and learn-from-home trends contributed to inventory build-up in FY 2022-23 (its effect on cash flow report).
- There is an expectation that the pressure on inventory will ease in the upcoming fiscal year in the coming quarters as the demand for volume IT products will increase.
- Redington India operates in multiple geographies, including India, Singapore, the Middle East, South Asia, Africa, Turkey, etc. with an expectation of continued growth in these markets.
- The company’s focus on cloud services appears to be paying off with robust growth in this segment .
Latest Price Trend
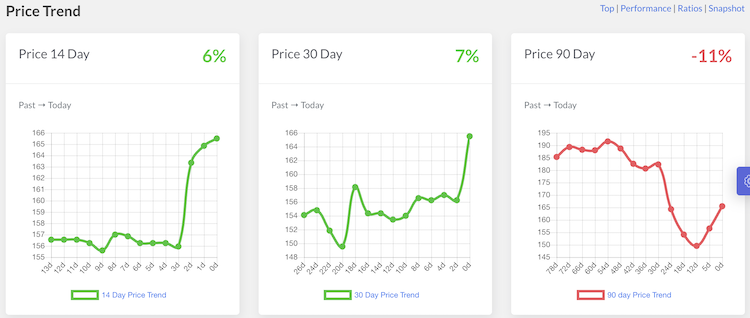
In the last 90 days, the stock price has corrected by almost 11%. In July’23, its stock price was at Rs.190 levels. But today it is trading at Rs.165 levels. Hence, I thought to present to you a fundamental analysis of the company. I’ll present to you a quick intrinsic value estimation of the company.
Overall, my Stock Engine gives it an overall score of 79 out of 100. This is another motivation for me to do a self-check of its intrinsic value.
Intrinsic Value
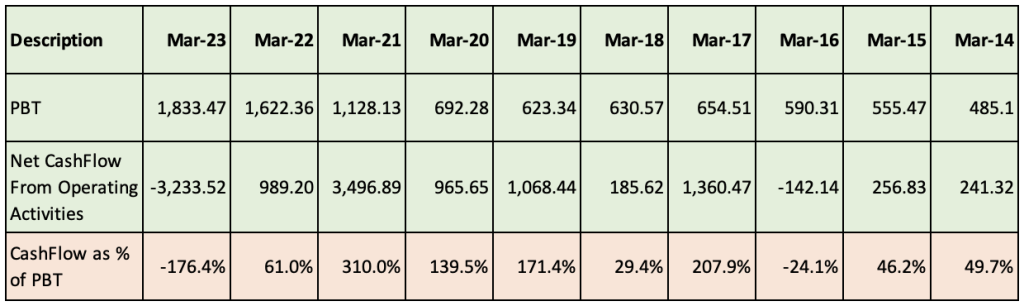
I tried calculating the free cash flow of Redington taking numbers from its cash flow report. But it came negative for the current year. But if we look at the last 10 years’ cash flow data, it looks like, on average the company’s operation stayed cash flow positive. Hence, I’m trying a new approach to estimate the intrinsic value of this company.
Redington can collect about 40% of its PBT in the same year.
Redington being in a trading business, I’m assuming that it will not invest more than 15% of its PBT into CAPEX.
I’ll also assume a one-year forward PBT of Redington as Rs.2000 crores (FY 2024-25). Out of this PBT, it will convert about 40% of it (Rs.800 crore) as net cash flow from operations. If we take 15% of PBT as Capex (Rs.300 crores), the free cash flow to the firm (FCFF) will be Rs.500 crores.
Free Cash Flows To Equity (FCFE)
In the last 10 years, the company generally carried a debt of about Rs.1500 crores. But last year it had more than double the average debt on its balance sheet. It was an unprecedented situation as explained in SL.3 here.
For free cash flow to equity (FCFE) calculation, we take only 20% of debt into consideration (as a factor of safety). Hence, FCFE will look like this:
FCFE = FCFF + Debt = 500 + 300 = 800 Crores.
This way, the FCFE of the company comes out to be Rs.800 crores.
The free cash flow to equity (FCFE) of the company is Rs.800 crores.
Normal Period Growth Rate (Gnp)
In the last five years, the company’s ROE has increased from 13% to 20%. I’m assuming that it will remain at 20% levels in the coming years.
The company pays about 36% of its net profit (PAT) as dividends to its shareholders.
So this way, the sustainable growth rate (SGR = Gnp) of the company will be about 12.6% per annum.
Future Free Cash Flows
We’ve estimated that the present free cash flow to equity (FCFE) of the company is Rs.800 crores. In the next five years, the FCFE of the company will grow at about 12.6% per annum.
I have also assumed the following to calculate the terminal value (TV):
- Perpetual Growth Rate (after 5th year) = 3.5%
- Discount Rate = 10% per annum.
Taking these numbers as our basis future free cash flows for the next five years come out to be as follows:
- FY-1: 901.31
- FY-2: 1,015.46
- FY-3: 1,144.06
- FY-4: 1,288.94
- FY-5: 1,452.18
- TV: 23,123.11
Present Value of Future Cash Flows
At the discount rate of 10% per annum, the sum of present values (PV) of the above free cash flows comes out to be Rs.18,658 crores.
The company has issued about 78.16 crore number shares in the market.
This way, its intrinsic value per share will be as below:
- The sum of PV = Rs.18,658 crores.
- Nos. of Shares = 78.16 crores.
- Intrinsic Value / Share = Rs.238 per share.
This being a trading company with its own set of challenges, I’ll apply a standard two-thirds margin of safety to my estimated intrinsic value.
Applying this margin of safety, I’m assuming that a fair buy price for this stock will be about Rs.160 per share.
Conclusion
I know that Redington is not a typical IT stock and this is why it is trading at an EBITDA Margin of 2.5%.
I also know that in coming years, the company will have to diversify its business, as (maybe), its revenue from Apple’s products may fall. But it can be made up through value-added services (Cloud computing etc.). But it will take time (like 10 years).
It is a company in which the promoter’s holding is zero percent. But there are some top Indian companies like L&T and ITC where we can see the same behavior. Generally, I like companies, where the promoter’s holdings are high. But it is not a deal-breaker for me.
But I like the management of this company. The way they present their annual reports looks transparent, professional, and ethical.
I’ve tried to factor in all the negatives of the company while estimating its intrinsic value. My estimation is (it is for myself, not to be treated as an investment advice) as Rs.160 per share.
Its current stock price (Rs.166 per share) is already very close to my estimates.
I’m adding this stock to my watchlist.
Quick Thoughts
Redington is a decent stock for value investors. It should not be treated as a growth stock. It is not the multi-bagger that I often aspire to have in my portfolio. But the stock can fetch me decent dividends. At the current price level (Rs.166 per share), its dividend yield is above 4%. Going forward, in the next 5 years, I expect this dividend yield to improve further. Moreover, being a value investor, I feel uncomfortable adding expensive (high PE and PEG) stocks to my portfolio. So for me, Redington will be a fair buy at Rs.160 levels.
Have a happy investing.
Suggested Reading: