What is the average return of Sensex? The simplest answer to this query is 13.81% per annum. But to give you this answer, I’ve made a critical assumption. It has been assumed that the holding time is three (3) years. Increasing the holding time to five (5) years will change the average return to 12.76% per annum.
Now, let’s add one more variable to our query, what is the average return of Sensex? It will give us more clarity about the past returns of the Sensex. Let’s add the variable of probability. So, allow me to ask this simple question by inserting two variables into it:
What is the average return of Sensex for a holding time of three (3) years and what is the probability of earning that return? For a 3-year holding time, the average return is 13.81% and the probability of earning this return is about 55%.
This type of answer about the average return sounds more complete and conclusive, right?
Let me give you more details about it.
How To Read The Chart
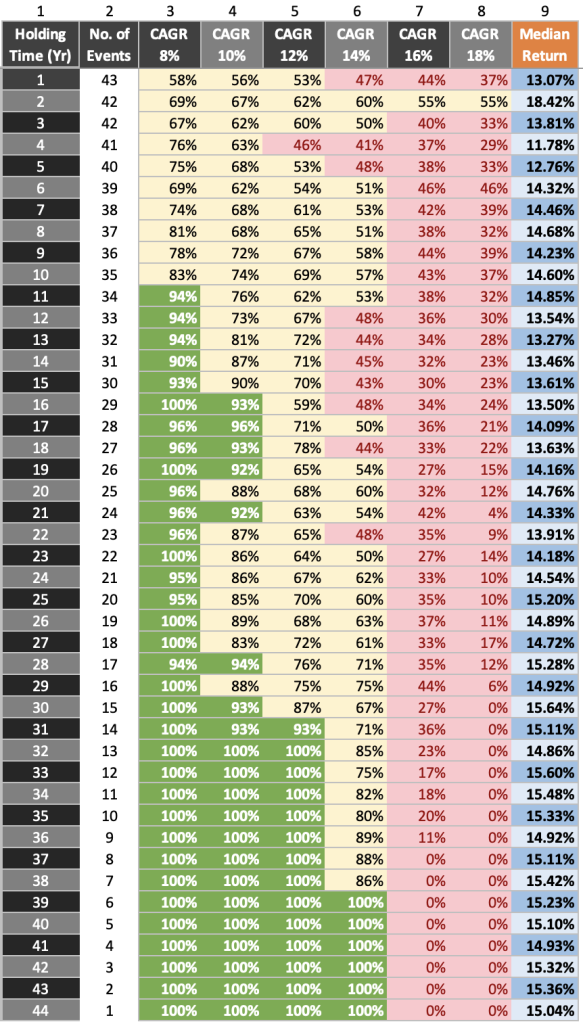
The chart shows the average return of Sensex in the last 44 years (1979 to 2023).
In the first column of the chart, various holding times are displayed. It starts from year one (1) to year forty-four (44). Against each holding time period, a set of return data is displayed. I’ll explain how to read this data in the coming paragraphs.
The second column is labeled as the “Number of Events“. Read it as, if the holding time is a year, the data set had 43 number such events. For example, the start date of the data is April 1979. A one-year holding time from this start date will be a period between April 1979 to March 1980. Similarly, a second holding period can be from April 1980 to March 1981. Likewise, there are 43 number such events (of 1-year time horizon) in our data set.
From columns third to eighth, the probability of the return is indicated. For example, when the holding time is 1 year, the probability that the Sensex will yield a minimum return of 8% per annum is 58%. Please note that 58% probability is calculated based on 43 number events as explained above.
[We can assume, higher are the number of events, the more reliable the data]
The ninth column is labeled as Median Return. In the provided table, for a one-year period, the median return is 13.07%. So we can say that, for a holding time of 1 year, the average return of Sensex is about 13.07% per annum.
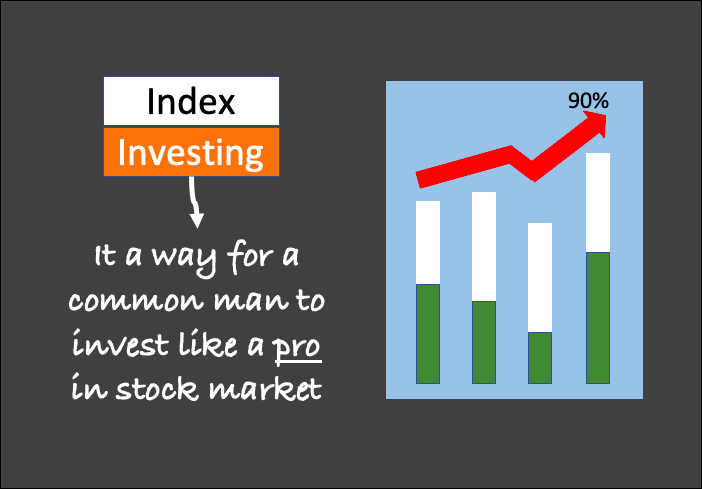
Introduction
Stock market investors remain curious about the average return of Sensex. Whether one is a beginner or has some experience, a deeper understanding of the historical performance of the market will help. It can help us make informed decisions and set realistic expectations.
Generally speaking, we assume that the Indian stock market grows at an average rate of 12% per annum. It is a close assumption, but I’m sure you savvy investors would like to dig deeper into this number.
Hence, I present to you this 44-year-wide price analysis of Sensex.
The purpose behind this analysis is to judge how fast the Indian stock market has grown in the past. Moreover, we look at the return number of Sensex through the filters of holding time and probability of occurrences.
Historical Context
The Indian stock market is represented by two key indices, Sensex and Nifty. Both these indices have seen remarkable growth over the years. Since its inception, it has weathered various economic ups and downs, yet the long-term trend has been upward.
At the start of April 1979, the Sensex was assumed at 124.15 levels. As of 31-Oct-2023, Sensex was trading at 63,874.93 levels. This time period covers 44.57 years from start to end. In this time period (44 years) the Snsex has grown at a rate of 15.03% per annum.
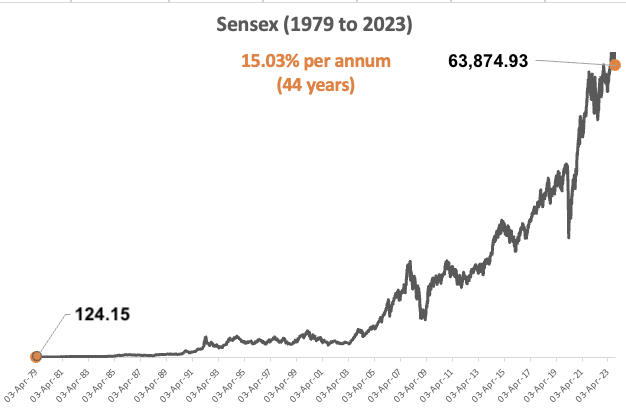
But as 44.57 years is a very long time horizon, investors would not get a fair perspective of the average return of Sensex for such a time period.
A majority of savvy equity investors stay invested in equity between 3 to 25 years. Hence, it is a must to look at the return data of Sensex through the lens of the holding time.
Holding Time 5 Years
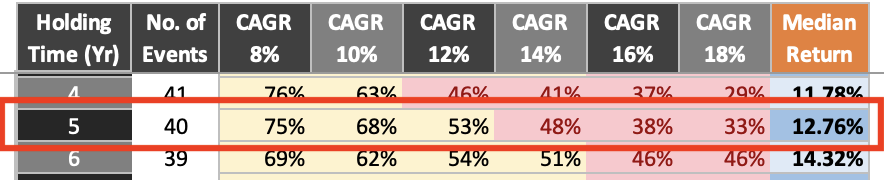
What is the average return of Sensex for a holding time of five (5) years. What is the probability of earning that return? For a 5-year holding time, the average return is 12.76% and the probability of earning this return is about 50%.
In equity investing, if a calculated risk can tell that there is a fifty percent chance of earning a 12.76% return, pro-investors would grab it with open arms.
But the problem is a combination of the holding time (5 years) and the probability of 50%. Five years of holding time is a long duration. If my equity assures me with only 50% certainty that I will earn the said return, it is not as motivating for me.
Remember, we are talking about Sensex (an index) and not direct stock investing. For direct stocks, I’ll be happy even if it promises returns with a 50% probability. With indices, I’d like to see higher probabilities.
So for me, though an average return of 12.76% is fair (from an index), the low probability percentage is telling me to explore a longer holding time.
Holding Time 10 to 20 Years
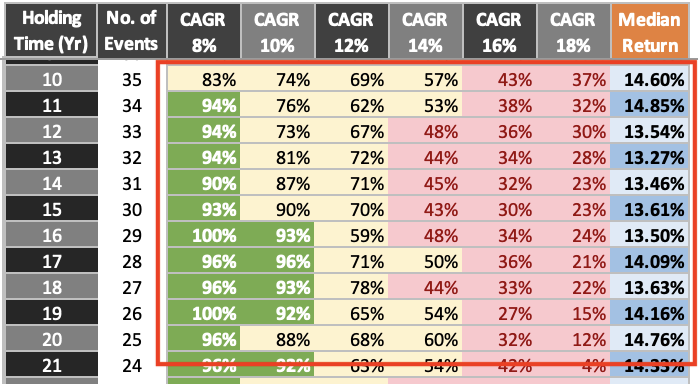
The average return of Sensex for a holding time of 10 to 20 years is between 13% to 14% per annum. The probability of earning this average return is about 60%. But there is something else that excites me more in this holding time bandwidth. The chances of earning a 8-10% return is close to 90%.
Look at it like this, why do we fear pure equity investments? Because of the price volatility which may render negative returns. But for such long holding periods, forget negative returns, the index is promising with almost 90% certainty a return of 8% to 10% per annum.
What is the benefit of looking at Sensex’s returns with this outlook? When holding periods are so long (10-20 years), index investing starts to behave almost like a fixed deposit. It is a useful perspective for those who want to build their retirement corpus themselves.
In India, traditional PF and EPF-linked investment yields about 8.15% return. If index-linked investments can also promise that same return, self-employed people can practice index investing and get the same assured returns as PF and EPF. It can be their way to build the retirement fund on their own.
If such is the return probability, even salaried people can contribute more to index (than their PF/EPF funds) and get a better yield.
Also remember, when the holding period is between 10 to 20 years, there are very high chances (about 90%) that the index will yield a return close to 10%. So the compounding effect in index investing will be substantial as compared to the PF and EPF.
Holding Time 20 to 35 Years
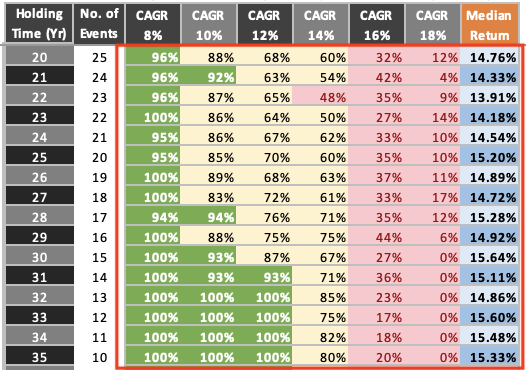
Between the 20 to 35 years holding time horizons you’ll see more greens in the chart. All greens are symbolic of at least 90% probability. In equity investing, such a high probability of returns is possible only in two cases, either the expected returns are low or the holding time is very long. This Sensex price chart confirms this understanding.
Look at the holding times between 20 to 29 years. The data shows that the probability of earning 8% per annum return is between 94 to 100%. This is phenomenal, as even corporate bonds will find it tough to offer this kind of certainty, here we are dealing with equity. The data also shows that the probability of earning between 10% to 12% per annum return is between 65% to 94%.
Moreover, for holding times between 20 and 29 years, the median return numbers are 14%+ per annum. The probability of earning this return number is almost 60%. Which is only fair.
But if we cross the holding time beyond the 30-year mark, the median return becomes close to 15% per annum. There is almost a 95% to 100% probability that this holding times will yield at least 12% per annum return.
Conclusion
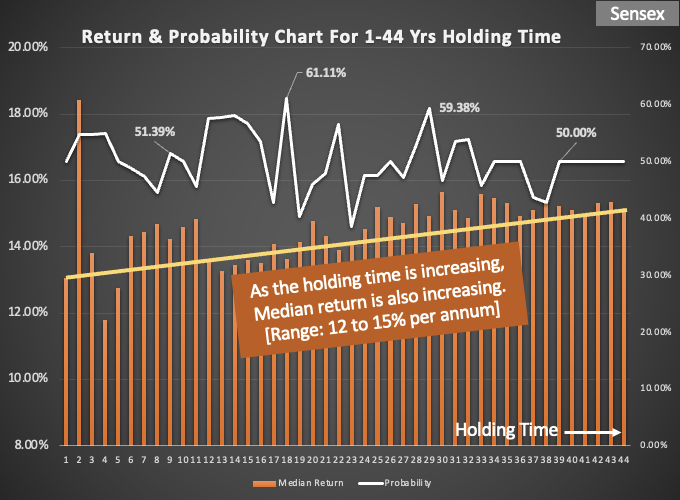
The average return of Sensex will change with the holding time. Generally speaking, for holding periods like 3, 5, 7, 10, 12, and 15 years, the average return is between 12.76% to 14.6%.
| Holding Time (Yr) | Median Return |
| 3 | 13.81% |
| 5 | 12.76% |
| 7 | 14.46% |
| 10 | 14.60% |
| 12 | 13.54% |
| 15 | 13.61% |
I assume that a majority invests in Sensex for a holding period of close to 3 years. For this time horizon, the average return of Sensex will be about 13.81% per annum.
If we add the factor of probability to these holding times, we’ll get a more conclusive answer to our query of average returns. For a holding time of 3 years, the probability of earning an average return of 13.81% per annum is 54.76%.
| Holding Time (Yr) | Median Return | Probability |
| 3 | 13.81% | 54.76% |
| 5 | 12.76% | 50.00% |
| 7 | 14.46% | 47.37% |
| 10 | 14.60% | 50.00% |
| 12 | 13.54% | 57.58% |
| 15 | 13.61% | 56.67% |
Have a happy investing.
Suggested Reading:

![Sensex 30 Companies: Their Weightage in The Index [2025]](https://ourwealthinsights.com/wp-content/uploads/2022/03/Sensex-Weightage-Stocks-Thumbnail2-768x392.jpg)