
It was my goal to construct a stock portfolio including dominant and monopoly companies. In this article, I’ll share a method of exploring the best monopoly stocks. Over the years, I’ve built multiple algorithms to identify quality stocks. I’ll share with you one method which I use to identify monopoly companies operating in India. Check this list for the best monopoly stocks. [For a broader perspective, check out our guide on Top Stocks to Buy in India.]
My algorithm tries to Identify the best monopoly companies using various quantitative factors. These factors (financial metrics) can paint a comprehensive picture of their competitive standing in the market.
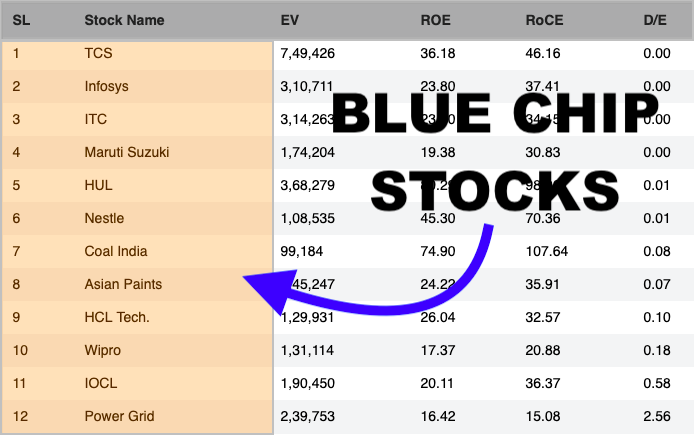
List of Best Monopoly Stocks in India [2024]
Check all monopoly stocks in the Stock Engine
(Updated: 24-May-2024)
| SL | Name | Sector | Industry | Price | Market Cap(Cr) | Operating Margin | ROE | P/E | GMR Score |
| 1 | ASIANPAINT:[500820] | Materials | Paints & Varnishes | 2877.7 | 2,76,098.30 | 18.97 | 28.97 | 50.6 | 93.26 |
| 2 | BAYERCROP:[506285] | Chemicals | Pesticides | 5031.15 | 22,663.90 | 17.24 | 25.99 | 30.53 | 92.26 |
| 3 | ZENTEC:[533339] | Others | Others | 965.25 | 8,061.53 | 39.45 | 53.65 | 62.27 | 92.12 |
| 4 | POLYCAB:[542652] | Capital Goods | Wires & cables | 6,723.00 | 1,00,787.39 | 12.44 | 22.02 | 56.54 | 91.6 |
| 5 | COLPAL:[500830] | Consumer Staples | Household & Personal Products | 2,633.65 | 71,632.83 | 30.1 | 70.62 | 54.12 | 90.71 |
What Are Monopoly Stocks?
Before going into the quantitative factors, let’s understand the definition of monopoly stocks. At the core of it, the following four factors give the monopoly status to companies:
The Basic Four
- Market Share: Monopoly stocks dominate their respective industries. They hold a significant portion of the market.
- Revenue and Profit Margin: Monopoly companies typically yield higher profit margins due to limited competition. It happens because of their pricing power.
- Operating Cost: Monopolies enjoy economies of scale. Their production costs per unit item are low as they have a huge customer base (market) to serve. This operational efficiency makes it even more challenging for smaller competitors to match their cost structures.
- Entry Barrier: Monopoly companies create entry barriers for new companies. They do it by becoming formidable. Smaller companies may require huge capital requirements, massive brand-building campaigns, and R&D prowess to match the might of the industry giants.
Other Factors
In addition to the above four factors, few companies have enhanced their monopoly status using other factors.
- Switching Costs For Customers: Companies like Google, Microsoft, Apple, etc use this technique very visibly. They give their customers so many added services with their primary products that it becomes inconvenient for such customers to switch to alternative products. Check this recent news about Google that is in line with this concept.
- Regulatory Environment: It can also play a pivotal role in building monopolies. For a long time in India, there were only three passenger car manufacturers in the country. The entry into the auto sector was heavily regulated. It gave a kind of monopoly status to these three companies.
- Technology Expertise: Microsoft’s product Excel, gives it its monopolistic position. Till today, there is no desktop app that can match the features of Excel. Google Sheets comes close but it is still not used as widely as Excel.
Now that we’ve understood what is a monopoly and what factors give them this position, let’s also know how to identify them.
In the above seven points, we’ve seen some qualitative factors. But to create a filter for monopoly stocks we must pick appropriate financial metrics. I’ll explain a few metrics that my Stock Engine’s algorithm uses to filter and score the best monopoly stocks in India.
Point #1: Revenue Growth (5 Years)
One of the key metrics my algorithm uses to identify monopoly stocks is sustained revenue growth. It serves as a reliable barometer of the company’s ability to expand its market share.
Consider a hypothetical scenario where Company X has consistently demonstrated a 15% YOY revenue growth for the past five years. This sustained upward trajectory suggests that the company not only has a demand for its offering but there is also reasonable growth. When such growth rates are sustained over a long period, they indicate a competitive edge.
To put this in perspective, let’s say Company X operates in the auto sector in India. Its robust revenue growth could be attributed to a combination of factors such as effective marketing strategies, superior customer service, and innovative offerings. These factors set it apart from competitors.
As the company captures a larger share of the market, its increased revenue contributes to building a stronger market position.
The Stock Engine algorithm considers rapid revenue growth, especially over an extended period, to imply a potential monopoly.
Point #2: Return on Equity (ROE)
Return on Equity (ROE) is a vital metric to identify monopoly stocks. To know in detail about the ROE, read this article. Let’s understand the concept of ROE and Monopoly using an example.
Imagine Company ABC, operating in the technology sector, consistently reports an ROE of 20% over several years. This means that for every rupee of shareholders’ equity invested, the company generates 20 paise in net profit. Such a high and consistent ROE suggests that Company ABC is adept at utilizing shareholder funds to create substantial profits.
Now, let’s connect this to the concept of a monopoly.
Monopoly stocks exhibit consistently high ROE due to their ability to maintain strong pricing power. Consider a situation where Company ABC dominates the market with a unique technology product (like Apple and Samsung). The demand for this product allows the company to command higher prices, leading to robust profits and an elevated ROE.
Monitoring ROE is a simple method to assess a company’s ability to generate returns on shareholders’ investments. Only monopoly companies can hold on to a high ROE number over long periods.
Point #3: Return on Assets (ROA)
Return on Assets (ROA) provides insights into how efficiently a company utilizes its assets to generate profits. To know more about how ROA is calculated, read here.
In the context of identifying monopolistic tendencies, a high ROA is often associated with companies that dominate their markets.
Let’s illustrate this with an example: Consider Company XYZ operating in the consumer industry. If Company XYZ consistently reports an ROA of 20%, it means that for every rupee worth of assets it owns, the company is generating 20 paise in net profit. This indicates efficient management of its assets in a way that contributes significantly to its profitability.
Now, let’s connect this to the concept of monopolies.
A company with a dominant market position, like a consumer goods manufacturer, may have higher pricing power, brand recognition, and operational efficiency. This allows it to make the most out of its assets—plants, equipment, inventory, and liquid assets. This results in a high ROA.
Monitoring ROA provides valuable feedback about the company’s monopolistic tendencies. It is not easy for companies to report high ROA. But if a company can maintain and improve its ROA over time, is a very strong indicator of monopolistic tendencies.
Point #4: Operating Margin (OPM)
OPM measures a company’s profitability specifically from its core operations, excluding certain non-operational expenses. To know more about operating profit margin, read this article.
In the context of identifying monopolies, OPM is a key indicator. Monopolistic companies command higher margins due to limited competition.
For example, let’s consider a hypothetical company ABC operating in the software industry. If company ABC consistently reports an operating margin of 35%. It means that for every rupee generated in revenue from its core business activities, the company retains 35 paise as profit before accounting for interest and taxes. Monopolies enjoy such high operating margins because they have the power to set prices without intense pressure from competitors.
Why a healthy OPM is crucial in the context of market dominance?
Imagine Company ABC has developed a unique software solution with minimal competition. Due to its monopoly status, the company can price its product at a premium, resulting in higher profit margins. This ability of the company to maintain a healthy OPM is a strong indicator of the company’s pricing power and operational efficiency.
A consistently healthy and improving OPM is a strong indicator of a company’s ability to navigate competition and dominate its market peers.
Point #5: Free Cash Flow (FCF)
Free Cash Flow (FCF) measures a company’s ability to generate cash after covering its operating expenses and capital expenditures. In the context of identifying monopoly stocks, a strong FCF is a key indicator of financial strength and flexibility.
For example, let’s say there is a company LMN, operating in the auto sector. The company consistently reports robust FCF. This means that after covering its day-to-day expenses and investing in necessary assets (like property, plant, and equipment), the company has surplus cash.
Monopoly stocks exhibit strong FCF because their dominant market positions allow for steady and predictable cash flows.
Suppose Company LMN faces a new entrant in the auto industry. The strong FCF will give the company the financial edge to invest in R&D, install assembly lines, spend more on sales and marketing, etc. The company may even consider strategic acquisitions to maintain its monopoly status.
This ability to innovate and defend its market position is fueled by the surplus cash generated through robust free cash flow.
Hence, a consistently strong FCF is indicative of the company’s resilience. Such companies can not only withstand market pressures but also invest in initiatives that secure and extend their dominance in the market.
Point #6: Market Share
Market share is a straightforward metric. It is a clear indicator of the extent of a company’s dominance in its industry. Let’s understand the concept of market share using a simple example.
Suppose there is a company ABC in the specialty chemical industry. It consistently holds a 40% market share in the industry by sales revenue. This means that out of all the sales in the specialty chemical industry, 40% is attributed to company ABC. Such a significant market share is a clear sign of the company’s dominance, illustrating that it is a major player in the industry.
Monopolies, by definition, have a substantial share of the market. An ideal monopoly company will display a market share of 100%.
There was a time when Microsoft’s MS Office enjoyed a near-full monopoly in the operating system space. Similarly, there was a time when Coke and Pepsi used to sell more than 90% of all soft beverage sales across the world. As of today, out of all smartphone sales across the world, 70% are Android-based (Google’s) and about 30% are IOS-based (Apple’s). These are a few examples of near-perfect monopoly businesses.
Point #7: Fixed Asset Turnover Ratio (FATR)
FATR is a crucial metric in evaluating a company’s operational efficiency and potential for market dominance. FATR assesses how efficiently a company utilizes its fixed assets, such as machinery or facilities, to generate revenue.
This ratio is calculated by dividing a company’s net sales by its average fixed assets. It highlights the efficiency with which fixed assets are employed to generate sales revenue.
Consider a hypothetical tech giant with a monopoly in a particular software niche. With minimal competition, this company can maintain high utilization of its fixed assets. As the competition is limited, whatever the company is producing it is getting sold in the market.
The soaring FATR becomes a tangible metric, signaling not just efficiency but the strategic advantage a monopoly company holds in controlling its market segment.
Final Words
Identifying monopoly companies is crucial for stock investors due to the unique advantages associated with such entities. Monopoly companies often enjoy sustained profitability and strong pricing power. Their dominant market positions allow them to control prices, resulting in higher profit margins.
High absolute profits and sustainable margins eventually translate into consistent returns for the investors.
Moreover, monopolies are less susceptible to competitive pressures. With limited or no direct competitors, these companies face lower threats of price wars or erosion of market share. This stability can be attractive to investors seeking resilient stocks, especially during economic downturns or periods of market volatility.
Let’s look at their limitations:
Regulatory scrutiny is a primary concern. Governments may intervene to curb monopolistic practices. Governments do not want companies to enjoy too much pricing power. To maintain fair competition in the market, government may intervene and break the monopoly.
Another limitation is the potential complacency that may arise in monopolies. Without the competitive drive, these companies might become less focused on innovation, efficiency, or customer satisfaction. This lack of competition could lead to stagnation and a decline in the quality of products or services.
Furthermore, investor reliance on a single dominant player can pose risks in the event of a disruptive change in the industry. Emerging technologies, regulatory shifts, or changes in consumer preferences may challenge the monopoly’s supremacy, impacting investor returns.
It is also critical to note that the share of monopoly companies often trade at very expensive price levels. Hence, as an investor, it is important for us to buy these stocks only during dips.
Have a happy investing.


Hi Mani,
I appreciate the effort you are putting into explaining the process of fundamental Analysis in great detail and have subscribed to your stock engine. However, some of the stocks you have included in your list are very puzzling. For e.g., in the list of monopoly stocks, “Maharashtra Scooters” is very high (12th in the list) witha monopoly GMR score of 68.06. However its ROE is listed as 0.86%. This is indeed its ROE confirmed by independent calculation. How can a business returning less tha 1% on equity be a company worth of study, let along be a monopoly stock. Can you kindly explain the process by which the stock waqs selected and GMR calculated? Thanks.
I understand your point. This is a unique company. Earlier, Mahascooters was involved in producing scooters under the Bajaj brand. Over time, manufacturing operations ceased, and the company transitioned into an investment company. As of recent financial updates, Mahascooters holds significant investments in Bajaj Auto, Bajaj Finserv, and Bajaj Holdings, making its value highly dependent on these group companies’ performance.
Its investment focus makes it unique. The company reports high EBIT and net profit margin (above 80%) – as it generates significant income from dividends and capital gains, which have minimal operating costs. However, its low ROE (<1%) results from a large equity base, primarily retained earnings, that doesn’t actively contribute to business expansion or operational efficiency, diluting the return on shareholders’ equity despite strong profitability.
So, yes its kind of a mixed bag.
My algorithm picked it as a monopoly because of the margins, zero debt, etc at which it operates. Its business model is unique.
[Note: The monopoly algorithm is linked to the "economic moat algorithm" which is complex and evaluates companies based on multiple numbers]
Sorry if the score confused you but I must say, you have a deep observation.
Thanks you for subscribing.
Hi Mani,
Thanks a lot for the explanation.
Regards,
Deepak
My pleasure.
You can also read this blog post (especially written for your query).