Ever wondered why some stocks zoom to the moon while others crash and burn? There are a lot of things that determine the stock price movement. But the story of the profits of the company plays a crucial role here. Like, there are many things that makes a great cup of chai, – right from the milk, to the leaves, to the sugar to the masala, it is the perfect balance of everything that makes it perfect cup of tea. Similarly, there are various factors that affect the stock price.
In the complicated game of the stock market. Understanding company profits is like understanding the pulse of a business. It tells you how healthy the company is and, more importantly, where it might be headed. Investors cannot ignore venturing into the depth of understanding the company’s profitability scores.
Table of Contents
1. What Profits Mean To A Company?
Think of a company’s profits as its financial heartbeat. Without profits, it cannot survive.
What is a profit? It is the money a company makes after deducting all expenses. The money that’s left in the bank after the year long efforts of the team is the real profit.
The amount of profit and how consistent profit a company is making is an important determiner of its stock price.
Why is this important for you, the investor? Well, a company that consistently makes good money is more likely to:
- Grow and expand: Like a well-fed child, a profitable company can invest in new products, services, or even enter new markets. It can lead to higher revenue and more profits down the line.
- Reward shareholders: This could be through dividends. It is a way to share the profits with the shareholders. Investors love such stocks. Profitable companies can also buy back its own shares, which increases the value of the remaining outstanding shares.
- Weather economic storms: A company with healthy profits is better positioned to survive downturns and market volatility. Companies that can withstand tough times, can grow exponentially fast in good times.
Consider this, imagine two grocery stores in your neighborhood. One is always packed, the owner is smiling, and they’re expanding their stock. The other is struggling, shelves are half-empty, and the owner looks stressed. Which one would you rather invest in (if you could)?
The same principle applies to larger companies.
2. Decoding the P/E Ratio
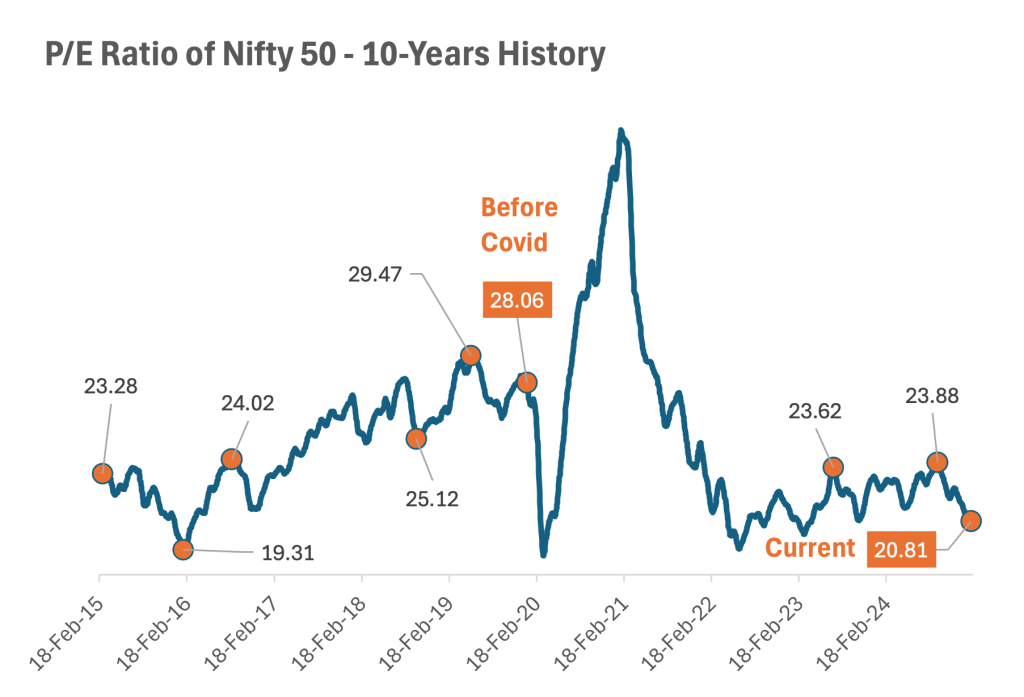
[This above chart gives a visual reference point for understanding how the P/E ratio of the Indian stock market has fluctuated over time. This chart helps us to put the current P/E ratio of Nifty 50 into perspective.]
Now, let’s talk about the P/E ratio (Price-to-Earnings ratio).
This is where things get interesting. The P/E ratio tells you how much investors are willing to pay for each rupee of a company’s earnings.
It’s calculated by dividing the company’s stock price by its earnings per share – EPS (PE = Price / EPS).
- High P/E ratio: This could mean investors are very optimistic about the company’s future growth potential and are willing to pay a premium for its earnings. It could also mean the stock is overvalued. So, the P/E ratio need to be observed along with other factors.
- Low P/E ratio: This could indicate that the company is undervalued or that investors have concerns about its future prospects.
But here’s the thing, a high and low PEs can mean both the things. High PE can be good for one company and can be bad for another. Similar is the case for the low PE. Confusing, right?
The point I’m trying to make is, P/E ratio is just one piece of the puzzle. Don’t rely on it blindly. It’s like judging a book by its cover – go ahead and read the book first.
As an investor, we need to delve deeper to understand the story.
3. Past vs. Future Earnings: What to Focus On?
When you dive into a company’s financial reports, you’ll quickly encounter two key types of earnings data: trailing and forward.
Understanding the difference is crucial for making informed investment decisions.
3.1 Trailing Profits: The Rearview Mirror
Trailing profits represent a company’s actual performance over the past 12 months. It’s a historical snapshot, showing how much profit the company actually generated.
Think of it (training profits) as looking in the rearview mirror while driving. You can see where you’ve been, but it doesn’t tell you where you’re going.
Trailing profits are based on concrete numbers, making them a reliable starting point. They provide a tangible sense of the company’s profitability. However, relying solely on past performance can be misleading.
The business environment is constantly changing. What worked well in the past might not work in the future. For example, a company might have had a stellar year due to a temporary surge in demand, but that demand might not be sustainable.
3.2 Forward Earnings: Gazing into the Crystal Ball
Forward earnings, on the other hand, are estimates of what a company is expected to earn over the next 12 months. It’s like looking into a crystal ball, trying to predict the future.
These estimates are based on a variety of factors, including:
- Industry trends: Are the company’s products or services in growing demand?
- Economic forecasts: Is the overall economy expected to grow or contract?
- Company guidance: What is the company’s management projecting for future sales and profits?
Forward earnings can provide valuable insights into a company’s potential. However, it’s crucial to remember that they are estimates and can be inaccurate. They are subject to the biases of the analysts or the company management providing the guidance.
Unexpected events, like economic downturns, regulatory changes, or competitive pressures, can significantly impact a company’s future earnings. Hence. we must treat them as informed guesses rather than guaranteed outcomes.
4. What I think about P/E Ratios and Investment Decisions
For me, the P/E ratio is like a good starting point in a conversation. It’s never the whole conversation. Here’s how I personally approach using P/E ratios in my investment process:
- Industry Context is Crucial: Comparing P/E ratios across different industries is like comparing apples and oranges. For instance, a high-growth tech company often commands a higher P/E because investors anticipate significant future earnings jump. A more mature, stable banking sector stock may have a lower P/E, reflecting its slower but steadier growth. Understanding industry norms is a key to judge the valuations.

[This chart visually demonstrates how P/E ratios can vary significantly across different industries. It reinforces the point about how different can be P/E from industry to industry.]
- History Speaks: I always check how a company’s P/E has behaved over time. If a company usually trades at a P/E of 15, and it’s now at 25, it raises a flag. Is there a real reason for the market to value it so much higher now? Is the sector hyped? This isn’t a sell signal by default, but it demands further digging. A P/E significantly below its historical average can also be interesting, potentially indicating undervaluation, but again, why is it low?
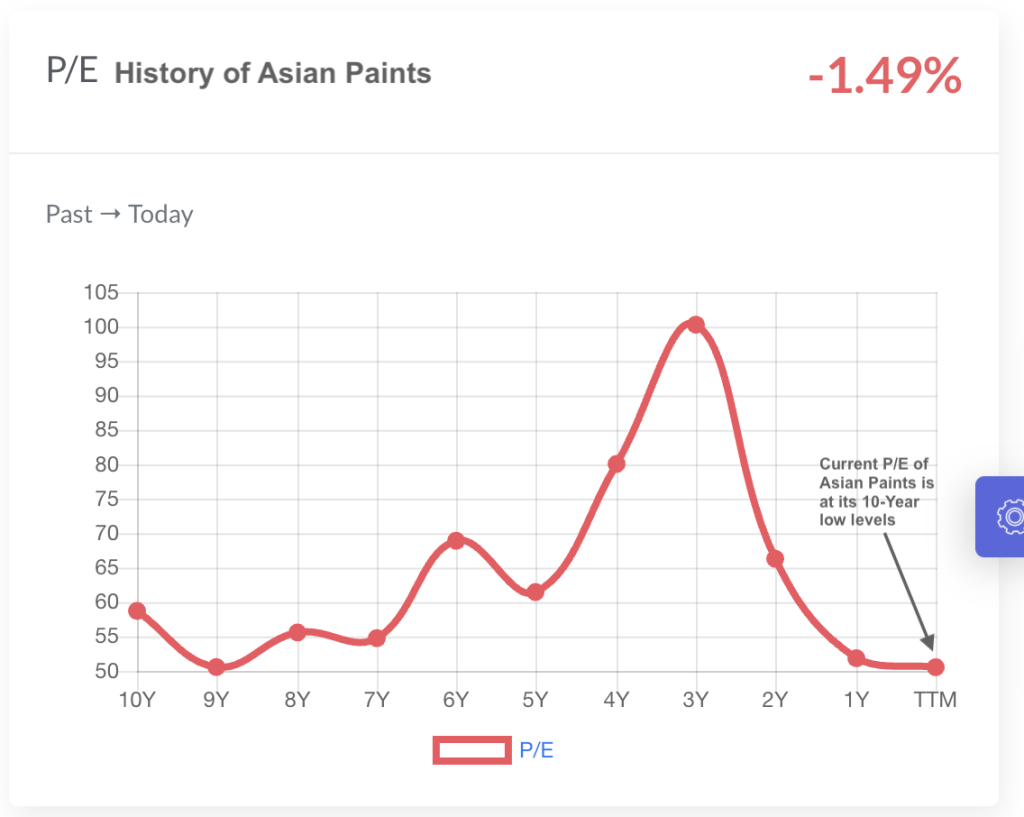
[The above helps us to visually that at the current levels of 50.5, the P/E of Asian Paints is at its 50 Year lowest levels]
- Growth Needs Reality Check: High-growth companies can justify higher P/Es. But I always look at how the company is planning to achieve that growth. Is it sustainable? Is it based on sound business fundamentals, or simply on hype? A startup promising unrealistic future revenues is a red flag, even if the P/E seems justified on paper. I like to see a tangible path to profitability.
P/E is just one piece of the puzzle. Think of a company’s financials as a “thali” – you need a variety of dishes (financial ratios and metrics) to get a balanced view. I pay close attention to debt levels (is the company taking on too much risk?), cash flow (is it generating enough cash to sustain its operations?), management quality (do they have a good track record?), and the overall competitive landscape (moat) (is it facing stiff competition that could erode its earnings?). A great P/E, offset by high debt or poor management, is not attractive.
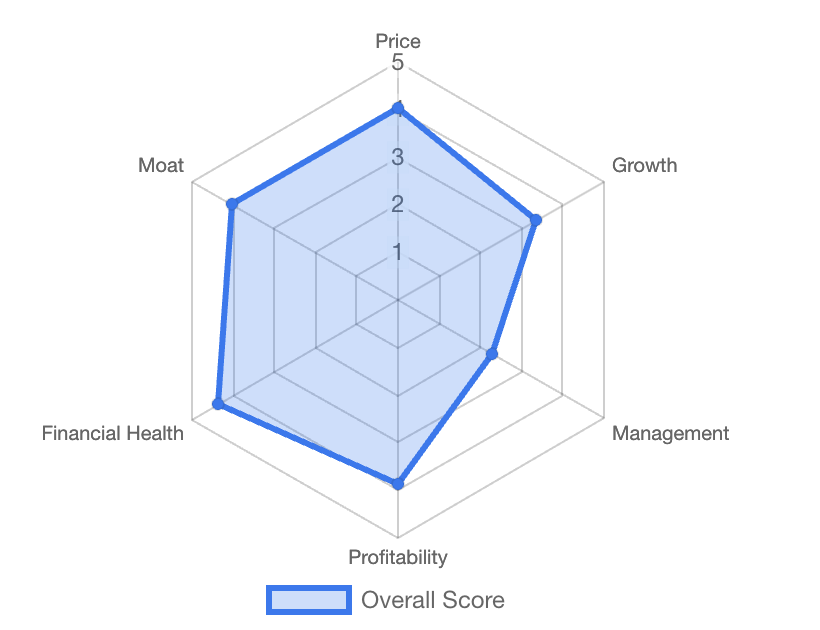
[The above spider diagram is an extract from my Stock Engine. It is a pictorial representation of how six individual components of a company builds its Overall Score. For example, P/E is a part of Price. Debt, cash flow is a part of Financial Health, Moat highlights the monopoly status of a company, etc]
5. The US vs. India (P/E)
One thing to keep in mind is that different markets often have different P/E ratios.
For example, US equities tend to trade at a higher P/E ratio than Indian equities. This is partly because the US has a more mature and stable economy. Their have a stronger corporate earnings and a more developed stock market.
But it doesn’t mean that Indian stocks are necessarily undervalued.
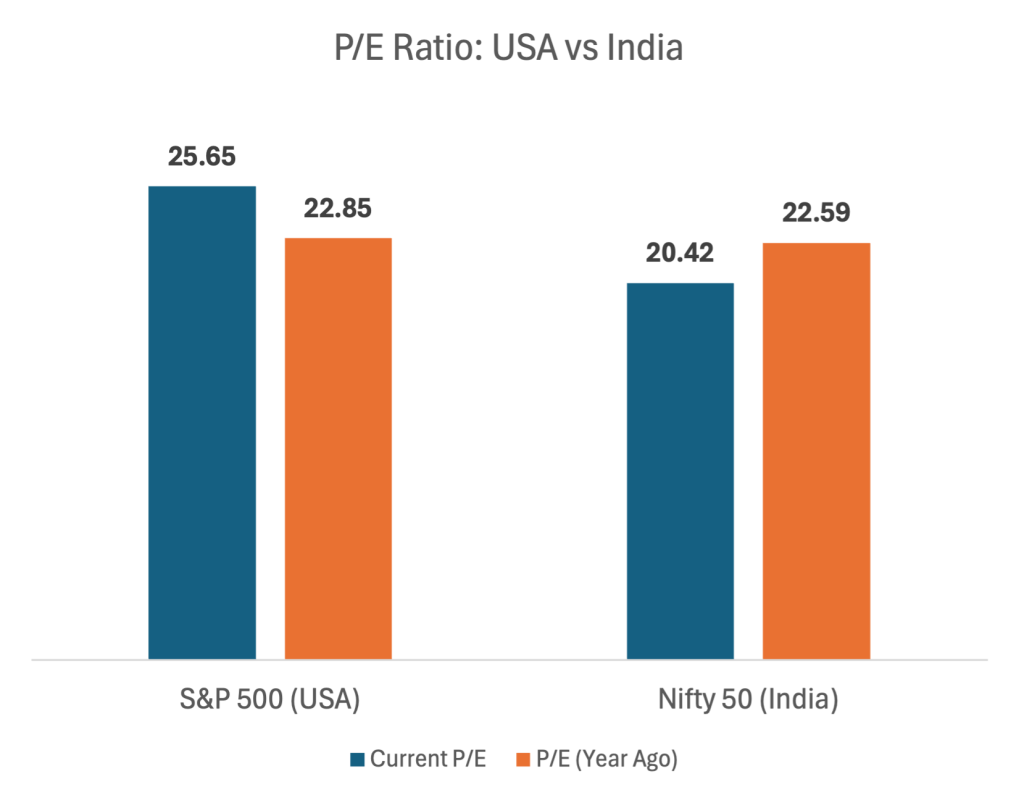
[The above chart provides a visual comparison of P/E ratios between the Indian and US stock markets. It supports our point about differing valuations prevailing in different countries. Even though, at a P/E of 20.42 (vs PE 25.65), FII’s are preferring to invest in the US pulling money out from the Indian market.]
Suggested Reading: Market Sell-Off: How the US Fed, Weak Rupee, and Rising Trade Deficit Are Impacting Indian Investors.
6. Remember the “Rerating” Game
Imagine you’re looking to buy a house. Suddenly, a big infrastructure project (like a new metro line) gets announced near that area. Even if the house itself hasn’t changed, its perceived value goes up, right?
So what is the result? Investors are now willing to pay more for the same house because they expect the area to become more desirable. That’s “rerating” in the stock market.
It happens when investors’ optimism about a company’s future increases. As a result, they are willing to pay more for each rupee of its earnings (supports a higher P/E ratio).
A good example is Adani Green Energy. In 2021-2022, as India pushed hard for renewable energy, investor sentiment towards companies like Adani Green soared. Even if the company’s actual earnings hadn’t drastically changed yet, investors were expecting huge future growth due to government policies and increasing demand for green energy. This led to a rerating – the stock price went up significantly before the earnings fully caught up. Why? Simply because investors were now much more confident about the company’s prospects and willing to pay a premium.
Of course, reratings can be followed by corrections if the initial expectations are not met.
Conclusion
So, do company earnings matter for stock investors?
Absolutely! But don’t get too caught up in the numbers. Remember that the stock market is a complex and dynamic. You need to consider a variety of factors and use your own judgment to make informed investment decisions.
Think of it like cooking a delicious biryani. You can’t just rely on the recipe. You need to understand the ingredients, adjust the spices to your taste, and use your own intuition to create a culinary masterpiece.
Similarly, in the stock market, you need to understand the fundamentals, analyze the trends, and use your own judgment to build a winning portfolio.
Have a Happy Investing.