Let’s chat about what’s happening in the U.S. housing market right now. I just got my hands on the latest housing market trends report from Realtor.com for February 2025, and there’s a lot to unpack. Whether you’re thinking about buying your first home, selling your current place, or just curious about where the market’s headed, I’m here to break it all down for you in a way that actually makes sense. So, let’s dive in!
Inventory Is Up, But It’s Still Not Quite “Normal”
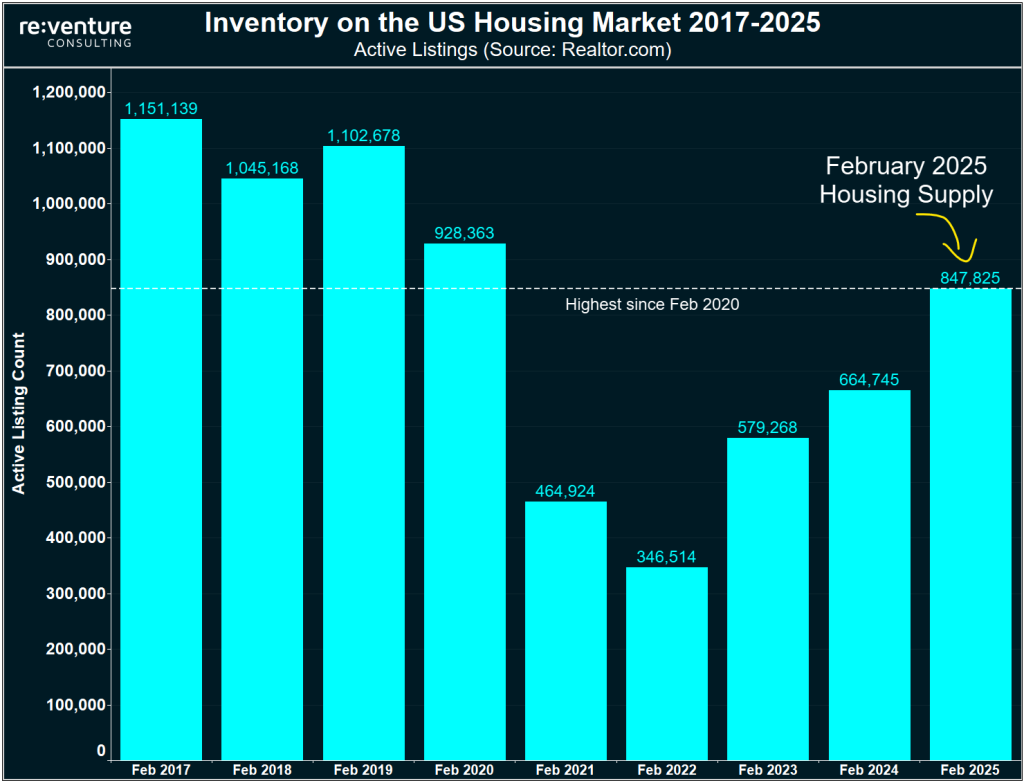
First off, let’s talk about the number of homes on the market. If you’ve been keeping an eye on housing trends, you’ll be happy to hear that there were 27.5% more homes actively for sale this February compared to last year. That’s the 16th month in a row we’ve seen inventory grow, which is great news for buyers who’ve been struggling to find options.
In fact, the chart I looked at shows there were 847,825 active listings this February—the highest for any February since 2020, when we had 928,363 listings. That’s a big jump from the low of 346,514 listings we saw in February 2022, during the height of the post-pandemic frenzy.
But before you get too excited, let’s put this in perspective.
- While inventory is up compared to last year, it’s still 22.9% below the levels we saw between 2017 and 2019 (before COVID-19). So, yes, there are more homes to choose from, but we’re not quite back to the “normal” market of the late 2010s.
- For buyers, this means you’ve got more options than you did a couple of years ago, but you might still need to act fast in competitive areas.
- For sellers, it’s a sign that the market is cooling a bit, and you might need to be more strategic to stand out.
Sellers Are Getting More Active
Here’s another interesting tidbit: more people are listing their homes.
Newly listed homes were up 5.1% compared to last February, which is the highest February level since 2021. The West is leading the charge here, with new listings up a whopping 14.4% year over year. Cities like San Jose, San Francisco, and Los Angeles saw the biggest jumps in new listings, with increases of 28%, 27.2%, and 27.1%, respectively.
It seems like some sellers who were waiting for better conditions, like lower interest rates, might be getting tired of holding off and are jumping into the market now.
But here’s the catch, even though more homes are being listed, sellers are having to adjust their expectations. A whopping 16.8% of listings had price cuts in February, up from 14.6% last year. That’s the highest share of price reductions for any February since at least 2016, according to the report.
In places like Denver, Charlotte, and Tucson, the share of homes with price cuts jumped by 8, 6.4, and 6.3 percentage points, respectively.
This tells me that sellers are starting to feel the pressure of a slower market. If you’re selling, you might need to price your home realistically from the get-go—or be prepared to lower your asking price if you don’t get bites quickly.
Home Prices
Now, let’s talk about prices, because I know that’s on everyone’s mind.
The median list price this February was $412,000, which is actually down 0.8% from last year.
That might sound like good news for buyers, but hold on, there’s more to the story. The report points out that more smaller homes are being listed this year, which is pulling the median price down. When you look at the median list price per square foot (which adjusts for home size), prices are actually up 1.2% compared to last year.
So, while the overall median price dipped, the value of homes is still creeping up.
Here’s where it gets regional.
- The South saw the biggest drop in median list price, down 2%, while the Northeast held steady.
- But when you look at price per square foot, the Northeast is actually seeing the strongest growth, up 2.9%, while the South is down slightly by 0.1%.
- If you’re in a market like Cleveland, Providence, or Hartford, you’re seeing some of the biggest price gains, with median list prices up 14%, 7%, and 6.6%, respectively.
- On the flip side, if you’re in a place like Washington, DC, prices per square foot are down 3.3% year over year, which might give buyers a bit more negotiating power.
For sellers, this means you’ll need to pay close attention to what’s happening in your local market. A national trend might not match what’s going on in your city.
And for buyers, while prices are softening in some areas, don’t expect a fire sale anytime soon, home values are still 39.2% higher than they were in February 2019, and the price per square foot is up 54.8% over the same period.
Homes Are Sitting on the Market Longer
Another sign the market is cooling? Homes are taking longer to sell.
The typical home spent 66 days on the market this February, which is five days more than last year. That’s the 11th month in a row that time on the market has increased year over year. In places like Portland, Nashville, Atlanta, and Jacksonville, homes are sitting even longer, Portland saw the biggest jump, with homes spending 21 more days on the market compared to last year.
But here’s the silver lining.
Homes are still moving faster than they did before the pandemic. Compared to the 2017–2019 average, homes are selling 11 days quicker. In the Midwest and Northeast, homes are moving especially fast compared to pre-pandemic levels, 19 and 24 days less, respectively.
So, while the market is slowing, it’s not exactly a buyer’s paradise just yet. If you’re a buyer, this extra time on the market gives you a bit more breathing room to make a decision. If you’re a seller, you might need to make your home stand out with great staging, professional photos, or a competitive price to avoid a long wait.
What About Interest Rates?
Let’s talk about the lock-in effect.
One big factor slowing things down is interest rates. Mortgage rates were higher in January and February 2025 compared to late 2024, which likely put a damper on buyer activity. The report mentions a “lock-in” effect, where homeowners who locked in super-low rates during the pandemic (think 3% or lower) are reluctant to sell and buy a new home at today’s higher rates (closer to 6–7%).
But there’s hope on the horizon, the report forecasts that rates will ease a bit in 2025, which should help chip away at this lock-in effect. They’re predicting home sales will rise modestly by 1.5% this year as a result.
- For buyers, this means you might want to keep an eye on rates over the next few months. If they dip, you could snag a better deal on your mortgage.
- For sellers, lower rates might bring more buyers into the market, but it could also mean more competition from other sellers who’ve been waiting for the right moment to list.
The Federal Workforce Factor
Here’s a curveball I didn’t expect, the Trump administration’s cost-cutting policies are starting to impact federal employees, and that could ripple into the housing market.
Areas with a lot of government workers, like Washington, DC, and Virginia Beach, might see changes if more federal jobs are cut or employees relocate. So far, the report says there’s no clear impact on housing trends in these areas.
In DC, for example, price reductions are up 2.3% year over year, which is pretty in line with the national trend, and the median list price per square foot is down 3.3%. But the report notes that price reductions in DC have been creeping up throughout February, so this could be something to watch as the spring market heats up.
If you’re in one of these federal workforce hubs, I’d recommend keeping a close eye on local job trends. If more people start leaving government roles, you might see more homes hit the market, or fewer buyers if the local economy takes a hit.
What Does This All Mean for You?
Alright, let’s get practical. Here’s how these trends might affect you, whether you’re buying or selling:
- For Buyers: This market is looking a bit more favorable for you than it has in recent years. With more inventory, longer time on the market, and more sellers cutting prices, you’ve got a bit more room to negotiate. That said, don’t expect prices to drop dramatically, home values are still rising when you account for size, and in some markets, competition is still fierce. Keep an eye on interest rates, and if you’re in a market with a lot of federal employees, watch for any shifts in the local economy that might impact housing.
- For Sellers: The market is cooling, and you might need to adjust your expectations. Price your home competitively from the start, and be prepared to lower your asking price if you don’t get offers quickly. Focus on making your home stand out, great curb appeal, updated features, and professional staging can make a big difference. And if you’re in a region like the West or South, where inventory is growing the fastest, you’ll need to be extra strategic to attract buyers.
Conclusion
The February 2025 housing market report paints a picture of a market in transition.
There are the quick observations:
- We’re seeing more inventory,
- Longer selling times, and
- More price cuts.
All point to a cooling market.
But with home values still rising (at least per square foot) and sales expected to tick up modestly this year, it’s not a complete buyer’s market just yet.
For both buyers and sellers, this means you’ve got opportunities, but you’ll need to be more strategic.
I hope this breakdown helps you make sense of what’s going on. If you’re thinking about jumping into the market this spring, now’s the time to start doing your homework.
What do you think about these trends? Are you seeing similar patterns in your area? Tell me in the comments section below.
Have a happy investing.