Ajanta Pharma share price is currently trading at range close to its intrinsic value. Hence it looks exciting.
But before looking at its financials in more detail, lets know more about this company.
Introduction: Ajanta Pharma got itself listed in BSE and NSE in year 2000.
As its name suggests, it is a Pharmaceutical company. They are in the business of development, manufacturing and sale of “Branded Generic” and “Generic” Pharma products.
Their branded generic products are sold in India and outside India. Outside India, they have presence in Africa (Nigeria), Middle East, and South East Asia (Philippines).
The outside India market of Ajanta Pharma is the major contributor to its sales revenue.
Outside India, they do business in “Anti-Biotic, Anti-Malarial, Anti-Diabetic, Cardiology, Gynecology, Orthopedics, Pediatric, Respiratory & General Health products”.
Ajanta Pharma is also venturing into US market with their Generic Drugs. It began sales in US market only in 2013. In coming years, they expect US market to be their key “growth driver”.
The company has its R&D Facility in Mumbai having 800+ scientists.
The company has Seven (7) manufacturing facility. Four (4) are in Aurangabad (Maharashtra), other three (3) in Dahej- Gujarat, Guwahati-Assam, and Mauritius.
Their Guwahati manufacturing facility was inaugurated in 2017. In terms of Area, this is their biggest facility having 51,000+ sqm built-up area.
The company also does major business with Indian Government. It supplies to Armed Forces, Government Canteens, hospitals and stores managed by the Government.
Currently, Ajanta Pharma is led by Yogesh Agarwal (MD) and Rajesh Agarwal (Jt. MD). Yogesh Agarwal is a MBA from Johnson & Whales University, USA. Rajesh Agarwal is also a MBA from Bentley College, USA.
Ajanta Pharma was founded in 1973 by Mannalal Agarwal, Puroshottam Agarwal and Madhusudan Agarwal. Yogesh and Rajesh are son’s of Mannalal Agarwal.
Ajanta Pharma is a company in which its promoters has about 73% holding. This is a very good sign.
Companies in which the promoters has large share, are generally better managed.
Ajanta Pharma Share Price
Ajanta Pharma is not a very big player in the Indian Pharma Industry. But still it attracts attention.
In year 2004, it reported-annual-income was Rs.116.98 Crore.
In Mar’2017 (after 14 years), its reported annual income is Rs.1,889.66 Crore. This means a CAGR of 18% per annum.
In a sector which is so competitive and regulated, surviving and churning a 18% CAGR growth is worth noting.
Lets see how its stock price has behaved in last 5 years:
In Oct’2013, stock price of Ajanta Pharma was was at Rs.350 levels.
By the Sep’16, stock price of Ajanta Pharma jumped to Rs.1,960 levels (CAGR : 41.1%, in 14 years).
Today in Oct’2017, the stock price of Ajanta Pharma is trading at Rs.1,225 levels.
In a span of just 13 months (Sep’16 to Oct’17) there is a large price dip (-34.1%).
Such big fall in last 1 year prompted me to check the business fundamentals of Ajanta Pharma.
The result of my analysis is presented here for my readers knowledge…
Short Term Price Trend of Ajanta Pharma:
In last 12 months, there has been fair volatility in Ajanta Pharma share price.
- SMA 3 months – shows a price decline of -2.88%.
- SMA 6 months – shows a price growth of 4.49%.
- SMA 9 months – shows a price growth of 1.57%.
- SMA 12 months – shows a price decline of -4.18%.
I use my stock analysis worksheet to generate SMA for my stocks. For Ajanta Pharma the chart looks like this:
Lets do a detailed fundamental analysis of Ajanta Pharma.
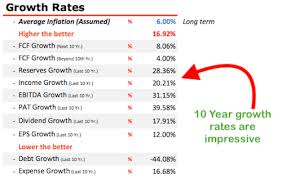
#1. Growth Rates:
I personally like stocks which show’s consistent growth in its past.
It becomes particularly interesting for me when I see a double digit growth rates.
The financial parameters that like seeing grow in a stock are as below:
- Free Cash Flow Growth
- Reserves Growth
- Income Growth
- Profit Growth
- Dividend Growth &
- EPS growth (my favorite)
I use my stock analysis worksheet to quantify all these values. This is the result for Ajanta Pharma:
#2. Financial Ratios
The use of financial ratios helps users to comprehend the numbers easily. It helps to compare apple to apple.
Financial ratios also helps us to make the first impression about the stocks, before digging into the details.
The ratios that my worksheet highlights prominently are as below:
- Price Valuation
- Price to Earning Ratio (P/E)
- Price to Book Value Ratio (P/B)
- Price to Sales Ratio (P/S)
- Price to Free Cash Flow (P/FCF)
- Profitability
- Return on Equity (ROE)
- Return on Capital Employed (RoCE)
- Cash Returned on Invested Capital (CROIC)
I use my stock analysis worksheet to quantify all these values. This is the result for Ajanta Pharma:
#3. Important Miscellaneous Data
Before investing, it is important to look at a few indicators that gives a rough idea about the current position of the stocks price.
What are these few indicators?
- Current price compared to its 52W high and Low price.
- How much the price changed in last 30 days and 12 months.
- What is the market cap.
- Compared to the Industry P/E, what is the P/E of stock.
- What is the price growth in last 3Y, 5Y and 10Y.
- What is the average dividend yield in last 3Y, 5Y and 10Y.
I use my stock analysis worksheet to get quick answers to these questions. This is the result for Ajanta Pharma:
#4. Price Chart of Last 10 Years
Why I like to see price chart?
Frankly speaking price charts tell very less about a stock (unless you are a technical analyst).
But I still like to give it a glance. Why? It gives an idea of how the current price is placed compared to last 10 years trend.
There can be few scenarios here:
- If price is only bullish – current price can be overvalued.
- If Price is remaining modest – poses a question why price is not growing fast enough?
- When price is falling – current price can be undervalued or business fundamentals may be weakening.
I use my stock analysis worksheet to generate the 10 Year price chart. This is the result for Ajanta Pharma:
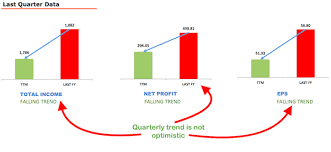
#5. Quarterly Trends
Why to look at quarterly results?
For long term investors, long term trends are more valuable. But it is also essential that the investor should not miss noting the short term trends.
If in short term term, the income, earnings are falling, it poses a risk.
Investor must get the answers for the Why’s before proceeding.
The quarterly trends that I refer are as below:
- Total Income – TTM data verses last FY data (if rising or falling).
- Net Profit – TTM data verses last FY data (if rising or falling).
- Earning Per Share (EPS) – TTM data verses last FY data (if rising or falling).
I use my stock analysis worksheet to get pictorial chart for the above important informations. This is the result for Ajanta Pharma:
#6. What is the Intrinsic Value of this stock?
This worksheet may not be accurate, but it attempts to estimate Intrinsic value of stocks.
I believe that, even if it is a rough estimation of intrinsic value, it is still worth doing it.
Because investing in a stock without comparing its intrinsic value with its current price is a big mistake.
Based on the knowledge that has been gathered, this worksheet attempts to estimate the intrinsic value of its stock.
There are several ways to estimate intrinsic value of a stock. But I rely more on the following methods.
I have incorporated all of my favourite method in my worksheet to estimate intrinsic value of stocks. An intelligent formula the generates the net intrinsic value of the stock derived from all these individual methods:
- DCF method
- NCAPS method
- Absolute PE method
- Reproduction cost method
- Benjamin Graham’s Formula
- Earning Power Value (EPV)
I use my stock analysis worksheet to estimate intrinsic value of stock. This is the result for Ajanta Pharma:
#7. What is the final conclusion?
After considering almost all aspect of stocks as discussed above, my worksheet helps its user to arrive at a final conclusion.
What is the ultimate question in stock investing? The stock is good or bad? How to arrive at this conclusion?
My stock analysis worksheet does this very nicely for me. Based on the following parameters, it generates an overall grade for its stock.
If the generated grade is above 85%, the stock is considered good.
Lets see what grades are generated for Ajanta Pharma:
- The Overall grade for Ajanta Pharma is 7%.
- The market price of Ajanta Pharma seems to be very overvalued. It scores just 40%
- In terms of future growth prospects, Ajanta Pharma scores 100%.
- Ajanta Pharma earns a high 100%for its managements efficiency.
- In terms of profitability, Ajanta Pharma scores a decent 73%.
- Financial Health of the company is presently good at 89%.
- There is no bankruptcy threat to Ajanta Pharma. It earns 100%
It must be noted that, this worksheet gives more importance to the price valuation of stock. A stock which is priced right will score higher.
This worksheet gives score to its stocks very defensively.
There are not many stocks in the market that can earn grade above 80% from this worksheet.
Ajanta Pharma has scored just 62.7%. This is a clear hint that this stock is currently trading at very overvalued price levels.
But this is one one stocks that has scored well well all other fronts.
In case of any major price correction happening in the market, this stocks becomes a good pick.
But caution must be taken in dealing with Ajanta Pharma as its estimated intrinsic value is almost 40% of its current price levels.
Conclusion
In last 1 year, CNX NIFTY PHARMA INDEX in India has seen a dip of 17.1%.
Needless to say that this sector have been facing few major problems since 2016.
The major concerns are originating from US FDA’s.
But at the moment, Ajanta Pharma is not as exposed to US market as its competitors. Though it has presence in US, but it is still safe for the moment.
The recent Ajanta Pharma share price fall can be attributable to the problems related to the pharma sector as a whole.
I personally feel that Ajanta Pharma is not to be directly blamed for this downward trend.
In times to come (2-3 years), Ajanta Pharma may show more than reasonable performance.